|
|
市場調査レポート
商品コード
1502310
エンターテインメント・ロボットの世界市場 2024-2028Global entertainment robots market 2024-2028 |
||||||

|
|||||||
カスタマイズ可能
|
|||||||


| エンターテインメント・ロボットの世界市場 2024-2028 |
|
出版日: 2024年05月21日
発行: TechNavio
ページ情報: 英文 170 Pages
納期: 即納可能
|

全表示
- 概要
- 図表
- 目次
エンターテインメント・ロボット市場は2023-2028年に968億8,200万米ドル、予測期間中のCAGRは34.24%で成長すると予測されます。
当レポートでは、エンターテインメント・ロボット市場の全体的な分析、市場規模・予測、動向、成長促進要因、課題、約25のベンダーを網羅したベンダー分析などを掲載しています。
現在の市場シナリオ、最新動向と促進要因、市場環境全体に関する最新分析を提供しています。市場は、レジャー目的のエンターテインメント・ロボット需要の増加、STEM教育におけるエンターテインメント・ロボットの採用、教育用ロボットにおけるAIの採用などが牽引しています。
| 市場範囲 | |
|---|---|
| 基準年 | 2024 |
| 終了年 | 2028 |
| 予測期間 | 2024-2028 |
| 成長モメンタム | 加速 |
| 前年比2024年 | 26.96% |
| CAGR | 34.24% |
| 増分額 | 968億8,200万米ドル |
本調査では、今後数年間におけるエンターテインメント・ロボット市場の成長を促進する主な要因の一つとして、コラボレーションや新製品の発売への注目が高まっていることを挙げています。また、ライブイベントでのエンターテインメント・ロボット使用の増加や、ベンチャーキャピタルによる投資も市場の大きな需要につながります。
目次
第1章 エグゼクティブサマリー
- 市場概要
第2章 市場情勢
- 市場エコシステム
- 市場の特徴
- バリューチェーン分析
第3章 市場規模の評価
- 市場の定義
- 市場セグメント分析
- 市場規模 2023
- 市場の見通し 2023-2028
第4章 市場規模実績
- 世界エンターテインメント・ロボット市場 2018-2022
- 製品別セグメント分析 2018-2022
- エンドユーザー別セグメント分析 2018-2022
- 地域別セグメント分析 2018-2022
- 国別セグメント分析 2018-2022
第5章 ファイブフォース分析
- ファイブフォースの要約
- 買い手の交渉力
- 供給企業の交渉力
- 新規参入業者の脅威
- 代替品の脅威
- 競争の脅威
- 市況
第6章 市場セグメンテーション:製品別
- 市場セグメンテーション
- 比較:製品別
- ロボット玩具:市場規模と予測 2023-2028
- 教育用ロボット:市場規模と予測 2023-2028
- ロボットペット:市場規模と予測 2023-2028
- 市場機会:製品別
第7章 市場セグメンテーション:エンドユーザー別
- 市場セグメンテーション
- 比較:エンドユーザー別
- メディア:市場規模と予測 2023-2028
- 教育:市場規模と予測 2023-2028
- 小売り:市場規模と予測 2023-2028
- 市場機会:エンドユーザー別
第8章 顧客情勢
- 顧客情勢の概要
第9章 地域別情勢
- 地域別セグメンテーション
- 地域別比較
- 欧州:市場規模と予測 2023-2028
- アジア太平洋:市場規模と予測 2023-2028
- 北米:市場規模と予測 2023-2028
- 中東・アフリカ:市場規模と予測 2023-2028
- 南米:市場規模と予測 2023-2028
- 米国:市場規模と予測 2023-2028
- ドイツ:市場規模と予測 2023-2028
- 中国:市場規模と予測 2023-2028
- 英国:市場規模と予測 2023-2028
- 日本:市場規模と予測 2023-2028
- 市場機会:地域別
第10章 促進要因・課題・機会・抑制要因
- 市場促進要因
- 市場の課題
- 促進要因と課題の影響
- 市場の機会・抑制要因
第11章 競合情勢
- 概要
- 競合情勢
- 混乱の状況
- 業界のリスク
第12章 競合分析
- 企業プロファイル
- 企業の市場ポジショニング
- BLUE FROG ROBOTICS SAS
- HANSON ROBOTICS Ltd.
- Hasbro Inc.
- KUKA AG
- LEGO System AS
- Mattel Inc.
- Neobotix GmbH
- PAL Robotics
- RN Chidakashi Technologies Inc.
- ROBOTIS Co. Ltd
- SoftBank Robotics Group Corp.
- Sony Group Corp.
- Sphero Inc.
- UBTECH Robotics Inc.
- WowWee Group Ltd.
第13章 付録
Exhibits:
- Exhibits1: Executive Summary - Chart on Market Overview
- Exhibits2: Executive Summary - Data Table on Market Overview
- Exhibits3: Executive Summary - Chart on Global Market Characteristics
- Exhibits4: Executive Summary - Chart on Market by Geography
- Exhibits5: Executive Summary - Chart on Market Segmentation by Product
- Exhibits6: Executive Summary - Chart on Market Segmentation by End-user
- Exhibits7: Executive Summary - Chart on Incremental Growth
- Exhibits8: Executive Summary - Data Table on Incremental Growth
- Exhibits9: Executive Summary - Chart on Company Market Positioning
- Exhibits10: Parent Market
- Exhibits11: Data Table on - Parent Market
- Exhibits12: Market characteristics analysis
- Exhibits13: Value Chain Analysis
- Exhibits14: Offerings of companies included in the market definition
- Exhibits15: Market segments
- Exhibits16: Chart on Global - Market size and forecast 2023-2028 ($ million)
- Exhibits17: Data Table on Global - Market size and forecast 2023-2028 ($ million)
- Exhibits18: Chart on Global Market: Year-over-year growth 2023-2028 (%)
- Exhibits19: Data Table on Global Market: Year-over-year growth 2023-2028 (%)
- Exhibits20: Historic Market Size - Data Table on Global Entertainment Robots Market 2018 - 2022 ($ million)
- Exhibits21: Historic Market Size - Product Segment 2018 - 2022 ($ million)
- Exhibits22: Historic Market Size - End-user Segment 2018 - 2022 ($ million)
- Exhibits23: Historic Market Size - Geography Segment 2018 - 2022 ($ million)
- Exhibits24: Historic Market Size - Country Segment 2018 - 2022 ($ million)
- Exhibits25: Five forces analysis - Comparison between 2023 and 2028
- Exhibits26: Bargaining power of buyers - Impact of key factors 2023 and 2028
- Exhibits27: Bargaining power of suppliers - Impact of key factors in 2023 and 2028
- Exhibits28: Threat of new entrants - Impact of key factors in 2023 and 2028
- Exhibits29: Threat of substitutes - Impact of key factors in 2023 and 2028
- Exhibits30: Threat of rivalry - Impact of key factors in 2023 and 2028
- Exhibits31: Chart on Market condition - Five forces 2023 and 2028
- Exhibits32: Chart on Product - Market share 2023-2028 (%)
- Exhibits33: Data Table on Product - Market share 2023-2028 (%)
- Exhibits34: Chart on Comparison by Product
- Exhibits35: Data Table on Comparison by Product
- Exhibits36: Chart on Robotic toys - Market size and forecast 2023-2028 ($ million)
- Exhibits37: Data Table on Robotic toys - Market size and forecast 2023-2028 ($ million)
- Exhibits38: Chart on Robotic toys - Year-over-year growth 2023-2028 (%)
- Exhibits39: Data Table on Robotic toys - Year-over-year growth 2023-2028 (%)
- Exhibits40: Chart on Educational robots - Market size and forecast 2023-2028 ($ million)
- Exhibits41: Data Table on Educational robots - Market size and forecast 2023-2028 ($ million)
- Exhibits42: Chart on Educational robots - Year-over-year growth 2023-2028 (%)
- Exhibits43: Data Table on Educational robots - Year-over-year growth 2023-2028 (%)
- Exhibits44: Chart on Robotic companion pets - Market size and forecast 2023-2028 ($ million)
- Exhibits45: Data Table on Robotic companion pets - Market size and forecast 2023-2028 ($ million)
- Exhibits46: Chart on Robotic companion pets - Year-over-year growth 2023-2028 (%)
- Exhibits47: Data Table on Robotic companion pets - Year-over-year growth 2023-2028 (%)
- Exhibits48: Market opportunity by Product ($ million)
- Exhibits49: Data Table on Market opportunity by Product ($ million)
- Exhibits50: Chart on End-user - Market share 2023-2028 (%)
- Exhibits51: Data Table on End-user - Market share 2023-2028 (%)
- Exhibits52: Chart on Comparison by End-user
- Exhibits53: Data Table on Comparison by End-user
- Exhibits54: Chart on Media - Market size and forecast 2023-2028 ($ million)
- Exhibits55: Data Table on Media - Market size and forecast 2023-2028 ($ million)
- Exhibits56: Chart on Media - Year-over-year growth 2023-2028 (%)
- Exhibits57: Data Table on Media - Year-over-year growth 2023-2028 (%)
- Exhibits58: Chart on Education - Market size and forecast 2023-2028 ($ million)
- Exhibits59: Data Table on Education - Market size and forecast 2023-2028 ($ million)
- Exhibits60: Chart on Education - Year-over-year growth 2023-2028 (%)
- Exhibits61: Data Table on Education - Year-over-year growth 2023-2028 (%)
- Exhibits62: Chart on Retail - Market size and forecast 2023-2028 ($ million)
- Exhibits63: Data Table on Retail - Market size and forecast 2023-2028 ($ million)
- Exhibits64: Chart on Retail - Year-over-year growth 2023-2028 (%)
- Exhibits65: Data Table on Retail - Year-over-year growth 2023-2028 (%)
- Exhibits66: Market opportunity by End-user ($ million)
- Exhibits67: Data Table on Market opportunity by End-user ($ million)
- Exhibits68: Analysis of price sensitivity, lifecycle, customer purchase basket, adoption rates, and purchase criteria
- Exhibits69: Chart on Market share By Geographical Landscape2023-2028 (%)
- Exhibits70: Data Table on Market share By Geographical Landscape2023-2028 (%)
- Exhibits71: Chart on Geographic comparison
- Exhibits72: Data Table on Geographic comparison
- Exhibits73: Chart on Europe - Market size and forecast 2023-2028 ($ million)
- Exhibits74: Data Table on Europe - Market size and forecast 2023-2028 ($ million)
- Exhibits75: Chart on Europe - Year-over-year growth 2023-2028 (%)
- Exhibits76: Data Table on Europe - Year-over-year growth 2023-2028 (%)
- Exhibits77: Chart on APAC - Market size and forecast 2023-2028 ($ million)
- Exhibits78: Data Table on APAC - Market size and forecast 2023-2028 ($ million)
- Exhibits79: Chart on APAC - Year-over-year growth 2023-2028 (%)
- Exhibits80: Data Table on APAC - Year-over-year growth 2023-2028 (%)
- Exhibits81: Chart on North America - Market size and forecast 2023-2028 ($ million)
- Exhibits82: Data Table on North America - Market size and forecast 2023-2028 ($ million)
- Exhibits83: Chart on North America - Year-over-year growth 2023-2028 (%)
- Exhibits84: Data Table on North America - Year-over-year growth 2023-2028 (%)
- Exhibits85: Chart on Middle East and Africa - Market size and forecast 2023-2028 ($ million)
- Exhibits86: Data Table on Middle East and Africa - Market size and forecast 2023-2028 ($ million)
- Exhibits87: Chart on Middle East and Africa - Year-over-year growth 2023-2028 (%)
- Exhibits88: Data Table on Middle East and Africa - Year-over-year growth 2023-2028 (%)
- Exhibits89: Chart on South America - Market size and forecast 2023-2028 ($ million)
- Exhibits90: Data Table on South America - Market size and forecast 2023-2028 ($ million)
- Exhibits91: Chart on South America - Year-over-year growth 2023-2028 (%)
- Exhibits92: Data Table on South America - Year-over-year growth 2023-2028 (%)
- Exhibits93: Chart on US - Market size and forecast 2023-2028 ($ million)
- Exhibits94: Data Table on US - Market size and forecast 2023-2028 ($ million)
- Exhibits95: Chart on US - Year-over-year growth 2023-2028 (%)
- Exhibits96: Data Table on US - Year-over-year growth 2023-2028 (%)
- Exhibits97: Chart on Germany - Market size and forecast 2023-2028 ($ million)
- Exhibits98: Data Table on Germany - Market size and forecast 2023-2028 ($ million)
- Exhibits99: Chart on Germany - Year-over-year growth 2023-2028 (%)
- Exhibits100: Data Table on Germany - Year-over-year growth 2023-2028 (%)
- Exhibits101: Chart on China - Market size and forecast 2023-2028 ($ million)
- Exhibits102: Data Table on China - Market size and forecast 2023-2028 ($ million)
- Exhibits103: Chart on China - Year-over-year growth 2023-2028 (%)
- Exhibits104: Data Table on China - Year-over-year growth 2023-2028 (%)
- Exhibits105: Chart on UK - Market size and forecast 2023-2028 ($ million)
- Exhibits106: Data Table on UK - Market size and forecast 2023-2028 ($ million)
- Exhibits107: Chart on UK - Year-over-year growth 2023-2028 (%)
- Exhibits108: Data Table on UK - Year-over-year growth 2023-2028 (%)
- Exhibits109: Chart on Japan - Market size and forecast 2023-2028 ($ million)
- Exhibits110: Data Table on Japan - Market size and forecast 2023-2028 ($ million)
- Exhibits111: Chart on Japan - Year-over-year growth 2023-2028 (%)
- Exhibits112: Data Table on Japan - Year-over-year growth 2023-2028 (%)
- Exhibits113: Market opportunity By Geographical Landscape($ million)
- Exhibits114: Data Tables on Market opportunity By Geographical Landscape($ million)
- Exhibits115: Impact of drivers and challenges in 2023 and 2028
- Exhibits116: Overview on criticality of inputs and factors of differentiation
- Exhibits117: Overview on factors of disruption
- Exhibits118: Impact of key risks on business
- Exhibits119: Companies covered
- Exhibits120: Matrix on companies position and classification
- Exhibits121: BLUE FROG ROBOTICS SAS - Overview
- Exhibits122: BLUE FROG ROBOTICS SAS - Product / Service
- Exhibits123: BLUE FROG ROBOTICS SAS - Key offerings
- Exhibits124: HANSON ROBOTICS Ltd. - Overview
- Exhibits125: HANSON ROBOTICS Ltd. - Product / Service
- Exhibits126: HANSON ROBOTICS Ltd. - Key offerings
- Exhibits127: Hasbro Inc. - Overview
- Exhibits128: Hasbro Inc. - Business segments
- Exhibits129: Hasbro Inc. - Key offerings
- Exhibits130: Hasbro Inc. - Segment focus
- Exhibits131: KUKA AG - Overview
- Exhibits132: KUKA AG - Business segments
- Exhibits133: KUKA AG - Key offerings
- Exhibits134: KUKA AG - Segment focus
- Exhibits135: LEGO System AS - Overview
- Exhibits136: LEGO System AS - Product / Service
- Exhibits137: LEGO System AS - Key news
- Exhibits138: LEGO System AS - Key offerings
- Exhibits139: Mattel Inc. - Overview
- Exhibits140: Mattel Inc. - Business segments
- Exhibits141: Mattel Inc. - Key news
- Exhibits142: Mattel Inc. - Key offerings
- Exhibits143: Mattel Inc. - Segment focus
- Exhibits144: Neobotix GmbH - Overview
- Exhibits145: Neobotix GmbH - Product / Service
- Exhibits146: Neobotix GmbH - Key offerings
- Exhibits147: PAL Robotics - Overview
- Exhibits148: PAL Robotics - Product / Service
- Exhibits149: PAL Robotics - Key offerings
- Exhibits150: RN Chidakashi Technologies Inc. - Overview
- Exhibits151: RN Chidakashi Technologies Inc. - Product / Service
- Exhibits152: RN Chidakashi Technologies Inc. - Key offerings
- Exhibits153: ROBOTIS Co. Ltd - Overview
- Exhibits154: ROBOTIS Co. Ltd - Product / Service
- Exhibits155: ROBOTIS Co. Ltd - Key news
- Exhibits156: ROBOTIS Co. Ltd - Key offerings
- Exhibits157: SoftBank Robotics Group Corp. - Overview
- Exhibits158: SoftBank Robotics Group Corp. - Product / Service
- Exhibits159: SoftBank Robotics Group Corp. - Key offerings
- Exhibits160: Sony Group Corp. - Overview
- Exhibits161: Sony Group Corp. - Business segments
- Exhibits162: Sony Group Corp. - Key news
- Exhibits163: Sony Group Corp. - Key offerings
- Exhibits164: Sony Group Corp. - Segment focus
- Exhibits165: Sphero Inc. - Overview
- Exhibits166: Sphero Inc. - Product / Service
- Exhibits167: Sphero Inc. - Key news
- Exhibits168: Sphero Inc. - Key offerings
- Exhibits169: UBTECH Robotics Inc. - Overview
- Exhibits170: UBTECH Robotics Inc. - Product / Service
- Exhibits171: UBTECH Robotics Inc. - Key news
- Exhibits172: UBTECH Robotics Inc. - Key offerings
- Exhibits173: WowWee Group Ltd. - Overview
- Exhibits174: WowWee Group Ltd. - Product / Service
- Exhibits175: WowWee Group Ltd. - Key offerings
- Exhibits176: Inclusions checklist
- Exhibits177: Exclusions checklist
- Exhibits178: Currency conversion rates for US$
- Exhibits179: Research methodology
- Exhibits180: Information sources
- Exhibits181: Data validation
- Exhibits182: Validation techniques employed for market sizing
- Exhibits183: Data synthesis
- Exhibits184: 360 degree market analysis
- Exhibits185: List of abbreviations
The entertainment robots market is forecasted to grow by USD 96882 mn during 2023-2028, accelerating at a CAGR of 34.24% during the forecast period. The report on the entertainment robots market provides a holistic analysis, market size and forecast, trends, growth drivers, and challenges, as well as vendor analysis covering around 25 vendors.
The report offers an up-to-date analysis regarding the current market scenario, the latest trends and drivers, and the overall market environment. The market is driven by increasing demand for entertainment robots for leisure purposes, adoption of entertainment robots in STEM teaching, and adoption of AI in educational robots.
Technavio's entertainment robots market is segmented as below:
| Market Scope | |
|---|---|
| Base Year | 2024 |
| End Year | 2028 |
| Series Year | 2024-2028 |
| Growth Momentum | Accelerate |
| YOY 2024 | 26.96% |
| CAGR | 34.24% |
| Incremental Value | $96882mn |
By Product
- Robotic toys
- Educational robots
- Robotic companion pets
By End-user
- Media
- Education
- Retail
By Geography
- Europe
- APAC
- North America
- Middle East and Africa
- South America
This study identifies the increasing focus on collaboration and launch of new products as one of the prime reasons driving the entertainment robots market growth during the next few years. Also, rising use of entertainment robots at live events and investments by venture capitalists will lead to sizable demand in the market.
The report on the entertainment robots market covers the following areas:
- Entertainment robots market sizing
- Entertainment robots market forecast
- Entertainment robots market industry analysis
The robust vendor analysis is designed to help clients improve their market position, and in line with this, this report provides a detailed analysis of several leading entertainment robots market vendors that include BLUE FROG ROBOTICS SAS, fischerwerke GmbH and Co. KG, HANSON ROBOTICS Ltd., Hasbro Inc., Intuitive Robots, KUKA AG, LEGO System AS, Mattel Inc., Modular Robotics Inc., Neobotix GmbH, PAL Robotics, RN Chidakashi Technologies Inc., ROBOTIS Co. Ltd., RobotShop Inc., Sarcos Technology and Robotics Corp., SoftBank Robotics Group Corp., Sony Group Corp., Sphero Inc., UBTECH Robotics Inc., and WowWee Group Ltd.. Also, the entertainment robots market analysis report includes information on upcoming trends and challenges that will influence market growth. This is to help companies strategize and leverage all forthcoming growth opportunities.
The study was conducted using an objective combination of primary and secondary information including inputs from key participants in the industry. The report contains a comprehensive market and vendor landscape in addition to an analysis of the key vendors.
The publisher presents a detailed picture of the market by the way of study, synthesis, and summation of data from multiple sources by an analysis of key parameters such as profit, pricing, competition, and promotions. It presents various market facets by identifying the key industry influencers. The data presented is comprehensive, reliable, and a result of extensive research - both primary and secondary. The market research reports provide a complete competitive landscape and an in-depth vendor selection methodology and analysis using qualitative and quantitative research to forecast the accurate market growth.
Table of Contents
1 Executive Summary
- 1.1 Market overview
- Executive Summary - Chart on Market Overview
- Executive Summary - Data Table on Market Overview
- Executive Summary - Chart on Global Market Characteristics
- Executive Summary - Chart on Market by Geography
- Executive Summary - Chart on Market Segmentation by Product
- Executive Summary - Chart on Market Segmentation by End-user
- Executive Summary - Chart on Incremental Growth
- Executive Summary - Data Table on Incremental Growth
- Executive Summary - Chart on Company Market Positioning
2 Market Landscape
- 2.1 Market ecosystem
- Parent Market
- Data Table on - Parent Market
- 2.2 Market characteristics
- Market characteristics analysis
- 2.3 Value chain analysis
- Value Chain Analysis
3 Market Sizing
- 3.1 Market definition
- Offerings of companies included in the market definition
- 3.2 Market segment analysis
- Market segments
- 3.3 Market size 2023
- 3.4 Market outlook: Forecast for 2023-2028
- Chart on Global - Market size and forecast 2023-2028 ($ million)
- Data Table on Global - Market size and forecast 2023-2028 ($ million)
- Chart on Global Market: Year-over-year growth 2023-2028 (%)
- Data Table on Global Market: Year-over-year growth 2023-2028 (%)
4 Historic Market Size
- 4.1 Global Entertainment Robots Market 2018 - 2022
- Historic Market Size - Data Table on Global Entertainment Robots Market 2018 - 2022 ($ million)
- 4.2 Product segment analysis 2018 - 2022
- Historic Market Size - Product Segment 2018 - 2022 ($ million)
- 4.3 End-user segment analysis 2018 - 2022
- Historic Market Size - End-user Segment 2018 - 2022 ($ million)
- 4.4 Geography segment analysis 2018 - 2022
- Historic Market Size - Geography Segment 2018 - 2022 ($ million)
- 4.5 Country segment analysis 2018 - 2022
- Historic Market Size - Country Segment 2018 - 2022 ($ million)
5 Five Forces Analysis
- 5.1 Five forces summary
- Five forces analysis - Comparison between 2023 and 2028
- 5.2 Bargaining power of buyers
- Bargaining power of buyers - Impact of key factors 2023 and 2028
- 5.3 Bargaining power of suppliers
- Bargaining power of suppliers - Impact of key factors in 2023 and 2028
- 5.4 Threat of new entrants
- Threat of new entrants - Impact of key factors in 2023 and 2028
- 5.5 Threat of substitutes
- Threat of substitutes - Impact of key factors in 2023 and 2028
- 5.6 Threat of rivalry
- Threat of rivalry - Impact of key factors in 2023 and 2028
- 5.7 Market condition
- Chart on Market condition - Five forces 2023 and 2028
6 Market Segmentation by Product
- 6.1 Market segments
- Chart on Product - Market share 2023-2028 (%)
- Data Table on Product - Market share 2023-2028 (%)
- 6.2 Comparison by Product
- Chart on Comparison by Product
- Data Table on Comparison by Product
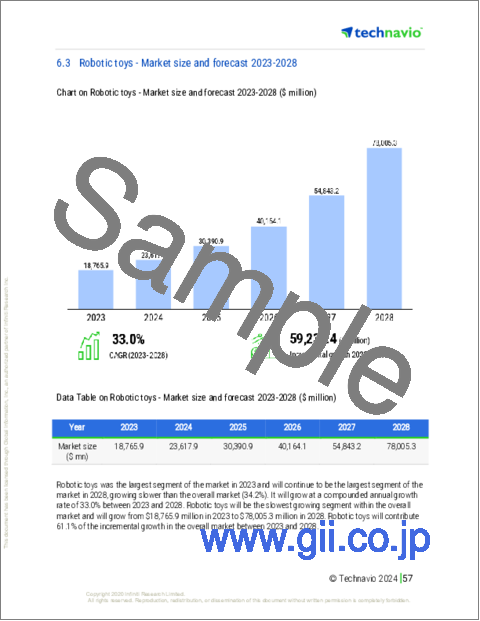
- 6.3 Robotic toys - Market size and forecast 2023-2028
- Chart on Robotic toys - Market size and forecast 2023-2028 ($ million)
- Data Table on Robotic toys - Market size and forecast 2023-2028 ($ million)
- Chart on Robotic toys - Year-over-year growth 2023-2028 (%)
- Data Table on Robotic toys - Year-over-year growth 2023-2028 (%)
- 6.4 Educational robots - Market size and forecast 2023-2028
- Chart on Educational robots - Market size and forecast 2023-2028 ($ million)
- Data Table on Educational robots - Market size and forecast 2023-2028 ($ million)
- Chart on Educational robots - Year-over-year growth 2023-2028 (%)
- Data Table on Educational robots - Year-over-year growth 2023-2028 (%)
- 6.5 Robotic companion pets - Market size and forecast 2023-2028
- Chart on Robotic companion pets - Market size and forecast 2023-2028 ($ million)
- Data Table on Robotic companion pets - Market size and forecast 2023-2028 ($ million)
- Chart on Robotic companion pets - Year-over-year growth 2023-2028 (%)
- Data Table on Robotic companion pets - Year-over-year growth 2023-2028 (%)
- 6.6 Market opportunity by Product
- Market opportunity by Product ($ million)
- Data Table on Market opportunity by Product ($ million)
7 Market Segmentation by End-user
- 7.1 Market segments
- Chart on End-user - Market share 2023-2028 (%)
- Data Table on End-user - Market share 2023-2028 (%)
- 7.2 Comparison by End-user
- Chart on Comparison by End-user
- Data Table on Comparison by End-user
- 7.3 Media - Market size and forecast 2023-2028
- Chart on Media - Market size and forecast 2023-2028 ($ million)
- Data Table on Media - Market size and forecast 2023-2028 ($ million)
- Chart on Media - Year-over-year growth 2023-2028 (%)
- Data Table on Media - Year-over-year growth 2023-2028 (%)
- 7.4 Education - Market size and forecast 2023-2028
- Chart on Education - Market size and forecast 2023-2028 ($ million)
- Data Table on Education - Market size and forecast 2023-2028 ($ million)
- Chart on Education - Year-over-year growth 2023-2028 (%)
- Data Table on Education - Year-over-year growth 2023-2028 (%)
- 7.5 Retail - Market size and forecast 2023-2028
- Chart on Retail - Market size and forecast 2023-2028 ($ million)
- Data Table on Retail - Market size and forecast 2023-2028 ($ million)
- Chart on Retail - Year-over-year growth 2023-2028 (%)
- Data Table on Retail - Year-over-year growth 2023-2028 (%)
- 7.6 Market opportunity by End-user
- Market opportunity by End-user ($ million)
- Data Table on Market opportunity by End-user ($ million)
8 Customer Landscape
- 8.1 Customer landscape overview
- Analysis of price sensitivity, lifecycle, customer purchase basket, adoption rates, and purchase criteria
9 Geographic Landscape
- 9.1 Geographic segmentation
- Chart on Market share By Geographical Landscape2023-2028 (%)
- Data Table on Market share By Geographical Landscape2023-2028 (%)
- 9.2 Geographic comparison
- Chart on Geographic comparison
- Data Table on Geographic comparison
- 9.3 Europe - Market size and forecast 2023-2028
- Chart on Europe - Market size and forecast 2023-2028 ($ million)
- Data Table on Europe - Market size and forecast 2023-2028 ($ million)
- Chart on Europe - Year-over-year growth 2023-2028 (%)
- Data Table on Europe - Year-over-year growth 2023-2028 (%)
- 9.4 APAC - Market size and forecast 2023-2028
- Chart on APAC - Market size and forecast 2023-2028 ($ million)
- Data Table on APAC - Market size and forecast 2023-2028 ($ million)
- Chart on APAC - Year-over-year growth 2023-2028 (%)
- Data Table on APAC - Year-over-year growth 2023-2028 (%)
- 9.5 North America - Market size and forecast 2023-2028
- Chart on North America - Market size and forecast 2023-2028 ($ million)
- Data Table on North America - Market size and forecast 2023-2028 ($ million)
- Chart on North America - Year-over-year growth 2023-2028 (%)
- Data Table on North America - Year-over-year growth 2023-2028 (%)
- 9.6 Middle East and Africa - Market size and forecast 2023-2028
- Chart on Middle East and Africa - Market size and forecast 2023-2028 ($ million)
- Data Table on Middle East and Africa - Market size and forecast 2023-2028 ($ million)
- Chart on Middle East and Africa - Year-over-year growth 2023-2028 (%)
- Data Table on Middle East and Africa - Year-over-year growth 2023-2028 (%)
- 9.7 South America - Market size and forecast 2023-2028
- Chart on South America - Market size and forecast 2023-2028 ($ million)
- Data Table on South America - Market size and forecast 2023-2028 ($ million)
- Chart on South America - Year-over-year growth 2023-2028 (%)
- Data Table on South America - Year-over-year growth 2023-2028 (%)
- 9.8 US - Market size and forecast 2023-2028
- Chart on US - Market size and forecast 2023-2028 ($ million)
- Data Table on US - Market size and forecast 2023-2028 ($ million)
- Chart on US - Year-over-year growth 2023-2028 (%)
- Data Table on US - Year-over-year growth 2023-2028 (%)
- 9.9 Germany - Market size and forecast 2023-2028
- Chart on Germany - Market size and forecast 2023-2028 ($ million)
- Data Table on Germany - Market size and forecast 2023-2028 ($ million)
- Chart on Germany - Year-over-year growth 2023-2028 (%)
- Data Table on Germany - Year-over-year growth 2023-2028 (%)
- 9.10 China - Market size and forecast 2023-2028
- Chart on China - Market size and forecast 2023-2028 ($ million)
- Data Table on China - Market size and forecast 2023-2028 ($ million)
- Chart on China - Year-over-year growth 2023-2028 (%)
- Data Table on China - Year-over-year growth 2023-2028 (%)
- 9.11 UK - Market size and forecast 2023-2028
- Chart on UK - Market size and forecast 2023-2028 ($ million)
- Data Table on UK - Market size and forecast 2023-2028 ($ million)
- Chart on UK - Year-over-year growth 2023-2028 (%)
- Data Table on UK - Year-over-year growth 2023-2028 (%)
- 9.12 Japan - Market size and forecast 2023-2028
- Chart on Japan - Market size and forecast 2023-2028 ($ million)
- Data Table on Japan - Market size and forecast 2023-2028 ($ million)
- Chart on Japan - Year-over-year growth 2023-2028 (%)
- Data Table on Japan - Year-over-year growth 2023-2028 (%)
- 9.13 Market opportunity by geography
- Market opportunity By Geographical Landscape($ million)
- Data Tables on Market opportunity By Geographical Landscape($ million)
10 Drivers, Challenges, and Opportunity/Restraints
- 10.1 Market drivers
- 10.2 Market challenges
- 10.3 Impact of drivers and challenges
- Impact of drivers and challenges in 2023 and 2028
- 10.4 Market opportunities/restraints
11 Competitive Landscape
- 11.1 Overview
- 11.2 Competitive Landscape
- Overview on criticality of inputs and factors of differentiation
- 11.3 Landscape disruption
- Overview on factors of disruption
- 11.4 Industry risks
- Impact of key risks on business
12 Competitive Analysis
- 12.1 Companies profiled
- Companies covered
- 12.2 Market positioning of companies
- Matrix on companies position and classification
- 12.3 BLUE FROG ROBOTICS SAS
- BLUE FROG ROBOTICS SAS - Overview
- BLUE FROG ROBOTICS SAS - Product / Service
- BLUE FROG ROBOTICS SAS - Key offerings
- 12.4 HANSON ROBOTICS Ltd.
- HANSON ROBOTICS Ltd. - Overview
- HANSON ROBOTICS Ltd. - Product / Service
- HANSON ROBOTICS Ltd. - Key offerings
- 12.5 Hasbro Inc.
- Hasbro Inc. - Overview
- Hasbro Inc. - Business segments
- Hasbro Inc. - Key offerings
- Hasbro Inc. - Segment focus
- 12.6 KUKA AG
- KUKA AG - Overview
- KUKA AG - Business segments
- KUKA AG - Key offerings
- KUKA AG - Segment focus
- 12.7 LEGO System AS
- LEGO System AS - Overview
- LEGO System AS - Product / Service
- LEGO System AS - Key news
- LEGO System AS - Key offerings
- 12.8 Mattel Inc.
- Mattel Inc. - Overview
- Mattel Inc. - Business segments
- Mattel Inc. - Key news
- Mattel Inc. - Key offerings
- Mattel Inc. - Segment focus
- 12.9 Neobotix GmbH
- Neobotix GmbH - Overview
- Neobotix GmbH - Product / Service
- Neobotix GmbH - Key offerings
- 12.10 PAL Robotics
- PAL Robotics - Overview
- PAL Robotics - Product / Service
- PAL Robotics - Key offerings
- 12.11 RN Chidakashi Technologies Inc.
- RN Chidakashi Technologies Inc. - Overview
- RN Chidakashi Technologies Inc. - Product / Service
- RN Chidakashi Technologies Inc. - Key offerings
- 12.12 ROBOTIS Co. Ltd
- ROBOTIS Co. Ltd - Overview
- ROBOTIS Co. Ltd - Product / Service
- ROBOTIS Co. Ltd - Key news
- ROBOTIS Co. Ltd - Key offerings
- 12.13 SoftBank Robotics Group Corp.
- SoftBank Robotics Group Corp. - Overview
- SoftBank Robotics Group Corp. - Product / Service
- SoftBank Robotics Group Corp. - Key offerings
- 12.14 Sony Group Corp.
- Sony Group Corp. - Overview
- Sony Group Corp. - Business segments
- Sony Group Corp. - Key news
- Sony Group Corp. - Key offerings
- Sony Group Corp. - Segment focus
- 12.15 Sphero Inc.
- Sphero Inc. - Overview
- Sphero Inc. - Product / Service
- Sphero Inc. - Key news
- Sphero Inc. - Key offerings
- 12.16 UBTECH Robotics Inc.
- UBTECH Robotics Inc. - Overview
- UBTECH Robotics Inc. - Product / Service
- UBTECH Robotics Inc. - Key news
- UBTECH Robotics Inc. - Key offerings
- 12.17 WowWee Group Ltd.
- WowWee Group Ltd. - Overview
- WowWee Group Ltd. - Product / Service
- WowWee Group Ltd. - Key offerings
13 Appendix
- 13.1 Scope of the report
- 13.2 Inclusions and exclusions checklist
- Inclusions checklist
- Exclusions checklist
- 13.3 Currency conversion rates for US$
- Currency conversion rates for US$
- 13.4 Research methodology
- Research methodology
- 13.5 Data procurement
- Information sources
- 13.6 Data validation
- Data validation
- 13.7 Validation techniques employed for market sizing
- Validation techniques employed for market sizing
- 13.8 Data synthesis
- Data synthesis
- 13.9 market analysis
- market analysis
- 13.10 List of abbreviations
- List of abbreviations

