|
|
市場調査レポート
商品コード
1660856
ウエハー製造装置(WFE)の世界市場(2025年~2029年)Global Wafer Fab Equipment (WFE) Market 2025-2029 |
||||||

|
|||||||
カスタマイズ可能
|
|||||||


| ウエハー製造装置(WFE)の世界市場(2025年~2029年) |
|
出版日: 2025年02月15日
発行: TechNavio
ページ情報: 英文 232 Pages
納期: 即納可能
|

全表示
- 概要
- 目次
ウエハー製造装置(WFE)市場は2024年~2029年に347億米ドル、予測期間中のCAGRは6.2%で成長すると予測されます。
当レポートでは、ウエハー製造装置(WFE)市場の全体的な分析、市場規模・予測、動向、成長促進要因、課題、約25のベンダーを網羅したベンダー分析などを掲載しています。
現在の市場シナリオ、最新動向と促進要因、市場環境全体に関する最新分析を提供しています。市場は、民生用電子機器の需要拡大、様々な産業における半導体チップの使用の増加、従来のシリコンベース技術から先端技術へのシフトによって牽引されています。
| 市場範囲 | |
|---|---|
| 基準年 | 2025年 |
| 終了年 | 2029年 |
| 予測期間 | 2025年~2029年 |
| 成長モメンタム | 加速 |
| 前年比2025年 | 5.8% |
| CAGR | 6.2% |
| 増分額 | 347億米ドル |
本調査は、業界の主要参加者からのインプットを含め、一次情報と二次情報を客観的に組み合わせて実施しました。本レポートには、主要企業の分析に加え、包括的な市場規模データ、地域分析によるセグメント、ベンダー情勢が含まれています。レポートには過去データと予測データがあります。
本調査では、半導体産業における技術の進歩が、今後数年間のウエハー製造装置(WFE)市場の成長を促進する主要な理由の1つであると特定しています。また、先進パッケージング技術への需要の高まり、エネルギー効率の高いデバイスやグリーンエネルギーソリューションへの注目の高まりは、市場の大きな需要につながります。
目次
第1章 エグゼクティブサマリー
- 市場概要
第2章 Technavioによる分析
- 価格・ライフサイクル・顧客購入バスケット・採用率・購入基準の分析
- インプットの重要性と差別化の要因
- 混乱の要因
- 促進要因と課題の影響
第3章 市場情勢
- 市場エコシステム
- 市場の特徴
- バリューチェーン分析
第4章 市場規模
- 市場の定義
- 市場セグメント分析
- 市場規模(2024年)
- 市場の見通し(2024年~2029年)
第5章 市場規模実績
- ウエハー製造装置(WFE)の世界市場(2019年~2023年)
- 技術セグメント分析(2019年~2023年)
- エンドユーザーセグメント分析(2019年~2023年)
- 容量セグメント分析(2019年~2023年)
- 製品仕様セグメント分析(2019年~2023年)
- 地域別セグメント分析(2019年~2023年)
- 国別セグメント分析(2019年~2023年)
第6章 定性分析
- AIの影響:ウエハー製造装置(WFE)の世界市場
第7章 ファイブフォース分析
- ファイブフォースの要約
- 買い手の交渉力
- 供給企業の交渉力
- 新規参入業者の脅威
- 代替品の脅威
- 競争の脅威
- 市況
第8章 市場セグメンテーション:技術別
- 市場セグメント
- 比較:技術別
- ALDA:市場規模と予測(2024年~2029年)
- CVD:市場規模と予測(2024年~2029年)
- エッチング:市場規模と予測(2024年~2029年)
- 酸化:市場規模と予測(2024年~2029年)
- その他:市場規模と予測(2024年~2029年)
- 市場機会:技術別
第9章 市場セグメンテーション:エンドユーザー別
- 市場セグメント
- 比較:エンドユーザー別
- 鋳造所:市場規模と予測(2024年~2029年)
- メモリ:市場規模と予測(2024年~2029年)
- 統合デバイスメーカー:市場規模と予測(2024年~2029年)
- 市場機会:エンドユーザー別
第10章 市場セグメンテーション:容量別
- 市場セグメント
- 比較:容量別
- 市場機会:容量別
第11章 市場セグメンテーション:製品仕様別
- 市場セグメント
- 比較:製品仕様別
- ノードサイズ 14nm~28nm:市場規模と予測(2024年~2029年)
- ノードサイズ 7nm~14nm:市場規模と予測(2024年~2029年)
- ノードサイズ 28nm以上:市場規模と予測(2024年~2029年)
- ノードサイズ 5nm~7nm:市場規模と予測(2024年~2029年)
- ノードサイズ 5nm未満:市場規模と予測(2024年~2029年)
- 市場機会:製品仕様別
第12章 顧客情勢
- 顧客情勢の概要
第13章 地域別情勢
- 地域別セグメンテーション
- 地域別比較
- アジア太平洋:市場規模と予測(2024年~2029年)
- 北米:市場規模と予測(2024年~2029年)
- 欧州:市場規模と予測(2024年~2029年)
- 中東・アフリカ:市場規模と予測(2024年~2029年)
- 南米:市場規模と予測(2024年~2029年)
- 中国:市場規模と予測(2024年~2029年)
- 日本:市場規模と予測(2024年~2029年)
- 韓国:市場規模と予測(2024年~2029年)
- 米国:市場規模と予測(2024年~2029年)
- 台湾:市場規模と予測(2024年~2029年)
- インド:市場規模と予測(2024年~2029年)
- カナダ:市場規模と予測(2024年~2029年)
- ドイツ:市場規模と予測(2024年~2029年)
- フランス:市場規模と予測(2024年~2029年)
- 英国:市場規模と予測(2024年~2029年)
- 市場機会:地域情勢別
第14章 促進要因・課題・機会・抑制要因
- 市場促進要因
- 市場の課題
- 促進要因と課題の影響
- 市場の機会・抑制要因
第15章 競合情勢
- 概要
- 競合情勢
- 混乱の状況
- 業界のリスク
第16章 競合分析
- 企業プロファイル
- 企業ランキング指数
- 企業の市場ポジショニング
- AIXTRON SE
- Applied Materials Inc.
- ASM International NV
- ASML
- ASMPT Ltd.
- Baxter International Inc.
- EV Group
- Hitachi Ltd.
- KLA Corp.
- Lam Research Corp.
- Nikon Corp.
- Screen Holdings Co. Ltd
- Taiwan Semiconductor Manufacturing Co. Ltd.
- Teradyne Inc.
- Tokyo Electron Ltd.
第17章 付録
The wafer fab equipment (WFE) market is forecasted to grow by USD 34.7 billion during 2024-2029, accelerating at a CAGR of 6.2% during the forecast period. The report on the wafer fab equipment (WFE) market provides a holistic analysis, market size and forecast, trends, growth drivers, and challenges, as well as vendor analysis covering around 25 vendors.
The report offers an up-to-date analysis regarding the current market scenario, the latest trends and drivers, and the overall market environment. The market is driven by growing demand for consumer electronics, increasing use of semiconductor chips in various industries, and shift from traditional silicon-based technologies to advanced technologies.
| Market Scope | |
|---|---|
| Base Year | 2025 |
| End Year | 2029 |
| Series Year | 2025-2029 |
| Growth Momentum | Accelerate |
| YOY 2025 | 5.8% |
| CAGR | 6.2% |
| Incremental Value | $34.7 bn |
The study was conducted using an objective combination of primary and secondary information including inputs from key participants in the industry. The report contains a comprehensive market size data, segment with regional analysis and vendor landscape in addition to an analysis of the key companies. Reports have historic and forecast data.
Technavio's wafer fab equipment (WFE) market is segmented as below:
By Technology
- Automatic layer deposition
- Chemical vapor diposition
- Etching
- Oxidation
- Others
By End-user
- Foundry
- Memory
- Integrated device manufacturer
By Capacity
- 300 mm wafer size
- 200 mm wafer size
- 150 mm wafer size
By Product Specification
- Node size between 14nm and 28nm
- Node size between 7nm and 14nm
- Node size more than 28nm
- Node size between 5nm and 7nm
- Node size below 5nm
By Geographical Landscape
- APAC
- North America
- Europe
- Middle East and Africa
- South America
This study identifies the technological advancements in semiconductor industry as one of the prime reasons driving the wafer fab equipment (WFE) market growth during the next few years. Also, growing demand for advanced packaging technologies and increasing focus on energy-efficient devices and green energy solutions will lead to sizable demand in the market.
The report on the wafer fab equipment (WFE) market covers the following areas:
- Wafer Fab Equipment (WFE) Market sizing
- Wafer Fab Equipment (WFE) Market forecast
- Wafer Fab Equipment (WFE) Market industry analysis
The robust vendor analysis is designed to help clients improve their market position, and in line with this, this report provides a detailed analysis of several leading wafer fab equipment (WFE) market vendors that include AIXTRON SE, Applied Materials Inc., ASM International NV, ASML, ASMPT Ltd., Baxter International Inc., EV Group, FormFactor Inc., Hanmi Semiconductor Co. Ltd., Hitachi Ltd., HORIBA Ltd., KLA Corp., KOKUSAI ELECTRIC CORP, Lam Research Corp., Nikon Corp., PLASMA THERM, Screen Holdings Co. Ltd, Taiwan Semiconductor Manufacturing Co. Ltd., Teradyne Inc., and Tokyo Electron Ltd.. Also, the wafer fab equipment (WFE) market analysis report includes information on upcoming trends and challenges that will influence market growth. This is to help companies strategize and leverage all forthcoming growth opportunities.
The publisher presents a detailed picture of the market by the way of study, synthesis, and summation of data from multiple sources by an analysis of key parameters such as profit, pricing, competition, and promotions. It presents various market facets by identifying the key industry influencers. The data presented is comprehensive, reliable, and a result of extensive primary and secondary research. The market research reports provide a complete competitive landscape and an in-depth vendor selection methodology and analysis using qualitative and quantitative research to forecast accurate market growth.
Table of Contents
1 Executive Summary
- 1.1 Market overview
- Executive Summary - Chart on Market Overview
- Executive Summary - Data Table on Market Overview
- Executive Summary - Chart on Global Market Characteristics
- Executive Summary - Chart on Market By Geographical Landscape
- Executive Summary - Chart on Market Segmentation by Technology
- Executive Summary - Chart on Market Segmentation by End-user
- Executive Summary - Chart on Market Segmentation by Capacity
- Executive Summary - Chart on Market Segmentation by Product Specification
- Executive Summary - Chart on Incremental Growth
- Executive Summary - Data Table on Incremental Growth
- Executive Summary - Chart on Company Market Positioning
2 Technavio Analysis
- 2.1 Analysis of price sensitivity, lifecycle, customer purchase basket, adoption rates, and purchase criteria
- Analysis of price sensitivity, lifecycle, customer purchase basket, adoption rates, and purchase criteria
- 2.2 Criticality of inputs and Factors of differentiation
- Overview on criticality of inputs and factors of differentiation
- 2.3 Factors of disruption
- Overview on factors of disruption
- 2.4 Impact of drivers and challenges
- Impact of drivers and challenges in 2024 and 2029
3 Market Landscape
- 3.1 Market ecosystem
- Parent Market
- Data Table on - Parent Market
- 3.2 Market characteristics
- Market characteristics analysis
- 3.3 Value chain analysis
- Value chain analysis
4 Market Sizing
- 4.1 Market definition
- Offerings of companies included in the market definition
- 4.2 Market segment analysis
- Market segments
- 4.3 Market size 2024
- 4.4 Market outlook: Forecast for 2024-2029
- Chart on Global - Market size and forecast 2024-2029 ($ billion)
- Data Table on Global - Market size and forecast 2024-2029 ($ billion)
- Chart on Global Market: Year-over-year growth 2024-2029 (%)
- Data Table on Global Market: Year-over-year growth 2024-2029 (%)
5 Historic Market Size
- 5.1 Global Wafer Fab Equipment (WFE) Market 2019 - 2023
- Historic Market Size - Data Table on Global Wafer Fab Equipment (WFE) Market 2019 - 2023 ($ billion)
- 5.2 Technology segment analysis 2019 - 2023
- Historic Market Size - Technology Segment 2019 - 2023 ($ billion)
- 5.3 End-user segment analysis 2019 - 2023
- Historic Market Size - End-user Segment 2019 - 2023 ($ billion)
- 5.4 Capacity segment analysis 2019 - 2023
- Historic Market Size - Capacity Segment 2019 - 2023 ($ billion)
- 5.5 Product Specification segment analysis 2019 - 2023
- Historic Market Size - Product Specification Segment 2019 - 2023 ($ billion)
- 5.6 Geography segment analysis 2019 - 2023
- Historic Market Size - Geography Segment 2019 - 2023 ($ billion)
- 5.7 Country segment analysis 2019 - 2023
- Historic Market Size - Country Segment 2019 - 2023 ($ billion)
6 Qualitative Analysis
- 6.1 Impact of AI on Global Wafer Fab Equipment (WFE) Market
7 Five Forces Analysis
- 7.1 Five forces summary
- Five forces analysis - Comparison between 2024 and 2029
- 7.2 Bargaining power of buyers
- Bargaining power of buyers - Impact of key factors 2024 and 2029
- 7.3 Bargaining power of suppliers
- Bargaining power of suppliers - Impact of key factors in 2024 and 2029
- 7.4 Threat of new entrants
- Threat of new entrants - Impact of key factors in 2024 and 2029
- 7.5 Threat of substitutes
- Threat of substitutes - Impact of key factors in 2024 and 2029
- 7.6 Threat of rivalry
- Threat of rivalry - Impact of key factors in 2024 and 2029
- 7.7 Market condition
- Chart on Market condition - Five forces 2024 and 2029
8 Market Segmentation by Technology
- 8.1 Market segments
- Chart on Technology - Market share 2024-2029 (%)
- Data Table on Technology - Market share 2024-2029 (%)
- 8.2 Comparison by Technology
- Chart on Comparison by Technology
- Data Table on Comparison by Technology
- 8.3 ALD - Market size and forecast 2024-2029
- Chart on ALD - Market size and forecast 2024-2029 ($ billion)
- Data Table on ALD - Market size and forecast 2024-2029 ($ billion)
- Chart on ALD - Year-over-year growth 2024-2029 (%)
- Data Table on ALD - Year-over-year growth 2024-2029 (%)
- 8.4 CVD - Market size and forecast 2024-2029
- Chart on CVD - Market size and forecast 2024-2029 ($ billion)
- Data Table on CVD - Market size and forecast 2024-2029 ($ billion)
- Chart on CVD - Year-over-year growth 2024-2029 (%)
- Data Table on CVD - Year-over-year growth 2024-2029 (%)
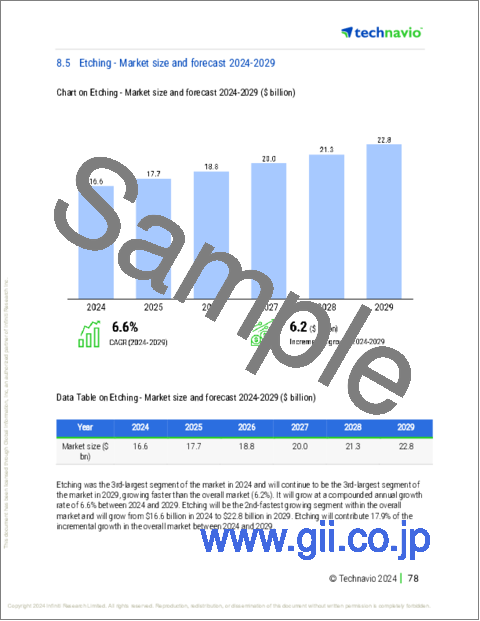
- 8.5 Etching - Market size and forecast 2024-2029
- Chart on Etching - Market size and forecast 2024-2029 ($ billion)
- Data Table on Etching - Market size and forecast 2024-2029 ($ billion)
- Chart on Etching - Year-over-year growth 2024-2029 (%)
- Data Table on Etching - Year-over-year growth 2024-2029 (%)
- 8.6 Oxidation - Market size and forecast 2024-2029
- Chart on Oxidation - Market size and forecast 2024-2029 ($ billion)
- Data Table on Oxidation - Market size and forecast 2024-2029 ($ billion)
- Chart on Oxidation - Year-over-year growth 2024-2029 (%)
- Data Table on Oxidation - Year-over-year growth 2024-2029 (%)
- 8.7 Others - Market size and forecast 2024-2029
- Chart on Others - Market size and forecast 2024-2029 ($ billion)
- Data Table on Others - Market size and forecast 2024-2029 ($ billion)
- Chart on Others - Year-over-year growth 2024-2029 (%)
- Data Table on Others - Year-over-year growth 2024-2029 (%)
- 8.8 Market opportunity by Technology
- Market opportunity by Technology ($ billion)
- Data Table on Market opportunity by Technology ($ billion)
9 Market Segmentation by End-user
- 9.1 Market segments
- Chart on End-user - Market share 2024-2029 (%)
- Data Table on End-user - Market share 2024-2029 (%)
- 9.2 Comparison by End-user
- Chart on Comparison by End-user
- Data Table on Comparison by End-user
- 9.3 Foundry - Market size and forecast 2024-2029
- Chart on Foundry - Market size and forecast 2024-2029 ($ billion)
- Data Table on Foundry - Market size and forecast 2024-2029 ($ billion)
- Chart on Foundry - Year-over-year growth 2024-2029 (%)
- Data Table on Foundry - Year-over-year growth 2024-2029 (%)
- 9.4 Memory - Market size and forecast 2024-2029
- Chart on Memory - Market size and forecast 2024-2029 ($ billion)
- Data Table on Memory - Market size and forecast 2024-2029 ($ billion)
- Chart on Memory - Year-over-year growth 2024-2029 (%)
- Data Table on Memory - Year-over-year growth 2024-2029 (%)
- 9.5 Integrated device manufacturer - Market size and forecast 2024-2029
- Chart on Integrated device manufacturer - Market size and forecast 2024-2029 ($ billion)
- Data Table on Integrated device manufacturer - Market size and forecast 2024-2029 ($ billion)
- Chart on Integrated device manufacturer - Year-over-year growth 2024-2029 (%)
- Data Table on Integrated device manufacturer - Year-over-year growth 2024-2029 (%)
- 9.6 Market opportunity by End-user
- Market opportunity by End-user ($ billion)
- Data Table on Market opportunity by End-user ($ billion)
10 Market Segmentation by Capacity
- 10.1 Market segments
- Chart on Capacity - Market share 2024-2029 (%)
- Data Table on Capacity - Market share 2024-2029 (%)
- 10.2 Comparison by Capacity
- Chart on Comparison by Capacity
- Data Table on Comparison by Capacity
- 300 mm wafer size - Market size and forecast 2024-2029
- Chart on 300 mm wafer size - Market size and forecast 2024-2029 ($ billion)
- Data Table on 300 mm wafer size - Market size and forecast 2024-2029 ($ billion)
- Chart on 300 mm wafer size - Year-over-year growth 2024-2029 (%)
- Data Table on 300 mm wafer size - Year-over-year growth 2024-2029 (%)
- 200 mm wafer size - Market size and forecast 2024-2029
- Chart on 200 mm wafer size - Market size and forecast 2024-2029 ($ billion)
- Data Table on 200 mm wafer size - Market size and forecast 2024-2029 ($ billion)
- Chart on 200 mm wafer size - Year-over-year growth 2024-2029 (%)
- Data Table on 200 mm wafer size - Year-over-year growth 2024-2029 (%)
- 150 mm wafer size - Market size and forecast 2024-2029
- Chart on 150 mm wafer size - Market size and forecast 2024-2029 ($ billion)
- Data Table on 150 mm wafer size - Market size and forecast 2024-2029 ($ billion)
- Chart on 150 mm wafer size - Year-over-year growth 2024-2029 (%)
- Data Table on 150 mm wafer size - Year-over-year growth 2024-2029 (%)
- 10.6 Market opportunity by Capacity
- Market opportunity by Capacity ($ billion)
- Data Table on Market opportunity by Capacity ($ billion)
11 Market Segmentation by Product Specification
- 11.1 Market segments
- Chart on Product Specification - Market share 2024-2029 (%)
- Data Table on Product Specification - Market share 2024-2029 (%)
- 11.2 Comparison by Product Specification
- Chart on Comparison by Product Specification
- Data Table on Comparison by Product Specification
- 11.3 Node size between 14nm and 28nm - Market size and forecast 2024-2029
- Chart on Node size between 14nm and 28nm - Market size and forecast 2024-2029 ($ billion)
- Data Table on Node size between 14nm and 28nm - Market size and forecast 2024-2029 ($ billion)
- Chart on Node size between 14nm and 28nm - Year-over-year growth 2024-2029 (%)
- Data Table on Node size between 14nm and 28nm - Year-over-year growth 2024-2029 (%)
- 11.4 Node size between 7nm and 14nm - Market size and forecast 2024-2029
- Chart on Node size between 7nm and 14nm - Market size and forecast 2024-2029 ($ billion)
- Data Table on Node size between 7nm and 14nm - Market size and forecast 2024-2029 ($ billion)
- Chart on Node size between 7nm and 14nm - Year-over-year growth 2024-2029 (%)
- Data Table on Node size between 7nm and 14nm - Year-over-year growth 2024-2029 (%)
- 11.5 Node size more than 28nm - Market size and forecast 2024-2029
- Chart on Node size more than 28nm - Market size and forecast 2024-2029 ($ billion)
- Data Table on Node size more than 28nm - Market size and forecast 2024-2029 ($ billion)
- Chart on Node size more than 28nm - Year-over-year growth 2024-2029 (%)
- Data Table on Node size more than 28nm - Year-over-year growth 2024-2029 (%)
- 11.6 Node size between 5nm and 7nm - Market size and forecast 2024-2029
- Chart on Node size between 5nm and 7nm - Market size and forecast 2024-2029 ($ billion)
- Data Table on Node size between 5nm and 7nm - Market size and forecast 2024-2029 ($ billion)
- Chart on Node size between 5nm and 7nm - Year-over-year growth 2024-2029 (%)
- Data Table on Node size between 5nm and 7nm - Year-over-year growth 2024-2029 (%)
- 11.7 Node size below 5nm - Market size and forecast 2024-2029
- Chart on Node size below 5nm - Market size and forecast 2024-2029 ($ billion)
- Data Table on Node size below 5nm - Market size and forecast 2024-2029 ($ billion)
- Chart on Node size below 5nm - Year-over-year growth 2024-2029 (%)
- Data Table on Node size below 5nm - Year-over-year growth 2024-2029 (%)
- 11.8 Market opportunity by Product Specification
- Market opportunity by Product Specification ($ billion)
- Data Table on Market opportunity by Product Specification ($ billion)
12 Customer Landscape
- 12.1 Customer landscape overview
- Analysis of price sensitivity, lifecycle, customer purchase basket, adoption rates, and purchase criteria
13 Geographic Landscape
- 13.1 Geographic segmentation
- Chart on Market share By Geographical Landscape 2024-2029 (%)
- Data Table on Market share By Geographical Landscape 2024-2029 (%)
- 13.2 Geographic comparison
- Chart on Geographic comparison
- Data Table on Geographic comparison
- 13.3 APAC - Market size and forecast 2024-2029
- Chart on APAC - Market size and forecast 2024-2029 ($ billion)
- Data Table on APAC - Market size and forecast 2024-2029 ($ billion)
- Chart on APAC - Year-over-year growth 2024-2029 (%)
- Data Table on APAC - Year-over-year growth 2024-2029 (%)
- 13.4 North America - Market size and forecast 2024-2029
- Chart on North America - Market size and forecast 2024-2029 ($ billion)
- Data Table on North America - Market size and forecast 2024-2029 ($ billion)
- Chart on North America - Year-over-year growth 2024-2029 (%)
- Data Table on North America - Year-over-year growth 2024-2029 (%)
- 13.5 Europe - Market size and forecast 2024-2029
- Chart on Europe - Market size and forecast 2024-2029 ($ billion)
- Data Table on Europe - Market size and forecast 2024-2029 ($ billion)
- Chart on Europe - Year-over-year growth 2024-2029 (%)
- Data Table on Europe - Year-over-year growth 2024-2029 (%)
- 13.6 Middle East and Africa - Market size and forecast 2024-2029
- Chart on Middle East and Africa - Market size and forecast 2024-2029 ($ billion)
- Data Table on Middle East and Africa - Market size and forecast 2024-2029 ($ billion)
- Chart on Middle East and Africa - Year-over-year growth 2024-2029 (%)
- Data Table on Middle East and Africa - Year-over-year growth 2024-2029 (%)
- 13.7 South America - Market size and forecast 2024-2029
- Chart on South America - Market size and forecast 2024-2029 ($ billion)
- Data Table on South America - Market size and forecast 2024-2029 ($ billion)
- Chart on South America - Year-over-year growth 2024-2029 (%)
- Data Table on South America - Year-over-year growth 2024-2029 (%)
- 13.8 China - Market size and forecast 2024-2029
- Chart on China - Market size and forecast 2024-2029 ($ billion)
- Data Table on China - Market size and forecast 2024-2029 ($ billion)
- Chart on China - Year-over-year growth 2024-2029 (%)
- Data Table on China - Year-over-year growth 2024-2029 (%)
- 13.9 Japan - Market size and forecast 2024-2029
- Chart on Japan - Market size and forecast 2024-2029 ($ billion)
- Data Table on Japan - Market size and forecast 2024-2029 ($ billion)
- Chart on Japan - Year-over-year growth 2024-2029 (%)
- Data Table on Japan - Year-over-year growth 2024-2029 (%)
- 13.10 South Korea - Market size and forecast 2024-2029
- Chart on South Korea - Market size and forecast 2024-2029 ($ billion)
- Data Table on South Korea - Market size and forecast 2024-2029 ($ billion)
- Chart on South Korea - Year-over-year growth 2024-2029 (%)
- Data Table on South Korea - Year-over-year growth 2024-2029 (%)
- 13.11 US - Market size and forecast 2024-2029
- Chart on US - Market size and forecast 2024-2029 ($ billion)
- Data Table on US - Market size and forecast 2024-2029 ($ billion)
- Chart on US - Year-over-year growth 2024-2029 (%)
- Data Table on US - Year-over-year growth 2024-2029 (%)
- 13.12 Taiwan - Market size and forecast 2024-2029
- Chart on Taiwan - Market size and forecast 2024-2029 ($ billion)
- Data Table on Taiwan - Market size and forecast 2024-2029 ($ billion)
- Chart on Taiwan - Year-over-year growth 2024-2029 (%)
- Data Table on Taiwan - Year-over-year growth 2024-2029 (%)
- 13.13 India - Market size and forecast 2024-2029
- Chart on India - Market size and forecast 2024-2029 ($ billion)
- Data Table on India - Market size and forecast 2024-2029 ($ billion)
- Chart on India - Year-over-year growth 2024-2029 (%)
- Data Table on India - Year-over-year growth 2024-2029 (%)
- 13.14 Canada - Market size and forecast 2024-2029
- Chart on Canada - Market size and forecast 2024-2029 ($ billion)
- Data Table on Canada - Market size and forecast 2024-2029 ($ billion)
- Chart on Canada - Year-over-year growth 2024-2029 (%)
- Data Table on Canada - Year-over-year growth 2024-2029 (%)
- 13.15 Germany - Market size and forecast 2024-2029
- Chart on Germany - Market size and forecast 2024-2029 ($ billion)
- Data Table on Germany - Market size and forecast 2024-2029 ($ billion)
- Chart on Germany - Year-over-year growth 2024-2029 (%)
- Data Table on Germany - Year-over-year growth 2024-2029 (%)
- 13.16 France - Market size and forecast 2024-2029
- Chart on France - Market size and forecast 2024-2029 ($ billion)
- Data Table on France - Market size and forecast 2024-2029 ($ billion)
- Chart on France - Year-over-year growth 2024-2029 (%)
- Data Table on France - Year-over-year growth 2024-2029 (%)
- 13.17 UK - Market size and forecast 2024-2029
- Chart on UK - Market size and forecast 2024-2029 ($ billion)
- Data Table on UK - Market size and forecast 2024-2029 ($ billion)
- Chart on UK - Year-over-year growth 2024-2029 (%)
- Data Table on UK - Year-over-year growth 2024-2029 (%)
- 13.18 Market opportunity By Geographical Landscape
- Market opportunity By Geographical Landscape ($ billion)
- Data Tables on Market opportunity By Geographical Landscape ($ billion)
14 Drivers, Challenges, and Opportunity/Restraints
- 14.1 Market drivers
- 14.2 Market challenges
- 14.3 Impact of drivers and challenges
- Impact of drivers and challenges in 2024 and 2029
- 14.4 Market opportunities/restraints
15 Competitive Landscape
- 15.1 Overview
- 15.2 Competitive Landscape
- Overview on criticality of inputs and factors of differentiation
- 15.3 Landscape disruption
- Overview on factors of disruption
- 15.4 Industry risks
- Impact of key risks on business
16 Competitive Analysis
- 16.1 Companies profiled
- Companies covered
- 16.2 Company ranking index
- Company ranking index
- 16.3 Market positioning of companies
- Matrix on companies position and classification
- 16.4 AIXTRON SE
- AIXTRON SE - Overview
- AIXTRON SE - Product / Service
- AIXTRON SE - Key news
- AIXTRON SE - Key offerings
- SWOT
- 16.5 Applied Materials Inc.
- Applied Materials Inc. - Overview
- Applied Materials Inc. - Business segments
- Applied Materials Inc. - Key offerings
- Applied Materials Inc. - Segment focus
- SWOT
- 16.6 ASM International NV
- ASM International NV - Overview
- ASM International NV - Product / Service
- ASM International NV - Key offerings
- SWOT
- 16.7 ASML
- ASML - Overview
- ASML - Product / Service
- ASML - Key offerings
- SWOT
- 16.8 ASMPT Ltd.
- ASMPT Ltd. - Overview
- ASMPT Ltd. - Business segments
- ASMPT Ltd. - Key offerings
- ASMPT Ltd. - Segment focus
- SWOT
- 16.9 Baxter International Inc.
- Baxter International Inc. - Overview
- Baxter International Inc. - Business segments
- Baxter International Inc. - Key news
- Baxter International Inc. - Key offerings
- Baxter International Inc. - Segment focus
- SWOT
- 16.10 EV Group
- EV Group - Overview
- EV Group - Product / Service
- EV Group - Key offerings
- SWOT
- 16.11 Hitachi Ltd.
- Hitachi Ltd. - Overview
- Hitachi Ltd. - Business segments
- Hitachi Ltd. - Key news
- Hitachi Ltd. - Key offerings
- Hitachi Ltd. - Segment focus
- SWOT
- 16.12 KLA Corp.
- KLA Corp. - Overview
- KLA Corp. - Business segments
- KLA Corp. - Key offerings
- KLA Corp. - Segment focus
- SWOT
- 16.13 Lam Research Corp.
- Lam Research Corp. - Overview
- Lam Research Corp. - Product / Service
- Lam Research Corp. - Key offerings
- SWOT
- 16.14 Nikon Corp.
- Nikon Corp. - Overview
- Nikon Corp. - Business segments
- Nikon Corp. - Key offerings
- Nikon Corp. - Segment focus
- SWOT
- 16.15 Screen Holdings Co. Ltd
- Screen Holdings Co. Ltd - Overview
- Screen Holdings Co. Ltd - Business segments
- Screen Holdings Co. Ltd - Key offerings
- Screen Holdings Co. Ltd - Segment focus
- SWOT
- 16.16 Taiwan Semiconductor Manufacturing Co. Ltd.
- Taiwan Semiconductor Manufacturing Co. Ltd. - Overview
- Taiwan Semiconductor Manufacturing Co. Ltd. - Product / Service
- Taiwan Semiconductor Manufacturing Co. Ltd. - Key news
- Taiwan Semiconductor Manufacturing Co. Ltd. - Key offerings
- SWOT
- 16.17 Teradyne Inc.
- Teradyne Inc. - Overview
- Teradyne Inc. - Business segments
- Teradyne Inc. - Key news
- Teradyne Inc. - Key offerings
- Teradyne Inc. - Segment focus
- SWOT
- 16.18 Tokyo Electron Ltd.
- Tokyo Electron Ltd. - Overview
- Tokyo Electron Ltd. - Business segments
- Tokyo Electron Ltd. - Key offerings
- Tokyo Electron Ltd. - Segment focus
- SWOT
17 Appendix
- 17.1 Scope of the report
- 17.2 Inclusions and exclusions checklist
- Inclusions checklist
- Exclusions checklist
- 17.3 Currency conversion rates for US$
- Currency conversion rates for US$
- 17.4 Research methodology
- Research methodology
- 17.5 Data procurement
- Information sources
- 17.6 Data validation
- Data validation
- 17.7 Validation techniques employed for market sizing
- Validation techniques employed for market sizing
- 17.8 Data synthesis
- Data synthesis
- 17.9 360 degree market analysis
- 360 degree market analysis
- 17.10 List of abbreviations
- List of abbreviations

