|
|
市場調査レポート
商品コード
1583668
空港用スタンド機器の世界市場、2024~2028年Global Airport Stands Equipment Market 2024-2028 |
||||||
|
|||||||
カスタマイズ可能
|
|||||||

| 空港用スタンド機器の世界市場、2024~2028年 |
|
出版日: 2024年08月19日
発行: TechNavio
ページ情報: 英文 159 Pages
納期: 即納可能
|

全表示
- 概要
- 図表
- 目次
空港用スタンド機器市場は2023~2028年に16億3,350万米ドル、予測期間中のCAGRは6.78%で成長すると予測されます。
当レポートでは、空港用スタンド機器市場の全体的な分析、市場規模・予測、動向、成長促進要因、課題、約25のベンダーを網羅したベンダー分析などを掲載しています。
現在の市場シナリオ、最新動向と促進要因、市場環境全体に関する最新分析を提供しています。世界の貨物輸送量と旅客輸送量の増加、空港用スタンド機器の技術進歩、スマート空港への嗜好の高まりが市場を牽引しています。
| 市場範囲 | |
|---|---|
| 基準年 | 2024年 |
| 終了年 | 2028年 |
| 予測期間 | 2024~2028年 |
| 成長モメンタム | 加速 |
| 前年比[2024年] | 6.23% |
| CAGR | 6.78% |
| 増分額 | 16億3,350万米ドル |
本調査では、今後数年間の空港用スタンド機器市場成長を牽引する主要要因の1つとして、空港の建設とアップグレードの増加を挙げています。また、ローコストオペレーターの経費増加や、航空関連以外の収入への注目度が高まることで、市場の需要は大きくなると考えられます。
目次
第1章 エグゼクティブサマリー
- 市場概要
第2章 市場情勢
- 市場エコシステム
- 市場の特徴
- バリューチェーン分析
第3章 市場規模の評価
- 市場の定義
- 市場セグメント分析
- 市場規模 2023年
- 市場展望 2023~2028年
第4章 市場規模実績
- 空港用スタンド機器の世界市場 2018~2022年
- タイプ別セグメント分析 2018~2022年
- 用途別セグメント分析 2018~2022年
- 地域別セグメント分析 2018~2022年
- 国別セグメント分析 2018~2022年
第5章 ファイブフォース分析
- ファイブフォースの要約
- 買い手の交渉力
- 供給企業の交渉力
- 新規参入業者の脅威
- 代替品の脅威
- 競争の脅威
- 市況
第6章 タイプ別市場セグメンテーション
- 市場セグメンテーション
- 比較:タイプ別
- ボーディングブリッジ:市場規模と予測 2023~2028年
- プレコンディショニングエアユニット:市場規模と予測 2023~2028年
- スタンド入場誘導システム:市場規模と予測 2023~2028年
- 地上電力ユニット:市場規模と予測 2023~2028年
- タイプ別の市場機会
第7章 用途別市場セグメンテーション
- 市場セグメンテーション
- 比較:用途別
- 航空機の運航:市場規模と予測 2023~2028年
- MRO:市場規模と予測 2023~2028年
- 用途別の市場機会
第8章 顧客情勢
- 顧客情勢概要
第9章 地域別情勢
- 地域別セグメンテーション
- 比較:地域別
- 北米:市場規模と予測 2023~2028年
- アジア太平洋:市場規模と予測 2023~2028年
- 欧州:市場規模と予測 2023~2028年
- 南米:市場規模と予測 2023~2028年
- 中東・アフリカ:市場規模と予測 2023~2028年
- 米国:市場規模と予測 2023~2028年
- 中国:市場規模と予測 2023~2028年
- ドイツ:市場規模と予測 2023~2028年
- カナダ:市場規模と予測 2023~2028年
- 英国:市場規模と予測 2023~2028年
- 地域情勢別の市場機会
第10章 促進要因・課題・機会・抑制要因
- 市場促進要因
- 市場課題
- 促進要因と課題の影響
- 市場機会・抑制要因
第11章 競合情勢
- 概要
- 競合情勢
- 混乱の状況
- 業界のリスク
第12章 競合分析
- 企業プロファイル
- 企業の市場ポジショニング
- ADB Safegate BV
- ADELTE Group SL
- AERO Specialties Inc.
- Cavotec SA
- Dedienne Aerospace
- DENGE
- FMT Aircraft Gate Support Systems AB
- HHI Corp.
- John Bean Technologies Corp.
- Mallaghan GA Inc.
- Omega Aviation Services Inc.
- ShinMaywa Industries Ltd.
- Textron Inc.
- thyssenkrupp AG
- TREPEL Airport Equipment GmbH
第13章 付録
Exhibits:
- Exhibits1: Executive Summary - Chart on Market Overview
- Exhibits2: Executive Summary - Data Table on Market Overview
- Exhibits3: Executive Summary - Chart on Global Market Characteristics
- Exhibits4: Executive Summary - Chart on Market By Geographical Landscape
- Exhibits5: Executive Summary - Chart on Market Segmentation by Type
- Exhibits6: Executive Summary - Chart on Market Segmentation by Application
- Exhibits7: Executive Summary - Chart on Incremental Growth
- Exhibits8: Executive Summary - Data Table on Incremental Growth
- Exhibits9: Executive Summary - Chart on Company Market Positioning
- Exhibits10: Parent Market
- Exhibits11: Data Table on - Parent Market
- Exhibits12: Market characteristics analysis
- Exhibits13: Value Chain Analysis
- Exhibits14: Offerings of companies included in the market definition
- Exhibits15: Market segments
- Exhibits16: Chart on Global - Market size and forecast 2023-2028 ($ million)
- Exhibits17: Data Table on Global - Market size and forecast 2023-2028 ($ million)
- Exhibits18: Chart on Global Market: Year-over-year growth 2023-2028 (%)
- Exhibits19: Data Table on Global Market: Year-over-year growth 2023-2028 (%)
- Exhibits20: Historic Market Size - Data Table on Global Airport Stands Equipment Market 2018 - 2022 ($ million)
- Exhibits21: Historic Market Size - Type Segment 2018 - 2022 ($ million)
- Exhibits22: Historic Market Size - Application Segment 2018 - 2022 ($ million)
- Exhibits23: Historic Market Size - Geography Segment 2018 - 2022 ($ million)
- Exhibits24: Historic Market Size - Country Segment 2018 - 2022 ($ million)
- Exhibits25: Five forces analysis - Comparison between 2023 and 2028
- Exhibits26: Bargaining power of buyers - Impact of key factors 2023 and 2028
- Exhibits27: Bargaining power of suppliers - Impact of key factors in 2023 and 2028
- Exhibits28: Threat of new entrants - Impact of key factors in 2023 and 2028
- Exhibits29: Threat of substitutes - Impact of key factors in 2023 and 2028
- Exhibits30: Threat of rivalry - Impact of key factors in 2023 and 2028
- Exhibits31: Chart on Market condition - Five forces 2023 and 2028
- Exhibits32: Chart on Type - Market share 2023-2028 (%)
- Exhibits33: Data Table on Type - Market share 2023-2028 (%)
- Exhibits34: Chart on Comparison by Type
- Exhibits35: Data Table on Comparison by Type
- Exhibits36: Chart on Air bridge - Market size and forecast 2023-2028 ($ million)
- Exhibits37: Data Table on Air bridge - Market size and forecast 2023-2028 ($ million)
- Exhibits38: Chart on Air bridge - Year-over-year growth 2023-2028 (%)
- Exhibits39: Data Table on Air bridge - Year-over-year growth 2023-2028 (%)
- Exhibits40: Chart on Preconditioned air unit - Market size and forecast 2023-2028 ($ million)
- Exhibits41: Data Table on Preconditioned air unit - Market size and forecast 2023-2028 ($ million)
- Exhibits42: Chart on Preconditioned air unit - Year-over-year growth 2023-2028 (%)
- Exhibits43: Data Table on Preconditioned air unit - Year-over-year growth 2023-2028 (%)
- Exhibits44: Chart on Stand entry guidance system - Market size and forecast 2023-2028 ($ million)
- Exhibits45: Data Table on Stand entry guidance system - Market size and forecast 2023-2028 ($ million)
- Exhibits46: Chart on Stand entry guidance system - Year-over-year growth 2023-2028 (%)
- Exhibits47: Data Table on Stand entry guidance system - Year-over-year growth 2023-2028 (%)
- Exhibits48: Chart on Electrical ground power unit - Market size and forecast 2023-2028 ($ million)
- Exhibits49: Data Table on Electrical ground power unit - Market size and forecast 2023-2028 ($ million)
- Exhibits50: Chart on Electrical ground power unit - Year-over-year growth 2023-2028 (%)
- Exhibits51: Data Table on Electrical ground power unit - Year-over-year growth 2023-2028 (%)
- Exhibits52: Market opportunity by Type ($ million)
- Exhibits53: Data Table on Market opportunity by Type ($ million)
- Exhibits54: Chart on Application - Market share 2023-2028 (%)
- Exhibits55: Data Table on Application - Market share 2023-2028 (%)
- Exhibits56: Chart on Comparison by Application
- Exhibits57: Data Table on Comparison by Application
- Exhibits58: Chart on Aircraft operations - Market size and forecast 2023-2028 ($ million)
- Exhibits59: Data Table on Aircraft operations - Market size and forecast 2023-2028 ($ million)
- Exhibits60: Chart on Aircraft operations - Year-over-year growth 2023-2028 (%)
- Exhibits61: Data Table on Aircraft operations - Year-over-year growth 2023-2028 (%)
- Exhibits62: Chart on MRO - Market size and forecast 2023-2028 ($ million)
- Exhibits63: Data Table on MRO - Market size and forecast 2023-2028 ($ million)
- Exhibits64: Chart on MRO - Year-over-year growth 2023-2028 (%)
- Exhibits65: Data Table on MRO - Year-over-year growth 2023-2028 (%)
- Exhibits66: Market opportunity by Application ($ million)
- Exhibits67: Data Table on Market opportunity by Application ($ million)
- Exhibits68: Analysis of price sensitivity, lifecycle, customer purchase basket, adoption rates, and purchase criteria
- Exhibits69: Chart on Market share By Geographical Landscape 2023-2028 (%)
- Exhibits70: Data Table on Market share By Geographical Landscape 2023-2028 (%)
- Exhibits71: Chart on Geographic comparison
- Exhibits72: Data Table on Geographic comparison
- Exhibits73: Chart on North America - Market size and forecast 2023-2028 ($ million)
- Exhibits74: Data Table on North America - Market size and forecast 2023-2028 ($ million)
- Exhibits75: Chart on North America - Year-over-year growth 2023-2028 (%)
- Exhibits76: Data Table on North America - Year-over-year growth 2023-2028 (%)
- Exhibits77: Chart on APAC - Market size and forecast 2023-2028 ($ million)
- Exhibits78: Data Table on APAC - Market size and forecast 2023-2028 ($ million)
- Exhibits79: Chart on APAC - Year-over-year growth 2023-2028 (%)
- Exhibits80: Data Table on APAC - Year-over-year growth 2023-2028 (%)
- Exhibits81: Chart on Europe - Market size and forecast 2023-2028 ($ million)
- Exhibits82: Data Table on Europe - Market size and forecast 2023-2028 ($ million)
- Exhibits83: Chart on Europe - Year-over-year growth 2023-2028 (%)
- Exhibits84: Data Table on Europe - Year-over-year growth 2023-2028 (%)
- Exhibits85: Chart on South America - Market size and forecast 2023-2028 ($ million)
- Exhibits86: Data Table on South America - Market size and forecast 2023-2028 ($ million)
- Exhibits87: Chart on South America - Year-over-year growth 2023-2028 (%)
- Exhibits88: Data Table on South America - Year-over-year growth 2023-2028 (%)
- Exhibits89: Chart on Middle East and Africa - Market size and forecast 2023-2028 ($ million)
- Exhibits90: Data Table on Middle East and Africa - Market size and forecast 2023-2028 ($ million)
- Exhibits91: Chart on Middle East and Africa - Year-over-year growth 2023-2028 (%)
- Exhibits92: Data Table on Middle East and Africa - Year-over-year growth 2023-2028 (%)
- Exhibits93: Chart on US - Market size and forecast 2023-2028 ($ million)
- Exhibits94: Data Table on US - Market size and forecast 2023-2028 ($ million)
- Exhibits95: Chart on US - Year-over-year growth 2023-2028 (%)
- Exhibits96: Data Table on US - Year-over-year growth 2023-2028 (%)
- Exhibits97: Chart on China - Market size and forecast 2023-2028 ($ million)
- Exhibits98: Data Table on China - Market size and forecast 2023-2028 ($ million)
- Exhibits99: Chart on China - Year-over-year growth 2023-2028 (%)
- Exhibits100: Data Table on China - Year-over-year growth 2023-2028 (%)
- Exhibits101: Chart on Germany - Market size and forecast 2023-2028 ($ million)
- Exhibits102: Data Table on Germany - Market size and forecast 2023-2028 ($ million)
- Exhibits103: Chart on Germany - Year-over-year growth 2023-2028 (%)
- Exhibits104: Data Table on Germany - Year-over-year growth 2023-2028 (%)
- Exhibits105: Chart on Canada - Market size and forecast 2023-2028 ($ million)
- Exhibits106: Data Table on Canada - Market size and forecast 2023-2028 ($ million)
- Exhibits107: Chart on Canada - Year-over-year growth 2023-2028 (%)
- Exhibits108: Data Table on Canada - Year-over-year growth 2023-2028 (%)
- Exhibits109: Chart on UK - Market size and forecast 2023-2028 ($ million)
- Exhibits110: Data Table on UK - Market size and forecast 2023-2028 ($ million)
- Exhibits111: Chart on UK - Year-over-year growth 2023-2028 (%)
- Exhibits112: Data Table on UK - Year-over-year growth 2023-2028 (%)
- Exhibits113: Market opportunity By Geographical Landscape ($ million)
- Exhibits114: Data Tables on Market opportunity By Geographical Landscape ($ million)
- Exhibits115: Impact of drivers and challenges in 2023 and 2028
- Exhibits116: Overview on criticality of inputs and factors of differentiation
- Exhibits117: Overview on factors of disruption
- Exhibits118: Impact of key risks on business
- Exhibits119: Companies covered
- Exhibits120: Matrix on companies position and classification
- Exhibits121: ADB Safegate BV - Overview
- Exhibits122: ADB Safegate BV - Product / Service
- Exhibits123: ADB Safegate BV - Key offerings
- Exhibits124: ADELTE Group SL - Overview
- Exhibits125: ADELTE Group SL - Product / Service
- Exhibits126: ADELTE Group SL - Key offerings
- Exhibits127: AERO Specialties Inc. - Overview
- Exhibits128: AERO Specialties Inc. - Product / Service
- Exhibits129: AERO Specialties Inc. - Key offerings
- Exhibits130: Cavotec SA - Overview
- Exhibits131: Cavotec SA - Business segments
- Exhibits132: Cavotec SA - Key offerings
- Exhibits133: Cavotec SA - Segment focus
- Exhibits134: Dedienne Aerospace - Overview
- Exhibits135: Dedienne Aerospace - Product / Service
- Exhibits136: Dedienne Aerospace - Key offerings
- Exhibits137: DENGE - Overview
- Exhibits138: DENGE - Product / Service
- Exhibits139: DENGE - Key offerings
- Exhibits140: FMT Aircraft Gate Support Systems AB - Overview
- Exhibits141: FMT Aircraft Gate Support Systems AB - Product / Service
- Exhibits142: FMT Aircraft Gate Support Systems AB - Key offerings
- Exhibits143: HHI Corp. - Overview
- Exhibits144: HHI Corp. - Product / Service
- Exhibits145: HHI Corp. - Key offerings
- Exhibits146: John Bean Technologies Corp. - Overview
- Exhibits147: John Bean Technologies Corp. - Business segments
- Exhibits148: John Bean Technologies Corp. - Key news
- Exhibits149: John Bean Technologies Corp. - Key offerings
- Exhibits150: John Bean Technologies Corp. - Segment focus
- Exhibits151: Mallaghan GA Inc. - Overview
- Exhibits152: Mallaghan GA Inc. - Product / Service
- Exhibits153: Mallaghan GA Inc. - Key news
- Exhibits154: Mallaghan GA Inc. - Key offerings
- Exhibits155: Omega Aviation Services Inc. - Overview
- Exhibits156: Omega Aviation Services Inc. - Product / Service
- Exhibits157: Omega Aviation Services Inc. - Key offerings
- Exhibits158: ShinMaywa Industries Ltd. - Overview
- Exhibits159: ShinMaywa Industries Ltd. - Business segments
- Exhibits160: ShinMaywa Industries Ltd. - Key offerings
- Exhibits161: ShinMaywa Industries Ltd. - Segment focus
- Exhibits162: Textron Inc. - Overview
- Exhibits163: Textron Inc. - Business segments
- Exhibits164: Textron Inc. - Key offerings
- Exhibits165: Textron Inc. - Segment focus
- Exhibits166: thyssenkrupp AG - Overview
- Exhibits167: thyssenkrupp AG - Business segments
- Exhibits168: thyssenkrupp AG - Key news
- Exhibits169: thyssenkrupp AG - Key offerings
- Exhibits170: thyssenkrupp AG - Segment focus
- Exhibits171: TREPEL Airport Equipment GmbH - Overview
- Exhibits172: TREPEL Airport Equipment GmbH - Product / Service
- Exhibits173: TREPEL Airport Equipment GmbH - Key offerings
- Exhibits174: Inclusions checklist
- Exhibits175: Exclusions checklist
- Exhibits176: Currency conversion rates for US$
- Exhibits177: Research methodology
- Exhibits178: Information sources
- Exhibits179: Data validation
- Exhibits180: Validation techniques employed for market sizing
- Exhibits181: Data synthesis
- Exhibits182: 360 degree market analysis
- Exhibits183: List of abbreviations
The airport stands equipment market is forecasted to grow by USD 1633.5 mn during 2023-2028, accelerating at a CAGR of 6.78% during the forecast period. The report on the airport stands equipment market provides a holistic analysis, market size and forecast, trends, growth drivers, and challenges, as well as vendor analysis covering around 25 vendors.
The report offers an up-to-date analysis regarding the current market scenario, the latest trends and drivers, and the overall market environment. The market is driven by increase in global freight and passenger traffic, technological advancements in airport stands equipment, and growing preference for smart airports.
Technavio's airport stands equipment market is segmented as below:
| Market Scope | |
|---|---|
| Base Year | 2024 |
| End Year | 2028 |
| Series Year | 2024-2028 |
| Growth Momentum | Accelerate |
| YOY 2024 | 6.23% |
| CAGR | 6.78% |
| Incremental Value | $1633.5 mn |
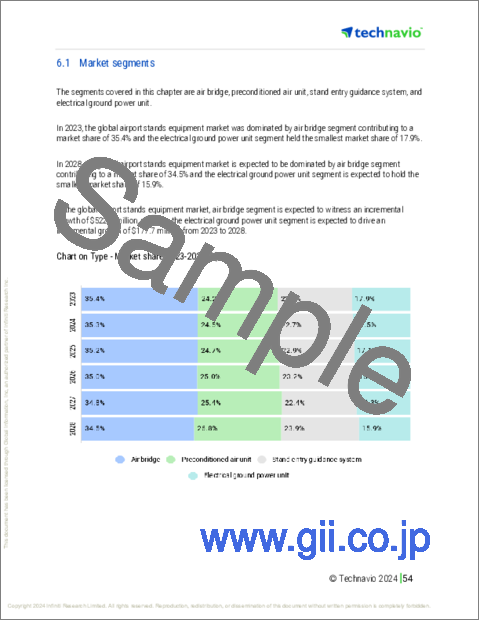
By Type
- Air bridge
- Preconditioned air unit
- Stand entry guidance system
- Electrical ground power unit
By Application
- Aircraft operations
- MRO
By Geographical Landscape
- North America
- APAC
- Europe
- South America
- Middle East and Africa
This study identifies the rise in construction and upgradation of airports as one of the prime reasons driving the airport stands equipment market growth during the next few years. Also, increase in expenses of low-cost operators and greater focus on non-aviation-related revenue will lead to sizable demand in the market.
The report on the airport stands equipment market covers the following areas:
- Airport stands equipment market sizing
- Airport stands equipment market forecast
- Airport stands equipment market industry analysis
The robust vendor analysis is designed to help clients improve their market position, and in line with this, this report provides a detailed analysis of several leading airport stands equipment market vendors that include ADB Safegate BV, ADELTE Group SL, AERO Specialties Inc., Cavotec SA, Dedienne Aerospace, DENGE, FMT Aircraft Gate Support Systems AB, HHI Corp., Holden Industries Inc., HYDRO Systems KG, JETechnology Solutions, John Bean Technologies Corp., Mallaghan GA Inc., Omega Aviation Services Inc., Semmco Group, ShinMaywa Industries Ltd., Textron Inc., thyssenkrupp AG, TREPEL Airport Equipment GmbH, and Waag. Also, the airport stands equipment market analysis report includes information on upcoming trends and challenges that will influence market growth. This is to help companies strategize and leverage all forthcoming growth opportunities.
The study was conducted using an objective combination of primary and secondary information including inputs from key participants in the industry. The report contains a comprehensive market and vendor landscape in addition to an analysis of the key vendors.
The publisher presents a detailed picture of the market by the way of study, synthesis, and summation of data from multiple sources by an analysis of key parameters such as profit, pricing, competition, and promotions. It presents various market facets by identifying the key industry influencers. The data presented is comprehensive, reliable, and a result of extensive primary and secondary research. The market research reports provide a complete competitive landscape and an in-depth vendor selection methodology and analysis using qualitative and quantitative research to forecast accurate market growth.
Table of Contents
1 Executive Summary
- 1.1 Market overview
- Executive Summary - Chart on Market Overview
- Executive Summary - Data Table on Market Overview
- Executive Summary - Chart on Global Market Characteristics
- Executive Summary - Chart on Market By Geographical Landscape
- Executive Summary - Chart on Market Segmentation by Type
- Executive Summary - Chart on Market Segmentation by Application
- Executive Summary - Chart on Incremental Growth
- Executive Summary - Data Table on Incremental Growth
- Executive Summary - Chart on Company Market Positioning
2 Market Landscape
- 2.1 Market ecosystem
- Parent Market
- Data Table on - Parent Market
- 2.2 Market characteristics
- Market characteristics analysis
- 2.3 Value chain analysis
- Value Chain Analysis
3 Market Sizing
- 3.1 Market definition
- Offerings of companies included in the market definition
- 3.2 Market segment analysis
- Market segments
- 3.3 Market size 2023
- 3.4 Market outlook: Forecast for 2023-2028
- Chart on Global - Market size and forecast 2023-2028 ($ million)
- Data Table on Global - Market size and forecast 2023-2028 ($ million)
- Chart on Global Market: Year-over-year growth 2023-2028 (%)
- Data Table on Global Market: Year-over-year growth 2023-2028 (%)
4 Historic Market Size
- 4.1 Global Airport Stands Equipment Market 2018 - 2022
- Historic Market Size - Data Table on Global Airport Stands Equipment Market 2018 - 2022 ($ million)
- 4.2 Type segment analysis 2018 - 2022
- Historic Market Size - Type Segment 2018 - 2022 ($ million)
- 4.3 Application segment analysis 2018 - 2022
- Historic Market Size - Application Segment 2018 - 2022 ($ million)
- 4.4 Geography segment analysis 2018 - 2022
- Historic Market Size - Geography Segment 2018 - 2022 ($ million)
- 4.5 Country segment analysis 2018 - 2022
- Historic Market Size - Country Segment 2018 - 2022 ($ million)
5 Five Forces Analysis
- 5.1 Five forces summary
- Five forces analysis - Comparison between 2023 and 2028
- 5.2 Bargaining power of buyers
- Bargaining power of buyers - Impact of key factors 2023 and 2028
- 5.3 Bargaining power of suppliers
- Bargaining power of suppliers - Impact of key factors in 2023 and 2028
- 5.4 Threat of new entrants
- Threat of new entrants - Impact of key factors in 2023 and 2028
- 5.5 Threat of substitutes
- Threat of substitutes - Impact of key factors in 2023 and 2028
- 5.6 Threat of rivalry
- Threat of rivalry - Impact of key factors in 2023 and 2028
- 5.7 Market condition
- Chart on Market condition - Five forces 2023 and 2028
6 Market Segmentation by Type
- 6.1 Market segments
- Chart on Type - Market share 2023-2028 (%)
- Data Table on Type - Market share 2023-2028 (%)
- 6.2 Comparison by Type
- Chart on Comparison by Type
- Data Table on Comparison by Type
- 6.3 Air bridge - Market size and forecast 2023-2028
- Chart on Air bridge - Market size and forecast 2023-2028 ($ million)
- Data Table on Air bridge - Market size and forecast 2023-2028 ($ million)
- Chart on Air bridge - Year-over-year growth 2023-2028 (%)
- Data Table on Air bridge - Year-over-year growth 2023-2028 (%)
- 6.4 Preconditioned air unit - Market size and forecast 2023-2028
- Chart on Preconditioned air unit - Market size and forecast 2023-2028 ($ million)
- Data Table on Preconditioned air unit - Market size and forecast 2023-2028 ($ million)
- Chart on Preconditioned air unit - Year-over-year growth 2023-2028 (%)
- Data Table on Preconditioned air unit - Year-over-year growth 2023-2028 (%)
- 6.5 Stand entry guidance system - Market size and forecast 2023-2028
- Chart on Stand entry guidance system - Market size and forecast 2023-2028 ($ million)
- Data Table on Stand entry guidance system - Market size and forecast 2023-2028 ($ million)
- Chart on Stand entry guidance system - Year-over-year growth 2023-2028 (%)
- Data Table on Stand entry guidance system - Year-over-year growth 2023-2028 (%)
- 6.6 Electrical ground power unit - Market size and forecast 2023-2028
- Chart on Electrical ground power unit - Market size and forecast 2023-2028 ($ million)
- Data Table on Electrical ground power unit - Market size and forecast 2023-2028 ($ million)
- Chart on Electrical ground power unit - Year-over-year growth 2023-2028 (%)
- Data Table on Electrical ground power unit - Year-over-year growth 2023-2028 (%)
- 6.7 Market opportunity by Type
- Market opportunity by Type ($ million)
- Data Table on Market opportunity by Type ($ million)
7 Market Segmentation by Application
- 7.1 Market segments
- Chart on Application - Market share 2023-2028 (%)
- Data Table on Application - Market share 2023-2028 (%)
- 7.2 Comparison by Application
- Chart on Comparison by Application
- Data Table on Comparison by Application
- 7.3 Aircraft operations - Market size and forecast 2023-2028
- Chart on Aircraft operations - Market size and forecast 2023-2028 ($ million)
- Data Table on Aircraft operations - Market size and forecast 2023-2028 ($ million)
- Chart on Aircraft operations - Year-over-year growth 2023-2028 (%)
- Data Table on Aircraft operations - Year-over-year growth 2023-2028 (%)
- 7.4 MRO - Market size and forecast 2023-2028
- Chart on MRO - Market size and forecast 2023-2028 ($ million)
- Data Table on MRO - Market size and forecast 2023-2028 ($ million)
- Chart on MRO - Year-over-year growth 2023-2028 (%)
- Data Table on MRO - Year-over-year growth 2023-2028 (%)
- 7.5 Market opportunity by Application
- Market opportunity by Application ($ million)
- Data Table on Market opportunity by Application ($ million)
8 Customer Landscape
- 8.1 Customer landscape overview
- Analysis of price sensitivity, lifecycle, customer purchase basket, adoption rates, and purchase criteria
9 Geographic Landscape
- 9.1 Geographic segmentation
- Chart on Market share By Geographical Landscape 2023-2028 (%)
- Data Table on Market share By Geographical Landscape 2023-2028 (%)
- 9.2 Geographic comparison
- Chart on Geographic comparison
- Data Table on Geographic comparison
- 9.3 North America - Market size and forecast 2023-2028
- Chart on North America - Market size and forecast 2023-2028 ($ million)
- Data Table on North America - Market size and forecast 2023-2028 ($ million)
- Chart on North America - Year-over-year growth 2023-2028 (%)
- Data Table on North America - Year-over-year growth 2023-2028 (%)
- 9.4 APAC - Market size and forecast 2023-2028
- Chart on APAC - Market size and forecast 2023-2028 ($ million)
- Data Table on APAC - Market size and forecast 2023-2028 ($ million)
- Chart on APAC - Year-over-year growth 2023-2028 (%)
- Data Table on APAC - Year-over-year growth 2023-2028 (%)
- 9.5 Europe - Market size and forecast 2023-2028
- Chart on Europe - Market size and forecast 2023-2028 ($ million)
- Data Table on Europe - Market size and forecast 2023-2028 ($ million)
- Chart on Europe - Year-over-year growth 2023-2028 (%)
- Data Table on Europe - Year-over-year growth 2023-2028 (%)
- 9.6 South America - Market size and forecast 2023-2028
- Chart on South America - Market size and forecast 2023-2028 ($ million)
- Data Table on South America - Market size and forecast 2023-2028 ($ million)
- Chart on South America - Year-over-year growth 2023-2028 (%)
- Data Table on South America - Year-over-year growth 2023-2028 (%)
- 9.7 Middle East and Africa - Market size and forecast 2023-2028
- Chart on Middle East and Africa - Market size and forecast 2023-2028 ($ million)
- Data Table on Middle East and Africa - Market size and forecast 2023-2028 ($ million)
- Chart on Middle East and Africa - Year-over-year growth 2023-2028 (%)
- Data Table on Middle East and Africa - Year-over-year growth 2023-2028 (%)
- 9.8 US - Market size and forecast 2023-2028
- Chart on US - Market size and forecast 2023-2028 ($ million)
- Data Table on US - Market size and forecast 2023-2028 ($ million)
- Chart on US - Year-over-year growth 2023-2028 (%)
- Data Table on US - Year-over-year growth 2023-2028 (%)
- 9.9 China - Market size and forecast 2023-2028
- Chart on China - Market size and forecast 2023-2028 ($ million)
- Data Table on China - Market size and forecast 2023-2028 ($ million)
- Chart on China - Year-over-year growth 2023-2028 (%)
- Data Table on China - Year-over-year growth 2023-2028 (%)
- 9.10 Germany - Market size and forecast 2023-2028
- Chart on Germany - Market size and forecast 2023-2028 ($ million)
- Data Table on Germany - Market size and forecast 2023-2028 ($ million)
- Chart on Germany - Year-over-year growth 2023-2028 (%)
- Data Table on Germany - Year-over-year growth 2023-2028 (%)
- 9.11 Canada - Market size and forecast 2023-2028
- Chart on Canada - Market size and forecast 2023-2028 ($ million)
- Data Table on Canada - Market size and forecast 2023-2028 ($ million)
- Chart on Canada - Year-over-year growth 2023-2028 (%)
- Data Table on Canada - Year-over-year growth 2023-2028 (%)
- 9.12 UK - Market size and forecast 2023-2028
- Chart on UK - Market size and forecast 2023-2028 ($ million)
- Data Table on UK - Market size and forecast 2023-2028 ($ million)
- Chart on UK - Year-over-year growth 2023-2028 (%)
- Data Table on UK - Year-over-year growth 2023-2028 (%)
- 9.13 Market opportunity By Geographical Landscape
- Market opportunity By Geographical Landscape ($ million)
- Data Tables on Market opportunity By Geographical Landscape ($ million)
10 Drivers, Challenges, and Opportunity/Restraints
- 10.1 Market drivers
- 10.2 Market challenges
- 10.3 Impact of drivers and challenges
- Impact of drivers and challenges in 2023 and 2028
- 10.4 Market opportunities/restraints
11 Competitive Landscape
- 11.1 Overview
- 11.2 Competitive Landscape
- Overview on criticality of inputs and factors of differentiation
- 11.3 Landscape disruption
- Overview on factors of disruption
- 11.4 Industry risks
- Impact of key risks on business
12 Competitive Analysis
- 12.1 Companies profiled
- Companies covered
- 12.2 Market positioning of companies
- Matrix on companies position and classification
- 12.3 ADB Safegate BV
- ADB Safegate BV - Overview
- ADB Safegate BV - Product / Service
- ADB Safegate BV - Key offerings
- 12.4 ADELTE Group SL
- ADELTE Group SL - Overview
- ADELTE Group SL - Product / Service
- ADELTE Group SL - Key offerings
- 12.5 AERO Specialties Inc.
- AERO Specialties Inc. - Overview
- AERO Specialties Inc. - Product / Service
- AERO Specialties Inc. - Key offerings
- 12.6 Cavotec SA
- Cavotec SA - Overview
- Cavotec SA - Business segments
- Cavotec SA - Key offerings
- Cavotec SA - Segment focus
- 12.7 Dedienne Aerospace
- Dedienne Aerospace - Overview
- Dedienne Aerospace - Product / Service
- Dedienne Aerospace - Key offerings
- 12.8 DENGE
- DENGE - Overview
- DENGE - Product / Service
- DENGE - Key offerings
- 12.9 FMT Aircraft Gate Support Systems AB
- FMT Aircraft Gate Support Systems AB - Overview
- FMT Aircraft Gate Support Systems AB - Product / Service
- FMT Aircraft Gate Support Systems AB - Key offerings
- 12.10 HHI Corp.
- HHI Corp. - Overview
- HHI Corp. - Product / Service
- HHI Corp. - Key offerings
- 12.11 John Bean Technologies Corp.
- John Bean Technologies Corp. - Overview
- John Bean Technologies Corp. - Business segments
- John Bean Technologies Corp. - Key news
- John Bean Technologies Corp. - Key offerings
- John Bean Technologies Corp. - Segment focus
- 12.12 Mallaghan GA Inc.
- Mallaghan GA Inc. - Overview
- Mallaghan GA Inc. - Product / Service
- Mallaghan GA Inc. - Key news
- Mallaghan GA Inc. - Key offerings
- 12.13 Omega Aviation Services Inc.
- Omega Aviation Services Inc. - Overview
- Omega Aviation Services Inc. - Product / Service
- Omega Aviation Services Inc. - Key offerings
- 12.14 ShinMaywa Industries Ltd.
- ShinMaywa Industries Ltd. - Overview
- ShinMaywa Industries Ltd. - Business segments
- ShinMaywa Industries Ltd. - Key offerings
- ShinMaywa Industries Ltd. - Segment focus
- 12.15 Textron Inc.
- Textron Inc. - Overview
- Textron Inc. - Business segments
- Textron Inc. - Key offerings
- Textron Inc. - Segment focus
- 12.16 thyssenkrupp AG
- thyssenkrupp AG - Overview
- thyssenkrupp AG - Business segments
- thyssenkrupp AG - Key news
- thyssenkrupp AG - Key offerings
- thyssenkrupp AG - Segment focus
- 12.17 TREPEL Airport Equipment GmbH
- TREPEL Airport Equipment GmbH - Overview
- TREPEL Airport Equipment GmbH - Product / Service
- TREPEL Airport Equipment GmbH - Key offerings
13 Appendix
- 13.1 Scope of the report
- 13.2 Inclusions and exclusions checklist
- Inclusions checklist
- Exclusions checklist
- 13.3 Currency conversion rates for US$
- Currency conversion rates for US$
- 13.4 Research methodology
- Research methodology
- 13.5 Data procurement
- Information sources
- 13.6 Data validation
- Data validation
- 13.7 Validation techniques employed for market sizing
- Validation techniques employed for market sizing
- 13.8 Data synthesis
- Data synthesis
- 13.9 360 degree market analysis
- 360 degree market analysis
- 13.10 List of abbreviations
- List of abbreviations

