|
|
市場調査レポート
商品コード
1517243
チューブ・スティック包装の世界市場 2024-2028Global tube and stick packaging market 2024-2028 |
||||||
|
|||||||
カスタマイズ可能
|
|||||||


| チューブ・スティック包装の世界市場 2024-2028 |
|
出版日: 2024年06月12日
発行: TechNavio
ページ情報: 英文 180 Pages
納期: 即納可能
|

全表示
- 概要
- 図表
- 目次
チューブ・スティック包装市場は2023-2028年に55億7,260万米ドル、予測期間中のCAGRは7.44%で成長すると予測されます。
この調査レポートは、チューブ・スティック包装市場の全体分析、市場規模・予測、動向、成長促進要因、課題、約25のベンダーを網羅したベンダー分析などを掲載しています。
現在の市場シナリオ、最新動向と促進要因、市場環境全体に関する最新分析を提供しています。市場は、利便性包装の需要増加、eコマース産業からの需要増加、包装材料における優れたバリア特性の需要増加によって牽引されています。
| 市場範囲 | |
|---|---|
| 基準年 | 2024 |
| 終了年 | 2028 |
| 予測期間 | 2024-2028 |
| 成長モメンタム | 加速 |
| 前年比2024年 | 6.4% |
| CAGR | 7.44% |
| 増分額 | 55億7,260万米ドル |
本調査では、今後数年間のチューブ・スティック包装市場成長を牽引する主要因の1つとして、バイオプラスチックベースのパッケージング採用の増加を挙げています。また、紙ベースのチューブ包装の出現と包装技術の先進化は、市場の大きな需要につながります。
目次
第1章 エグゼクティブサマリー
- 市場概要
第2章 市場情勢
- 市場エコシステム
- 市場の特徴
- バリューチェーン分析
第3章 市場規模の評価
- 市場の定義
- 市場セグメント分析
- 市場規模 2023
- 市場の見通し 2023-2028
第4章 市場規模実績
- 世界チューブ・スティック包装市場 2018-2022
- エンドユーザーセグメント分析 2018-2022
- タイプセグメント分析 2018-2022
- 地域別セグメント分析 2018-2022
- 国別セグメント分析 2018-2022
第5章 ファイブフォース分析
- ファイブフォースの要約
- 買い手の交渉力
- 供給企業の交渉力
- 新規参入業者の脅威
- 代替品の脅威
- 競争の脅威
- 市況
第6章 市場セグメンテーション:エンドユーザー別
- 市場セグメンテーション
- 比較:エンドユーザー別
- 化粧品と口腔ケア:市場規模と予測 2023-2028
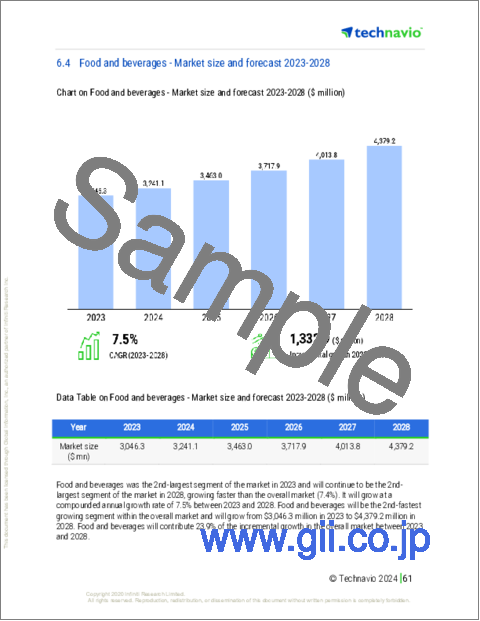
- 飲食品:市場規模と予測 2023-2028
- 医薬品:市場規模と予測 2023-2028
- その他:市場規模と予測 2023-2028
- 市場機会:エンドユーザー別
第7章 市場セグメンテーション:タイプ別
- 市場セグメンテーション
- 比較:タイプ別
- スクイーズチューブ:市場規模と予測 2023-2028
- ツイストチューブ:市場規模と予測 2023-2028
- カートリッジ:市場規模と予測 2023-2028
- その他:市場規模と予測 2023-2028
- 市場機会:タイプ別
第8章 顧客情勢
- 顧客情勢の概要
第9章 地域別情勢
- 地域別セグメンテーション
- 地域別比較
- アジア太平洋:市場規模と予測 2023-2028
- 北米:市場規模と予測 2023-2028
- 欧州:市場規模と予測 2023-2028
- 中東・アフリカ:市場規模と予測 2023-2028
- 南米:市場規模と予測 2023-2028
- 米国:市場規模と予測 2023-2028
- 中国:市場規模と予測 2023-2028
- ドイツ:市場規模と予測 2023-2028
- 英国:市場規模と予測 2023-2028
- 日本:市場規模と予測 2023-2028
- 市場機会:地域情勢別
第10章 促進要因・課題・機会・抑制要因
- 市場促進要因
- 市場の課題
- 促進要因と課題の影響
- 市場の機会・抑制要因
第11章 競合情勢
- 概要
- 競合情勢
- 混乱の状況
- 業界のリスク
第12章 競合分析
- 企業プロファイル
- 企業の市場ポジショニング
- Amcor Plc
- ARANOW Packaging Machinery SL
- Armbrust Paper Tubes Inc.
- Berry Global Inc.
- CCL Industries Inc.
- Clariant International Ltd.
- Constantia Flexibles Group GmbH
- EPL Ltd.
- Hoffmann Neopac AG
- Huhtamaki Oyj
- Mondi Plc
- Plastube
- Precision Concepts International
- Sinclair and Rush Inc.
- The Estee Lauder Companies Inc.
第13章 付録
Exhibits:
- Exhibits1: Executive Summary - Chart on Market Overview
- Exhibits2: Executive Summary - Data Table on Market Overview
- Exhibits3: Executive Summary - Chart on Global Market Characteristics
- Exhibits4: Executive Summary - Chart on Market By Geographical Landscape
- Exhibits5: Executive Summary - Chart on Market Segmentation by End-user
- Exhibits6: Executive Summary - Chart on Market Segmentation by Type
- Exhibits7: Executive Summary - Chart on Incremental Growth
- Exhibits8: Executive Summary - Data Table on Incremental Growth
- Exhibits9: Executive Summary - Chart on Company Market Positioning
- Exhibits10: Parent Market
- Exhibits11: Data Table on - Parent Market
- Exhibits12: Market characteristics analysis
- Exhibits13: Value Chain Analysis
- Exhibits14: Offerings of companies included in the market definition
- Exhibits15: Market segments
- Exhibits16: Chart on Global - Market size and forecast 2023-2028 ($ million)
- Exhibits17: Data Table on Global - Market size and forecast 2023-2028 ($ million)
- Exhibits18: Chart on Global Market: Year-over-year growth 2023-2028 (%)
- Exhibits19: Data Table on Global Market: Year-over-year growth 2023-2028 (%)
- Exhibits20: Historic Market Size - Data Table on Global Tube And Stick Packaging Market 2018 - 2022 ($ million)
- Exhibits21: Historic Market Size - End-user Segment 2018 - 2022 ($ million)
- Exhibits22: Historic Market Size - Type Segment 2018 - 2022 ($ million)
- Exhibits23: Historic Market Size - Geography Segment 2018 - 2022 ($ million)
- Exhibits24: Historic Market Size - Country Segment 2018 - 2022 ($ million)
- Exhibits25: Five forces analysis - Comparison between 2023 and 2028
- Exhibits26: Bargaining power of buyers - Impact of key factors 2023 and 2028
- Exhibits27: Bargaining power of suppliers - Impact of key factors in 2023 and 2028
- Exhibits28: Threat of new entrants - Impact of key factors in 2023 and 2028
- Exhibits29: Threat of substitutes - Impact of key factors in 2023 and 2028
- Exhibits30: Threat of rivalry - Impact of key factors in 2023 and 2028
- Exhibits31: Chart on Market condition - Five forces 2023 and 2028
- Exhibits32: Chart on End-user - Market share 2023-2028 (%)
- Exhibits33: Data Table on End-user - Market share 2023-2028 (%)
- Exhibits34: Chart on Comparison by End-user
- Exhibits35: Data Table on Comparison by End-user
- Exhibits36: Chart on Cosmetic and oral care - Market size and forecast 2023-2028 ($ million)
- Exhibits37: Data Table on Cosmetic and oral care - Market size and forecast 2023-2028 ($ million)
- Exhibits38: Chart on Cosmetic and oral care - Year-over-year growth 2023-2028 (%)
- Exhibits39: Data Table on Cosmetic and oral care - Year-over-year growth 2023-2028 (%)
- Exhibits40: Chart on Food and beverages - Market size and forecast 2023-2028 ($ million)
- Exhibits41: Data Table on Food and beverages - Market size and forecast 2023-2028 ($ million)
- Exhibits42: Chart on Food and beverages - Year-over-year growth 2023-2028 (%)
- Exhibits43: Data Table on Food and beverages - Year-over-year growth 2023-2028 (%)
- Exhibits44: Chart on Pharmaceuticals - Market size and forecast 2023-2028 ($ million)
- Exhibits45: Data Table on Pharmaceuticals - Market size and forecast 2023-2028 ($ million)
- Exhibits46: Chart on Pharmaceuticals - Year-over-year growth 2023-2028 (%)
- Exhibits47: Data Table on Pharmaceuticals - Year-over-year growth 2023-2028 (%)
- Exhibits48: Chart on Others - Market size and forecast 2023-2028 ($ million)
- Exhibits49: Data Table on Others - Market size and forecast 2023-2028 ($ million)
- Exhibits50: Chart on Others - Year-over-year growth 2023-2028 (%)
- Exhibits51: Data Table on Others - Year-over-year growth 2023-2028 (%)
- Exhibits52: Market opportunity by End-user ($ million)
- Exhibits53: Data Table on Market opportunity by End-user ($ million)
- Exhibits54: Chart on Type - Market share 2023-2028 (%)
- Exhibits55: Data Table on Type - Market share 2023-2028 (%)
- Exhibits56: Chart on Comparison by Type
- Exhibits57: Data Table on Comparison by Type
- Exhibits58: Chart on Squeeze tubes - Market size and forecast 2023-2028 ($ million)
- Exhibits59: Data Table on Squeeze tubes - Market size and forecast 2023-2028 ($ million)
- Exhibits60: Chart on Squeeze tubes - Year-over-year growth 2023-2028 (%)
- Exhibits61: Data Table on Squeeze tubes - Year-over-year growth 2023-2028 (%)
- Exhibits62: Chart on Twist tubes - Market size and forecast 2023-2028 ($ million)
- Exhibits63: Data Table on Twist tubes - Market size and forecast 2023-2028 ($ million)
- Exhibits64: Chart on Twist tubes - Year-over-year growth 2023-2028 (%)
- Exhibits65: Data Table on Twist tubes - Year-over-year growth 2023-2028 (%)
- Exhibits66: Chart on Cartridge - Market size and forecast 2023-2028 ($ million)
- Exhibits67: Data Table on Cartridge - Market size and forecast 2023-2028 ($ million)
- Exhibits68: Chart on Cartridge - Year-over-year growth 2023-2028 (%)
- Exhibits69: Data Table on Cartridge - Year-over-year growth 2023-2028 (%)
- Exhibits70: Chart on Others - Market size and forecast 2023-2028 ($ million)
- Exhibits71: Data Table on Others - Market size and forecast 2023-2028 ($ million)
- Exhibits72: Chart on Others - Year-over-year growth 2023-2028 (%)
- Exhibits73: Data Table on Others - Year-over-year growth 2023-2028 (%)
- Exhibits74: Market opportunity by Type ($ million)
- Exhibits75: Data Table on Market opportunity by Type ($ million)
- Exhibits76: Analysis of price sensitivity, lifecycle, customer purchase basket, adoption rates, and purchase criteria
- Exhibits77: Chart on Market share By Geographical Landscape 2023-2028 (%)
- Exhibits78: Data Table on Market share By Geographical Landscape 2023-2028 (%)
- Exhibits79: Chart on Geographic comparison
- Exhibits80: Data Table on Geographic comparison
- Exhibits81: Chart on APAC - Market size and forecast 2023-2028 ($ million)
- Exhibits82: Data Table on APAC - Market size and forecast 2023-2028 ($ million)
- Exhibits83: Chart on APAC - Year-over-year growth 2023-2028 (%)
- Exhibits84: Data Table on APAC - Year-over-year growth 2023-2028 (%)
- Exhibits85: Chart on North America - Market size and forecast 2023-2028 ($ million)
- Exhibits86: Data Table on North America - Market size and forecast 2023-2028 ($ million)
- Exhibits87: Chart on North America - Year-over-year growth 2023-2028 (%)
- Exhibits88: Data Table on North America - Year-over-year growth 2023-2028 (%)
- Exhibits89: Chart on Europe - Market size and forecast 2023-2028 ($ million)
- Exhibits90: Data Table on Europe - Market size and forecast 2023-2028 ($ million)
- Exhibits91: Chart on Europe - Year-over-year growth 2023-2028 (%)
- Exhibits92: Data Table on Europe - Year-over-year growth 2023-2028 (%)
- Exhibits93: Chart on Middle East and Africa - Market size and forecast 2023-2028 ($ million)
- Exhibits94: Data Table on Middle East and Africa - Market size and forecast 2023-2028 ($ million)
- Exhibits95: Chart on Middle East and Africa - Year-over-year growth 2023-2028 (%)
- Exhibits96: Data Table on Middle East and Africa - Year-over-year growth 2023-2028 (%)
- Exhibits97: Chart on South America - Market size and forecast 2023-2028 ($ million)
- Exhibits98: Data Table on South America - Market size and forecast 2023-2028 ($ million)
- Exhibits99: Chart on South America - Year-over-year growth 2023-2028 (%)
- Exhibits100: Data Table on South America - Year-over-year growth 2023-2028 (%)
- Exhibits101: Chart on US - Market size and forecast 2023-2028 ($ million)
- Exhibits102: Data Table on US - Market size and forecast 2023-2028 ($ million)
- Exhibits103: Chart on US - Year-over-year growth 2023-2028 (%)
- Exhibits104: Data Table on US - Year-over-year growth 2023-2028 (%)
- Exhibits105: Chart on China - Market size and forecast 2023-2028 ($ million)
- Exhibits106: Data Table on China - Market size and forecast 2023-2028 ($ million)
- Exhibits107: Chart on China - Year-over-year growth 2023-2028 (%)
- Exhibits108: Data Table on China - Year-over-year growth 2023-2028 (%)
- Exhibits109: Chart on Germany - Market size and forecast 2023-2028 ($ million)
- Exhibits110: Data Table on Germany - Market size and forecast 2023-2028 ($ million)
- Exhibits111: Chart on Germany - Year-over-year growth 2023-2028 (%)
- Exhibits112: Data Table on Germany - Year-over-year growth 2023-2028 (%)
- Exhibits113: Chart on UK - Market size and forecast 2023-2028 ($ million)
- Exhibits114: Data Table on UK - Market size and forecast 2023-2028 ($ million)
- Exhibits115: Chart on UK - Year-over-year growth 2023-2028 (%)
- Exhibits116: Data Table on UK - Year-over-year growth 2023-2028 (%)
- Exhibits117: Chart on Japan - Market size and forecast 2023-2028 ($ million)
- Exhibits118: Data Table on Japan - Market size and forecast 2023-2028 ($ million)
- Exhibits119: Chart on Japan - Year-over-year growth 2023-2028 (%)
- Exhibits120: Data Table on Japan - Year-over-year growth 2023-2028 (%)
- Exhibits121: Market opportunity By Geographical Landscape ($ million)
- Exhibits122: Data Tables on Market opportunity By Geographical Landscape ($ million)
- Exhibits123: Impact of drivers and challenges in 2023 and 2028
- Exhibits124: Overview on criticality of inputs and factors of differentiation
- Exhibits125: Overview on factors of disruption
- Exhibits126: Impact of key risks on business
- Exhibits127: Companies covered
- Exhibits128: Matrix on companies position and classification
- Exhibits129: Amcor Plc - Overview
- Exhibits130: Amcor Plc - Business segments
- Exhibits131: Amcor Plc - Key news
- Exhibits132: Amcor Plc - Key offerings
- Exhibits133: Amcor Plc - Segment focus
- Exhibits134: ARANOW Packaging Machinery SL - Overview
- Exhibits135: ARANOW Packaging Machinery SL - Product / Service
- Exhibits136: ARANOW Packaging Machinery SL - Key offerings
- Exhibits137: Armbrust Paper Tubes Inc. - Overview
- Exhibits138: Armbrust Paper Tubes Inc. - Product / Service
- Exhibits139: Armbrust Paper Tubes Inc. - Key offerings
- Exhibits140: Berry Global Inc. - Overview
- Exhibits141: Berry Global Inc. - Business segments
- Exhibits142: Berry Global Inc. - Key news
- Exhibits143: Berry Global Inc. - Key offerings
- Exhibits144: Berry Global Inc. - Segment focus
- Exhibits145: CCL Industries Inc. - Overview
- Exhibits146: CCL Industries Inc. - Business segments
- Exhibits147: CCL Industries Inc. - Key news
- Exhibits148: CCL Industries Inc. - Key offerings
- Exhibits149: CCL Industries Inc. - Segment focus
- Exhibits150: Clariant International Ltd. - Overview
- Exhibits151: Clariant International Ltd. - Business segments
- Exhibits152: Clariant International Ltd. - Key news
- Exhibits153: Clariant International Ltd. - Key offerings
- Exhibits154: Clariant International Ltd. - Segment focus
- Exhibits155: Constantia Flexibles Group GmbH - Overview
- Exhibits156: Constantia Flexibles Group GmbH - Product / Service
- Exhibits157: Constantia Flexibles Group GmbH - Key news
- Exhibits158: Constantia Flexibles Group GmbH - Key offerings
- Exhibits159: EPL Ltd. - Overview
- Exhibits160: EPL Ltd. - Business segments
- Exhibits161: EPL Ltd. - Key offerings
- Exhibits162: EPL Ltd. - Segment focus
- Exhibits163: Hoffmann Neopac AG - Overview
- Exhibits164: Hoffmann Neopac AG - Product / Service
- Exhibits165: Hoffmann Neopac AG - Key offerings
- Exhibits166: Huhtamaki Oyj - Overview
- Exhibits167: Huhtamaki Oyj - Business segments
- Exhibits168: Huhtamaki Oyj - Key news
- Exhibits169: Huhtamaki Oyj - Key offerings
- Exhibits170: Huhtamaki Oyj - Segment focus
- Exhibits171: Mondi Plc - Overview
- Exhibits172: Mondi Plc - Business segments
- Exhibits173: Mondi Plc - Key news
- Exhibits174: Mondi Plc - Key offerings
- Exhibits175: Mondi Plc - Segment focus
- Exhibits176: Plastube - Overview
- Exhibits177: Plastube - Product / Service
- Exhibits178: Plastube - Key offerings
- Exhibits179: Precision Concepts International - Overview
- Exhibits180: Precision Concepts International - Product / Service
- Exhibits181: Precision Concepts International - Key offerings
- Exhibits182: Sinclair and Rush Inc. - Overview
- Exhibits183: Sinclair and Rush Inc. - Product / Service
- Exhibits184: Sinclair and Rush Inc. - Key offerings
- Exhibits185: The Estee Lauder Companies Inc. - Overview
- Exhibits186: The Estee Lauder Companies Inc. - Product / Service
- Exhibits187: The Estee Lauder Companies Inc. - Key news
- Exhibits188: The Estee Lauder Companies Inc. - Key offerings
- Exhibits189: Inclusions checklist
- Exhibits190: Exclusions checklist
- Exhibits191: Currency conversion rates for US$
- Exhibits192: Research methodology
- Exhibits193: Information sources
- Exhibits194: Data validation
- Exhibits195: Validation techniques employed for market sizing
- Exhibits196: Data synthesis
- Exhibits197: 360 degree market analysis
- Exhibits198: List of abbreviations
The tube and stick packaging market is forecasted to grow by USD 5572.6 mn during 2023-2028, accelerating at a CAGR of 7.44% during the forecast period. The report on the tube and stick packaging market provides a holistic analysis, market size and forecast, trends, growth drivers, and challenges, as well as vendor analysis covering around 25 vendors.
The report offers an up-to-date analysis regarding the current market scenario, the latest trends and drivers, and the overall market environment. The market is driven by increasing demand for convenience packaging, rising demand from e-commerce industry, and rise in demand for excellent barrier properties in packaging material.
Technavio's tube and stick packaging market is segmented as below:
| Market Scope | |
|---|---|
| Base Year | 2024 |
| End Year | 2028 |
| Series Year | 2024-2028 |
| Growth Momentum | Accelerate |
| YOY 2024 | 6.4% |
| CAGR | 7.44% |
| Incremental Value | $5572.6mn |
By End-user
- Cosmetic and oral care
- Food and beverages
- Pharmaceuticals
- Others
By Type
- Squeeze tubes
- Twist tubes
- Cartridge
- Others
By Geographical Landscape
- APAC
- North America
- Europe
- Middle East and Africa
- South America
This study identifies the rise in adoption of bioplastic-based packaging as one of the prime reasons driving the tube and stick packaging market growth during the next few years. Also, emergence of paper-based tube packaging and advancements in packaging technology will lead to sizable demand in the market.
The report on the tube and stick packaging market covers the following areas:
- Tube and stick packaging market sizing
- Tube and stick packaging market forecast
- Tube and stick packaging market industry analysis
The robust vendor analysis is designed to help clients improve their market position, and in line with this, this report provides a detailed analysis of several leading tube and stick packaging market vendors that include Amcor PLC, ARANOW Packaging Machinery SL, Armbrust Paper Tubes Inc., Assemblies Unlimited Inc., Berry Global Inc., CCL Industries Inc., Clariant International Ltd., Constantia Flexibles Group GmbH, EPL Ltd., Hoffmann Neopac AG, Huhtamaki Oyj, Mondi PLC, Plastek Industries Inc., Plastube, Precision Concepts International, Sinclair and Rush Inc., Sonic Packaging Industries Inc., Technical Help in Engineering and Marketing, The Estee Lauder Companies Inc., and World Wide Packaging LLC. Also, the tube and stick packaging market analysis report includes information on upcoming trends and challenges that will influence market growth. This is to help companies strategize and leverage all forthcoming growth opportunities.
The study was conducted using an objective combination of primary and secondary information including inputs from key participants in the industry. The report contains a comprehensive market and vendor landscape in addition to an analysis of the key vendors.
The publisher presents a detailed picture of the market by the way of study, synthesis, and summation of data from multiple sources by an analysis of key parameters such as profit, pricing, competition, and promotions. IT presents various market facets by identifying the key industry influencers. The data presented is comprehensive, reliable, and a result of extensive research - both primary and secondary. The market research reports provide a complete competitive landscape and an in-depth vendor selection methodology and analysis using qualitative and quantitative research to forecast the accurate market growth.
Table of Contents
1 Executive Summary
- 1.1 Market overview
- Executive Summary - Chart on Market Overview
- Executive Summary - Data Table on Market Overview
- Executive Summary - Chart on Global Market Characteristics
- Executive Summary - Chart on Market By Geographical Landscape
- Executive Summary - Chart on Market Segmentation by End-user
- Executive Summary - Chart on Market Segmentation by Type
- Executive Summary - Chart on Incremental Growth
- Executive Summary - Data Table on Incremental Growth
- Executive Summary - Chart on Company Market Positioning
2 Market Landscape
- 2.1 Market ecosystem
- Parent Market
- Data Table on - Parent Market
- 2.2 Market characteristics
- Market characteristics analysis
- 2.3 Value chain analysis
- Value Chain Analysis
3 Market Sizing
- 3.1 Market definition
- Offerings of companies included in the market definition
- 3.2 Market segment analysis
- Market segments
- 3.3 Market size 2023
- 3.4 Market outlook: Forecast for 2023-2028
- Chart on Global - Market size and forecast 2023-2028 ($ million)
- Data Table on Global - Market size and forecast 2023-2028 ($ million)
- Chart on Global Market: Year-over-year growth 2023-2028 (%)
- Data Table on Global Market: Year-over-year growth 2023-2028 (%)
4 Historic Market Size
- 4.1 Global Tube And Stick Packaging Market 2018 - 2022
- Historic Market Size - Data Table on Global Tube And Stick Packaging Market 2018 - 2022 ($ million)
- 4.2 End-user segment analysis 2018 - 2022
- Historic Market Size - End-user Segment 2018 - 2022 ($ million)
- 4.3 Type segment analysis 2018 - 2022
- Historic Market Size - Type Segment 2018 - 2022 ($ million)
- 4.4 Geography segment analysis 2018 - 2022
- Historic Market Size - Geography Segment 2018 - 2022 ($ million)
- 4.5 Country segment analysis 2018 - 2022
- Historic Market Size - Country Segment 2018 - 2022 ($ million)
5 Five Forces Analysis
- 5.1 Five forces summary
- Five forces analysis - Comparison between 2023 and 2028
- 5.2 Bargaining power of buyers
- Bargaining power of buyers - Impact of key factors 2023 and 2028
- 5.3 Bargaining power of suppliers
- Bargaining power of suppliers - Impact of key factors in 2023 and 2028
- 5.4 Threat of new entrants
- Threat of new entrants - Impact of key factors in 2023 and 2028
- 5.5 Threat of substitutes
- Threat of substitutes - Impact of key factors in 2023 and 2028
- 5.6 Threat of rivalry
- Threat of rivalry - Impact of key factors in 2023 and 2028
- 5.7 Market condition
- Chart on Market condition - Five forces 2023 and 2028
6 Market Segmentation by End-user
- 6.1 Market segments
- Chart on End-user - Market share 2023-2028 (%)
- Data Table on End-user - Market share 2023-2028 (%)
- 6.2 Comparison by End-user
- Chart on Comparison by End-user
- Data Table on Comparison by End-user
- 6.3 Cosmetic and oral care - Market size and forecast 2023-2028
- Chart on Cosmetic and oral care - Market size and forecast 2023-2028 ($ million)
- Data Table on Cosmetic and oral care - Market size and forecast 2023-2028 ($ million)
- Chart on Cosmetic and oral care - Year-over-year growth 2023-2028 (%)
- Data Table on Cosmetic and oral care - Year-over-year growth 2023-2028 (%)
- 6.4 Food and beverages - Market size and forecast 2023-2028
- Chart on Food and beverages - Market size and forecast 2023-2028 ($ million)
- Data Table on Food and beverages - Market size and forecast 2023-2028 ($ million)
- Chart on Food and beverages - Year-over-year growth 2023-2028 (%)
- Data Table on Food and beverages - Year-over-year growth 2023-2028 (%)
- 6.5 Pharmaceuticals - Market size and forecast 2023-2028
- Chart on Pharmaceuticals - Market size and forecast 2023-2028 ($ million)
- Data Table on Pharmaceuticals - Market size and forecast 2023-2028 ($ million)
- Chart on Pharmaceuticals - Year-over-year growth 2023-2028 (%)
- Data Table on Pharmaceuticals - Year-over-year growth 2023-2028 (%)
- 6.6 Others - Market size and forecast 2023-2028
- Chart on Others - Market size and forecast 2023-2028 ($ million)
- Data Table on Others - Market size and forecast 2023-2028 ($ million)
- Chart on Others - Year-over-year growth 2023-2028 (%)
- Data Table on Others - Year-over-year growth 2023-2028 (%)
- 6.7 Market opportunity by End-user
- Market opportunity by End-user ($ million)
- Data Table on Market opportunity by End-user ($ million)
7 Market Segmentation by Type
- 7.1 Market segments
- Chart on Type - Market share 2023-2028 (%)
- Data Table on Type - Market share 2023-2028 (%)
- 7.2 Comparison by Type
- Chart on Comparison by Type
- Data Table on Comparison by Type
- 7.3 Squeeze tubes - Market size and forecast 2023-2028
- Chart on Squeeze tubes - Market size and forecast 2023-2028 ($ million)
- Data Table on Squeeze tubes - Market size and forecast 2023-2028 ($ million)
- Chart on Squeeze tubes - Year-over-year growth 2023-2028 (%)
- Data Table on Squeeze tubes - Year-over-year growth 2023-2028 (%)
- 7.4 Twist tubes - Market size and forecast 2023-2028
- Chart on Twist tubes - Market size and forecast 2023-2028 ($ million)
- Data Table on Twist tubes - Market size and forecast 2023-2028 ($ million)
- Chart on Twist tubes - Year-over-year growth 2023-2028 (%)
- Data Table on Twist tubes - Year-over-year growth 2023-2028 (%)
- 7.5 Cartridge - Market size and forecast 2023-2028
- Chart on Cartridge - Market size and forecast 2023-2028 ($ million)
- Data Table on Cartridge - Market size and forecast 2023-2028 ($ million)
- Chart on Cartridge - Year-over-year growth 2023-2028 (%)
- Data Table on Cartridge - Year-over-year growth 2023-2028 (%)
- 7.6 Others - Market size and forecast 2023-2028
- Chart on Others - Market size and forecast 2023-2028 ($ million)
- Data Table on Others - Market size and forecast 2023-2028 ($ million)
- Chart on Others - Year-over-year growth 2023-2028 (%)
- Data Table on Others - Year-over-year growth 2023-2028 (%)
- 7.7 Market opportunity by Type
- Market opportunity by Type ($ million)
- Data Table on Market opportunity by Type ($ million)
8 Customer Landscape
- 8.1 Customer landscape overview
- Analysis of price sensitivity, lifecycle, customer purchase basket, adoption rates, and purchase criteria
9 Geographic Landscape
- 9.1 Geographic segmentation
- Chart on Market share By Geographical Landscape 2023-2028 (%)
- Data Table on Market share By Geographical Landscape 2023-2028 (%)
- 9.2 Geographic comparison
- Chart on Geographic comparison
- Data Table on Geographic comparison
- 9.3 APAC - Market size and forecast 2023-2028
- Chart on APAC - Market size and forecast 2023-2028 ($ million)
- Data Table on APAC - Market size and forecast 2023-2028 ($ million)
- Chart on APAC - Year-over-year growth 2023-2028 (%)
- Data Table on APAC - Year-over-year growth 2023-2028 (%)
- 9.4 North America - Market size and forecast 2023-2028
- Chart on North America - Market size and forecast 2023-2028 ($ million)
- Data Table on North America - Market size and forecast 2023-2028 ($ million)
- Chart on North America - Year-over-year growth 2023-2028 (%)
- Data Table on North America - Year-over-year growth 2023-2028 (%)
- 9.5 Europe - Market size and forecast 2023-2028
- Chart on Europe - Market size and forecast 2023-2028 ($ million)
- Data Table on Europe - Market size and forecast 2023-2028 ($ million)
- Chart on Europe - Year-over-year growth 2023-2028 (%)
- Data Table on Europe - Year-over-year growth 2023-2028 (%)
- 9.6 Middle East and Africa - Market size and forecast 2023-2028
- Chart on Middle East and Africa - Market size and forecast 2023-2028 ($ million)
- Data Table on Middle East and Africa - Market size and forecast 2023-2028 ($ million)
- Chart on Middle East and Africa - Year-over-year growth 2023-2028 (%)
- Data Table on Middle East and Africa - Year-over-year growth 2023-2028 (%)
- 9.7 South America - Market size and forecast 2023-2028
- Chart on South America - Market size and forecast 2023-2028 ($ million)
- Data Table on South America - Market size and forecast 2023-2028 ($ million)
- Chart on South America - Year-over-year growth 2023-2028 (%)
- Data Table on South America - Year-over-year growth 2023-2028 (%)
- 9.8 US - Market size and forecast 2023-2028
- Chart on US - Market size and forecast 2023-2028 ($ million)
- Data Table on US - Market size and forecast 2023-2028 ($ million)
- Chart on US - Year-over-year growth 2023-2028 (%)
- Data Table on US - Year-over-year growth 2023-2028 (%)
- 9.9 China - Market size and forecast 2023-2028
- Chart on China - Market size and forecast 2023-2028 ($ million)
- Data Table on China - Market size and forecast 2023-2028 ($ million)
- Chart on China - Year-over-year growth 2023-2028 (%)
- Data Table on China - Year-over-year growth 2023-2028 (%)
- 9.10 Germany - Market size and forecast 2023-2028
- Chart on Germany - Market size and forecast 2023-2028 ($ million)
- Data Table on Germany - Market size and forecast 2023-2028 ($ million)
- Chart on Germany - Year-over-year growth 2023-2028 (%)
- Data Table on Germany - Year-over-year growth 2023-2028 (%)
- 9.11 UK - Market size and forecast 2023-2028
- Chart on UK - Market size and forecast 2023-2028 ($ million)
- Data Table on UK - Market size and forecast 2023-2028 ($ million)
- Chart on UK - Year-over-year growth 2023-2028 (%)
- Data Table on UK - Year-over-year growth 2023-2028 (%)
- 9.12 Japan - Market size and forecast 2023-2028
- Chart on Japan - Market size and forecast 2023-2028 ($ million)
- Data Table on Japan - Market size and forecast 2023-2028 ($ million)
- Chart on Japan - Year-over-year growth 2023-2028 (%)
- Data Table on Japan - Year-over-year growth 2023-2028 (%)
- 9.13 Market opportunity By Geographical Landscape
- Market opportunity By Geographical Landscape ($ million)
- Data Tables on Market opportunity By Geographical Landscape ($ million)
10 Drivers, Challenges, and Opportunity/Restraints
- 10.1 Market drivers
- 10.2 Market challenges
- 10.3 Impact of drivers and challenges
- Impact of drivers and challenges in 2023 and 2028
- 10.4 Market opportunities/restraints
11 Competitive Landscape
- 11.1 Overview
- 11.2 Competitive Landscape
- Overview on criticality of inputs and factors of differentiation
- 11.3 Landscape disruption
- Overview on factors of disruption
- 11.4 Industry risks
- Impact of key risks on business
12 Competitive Analysis
- 12.1 Companies profiled
- Companies covered
- 12.2 Market positioning of companies
- Matrix on companies position and classification
- 12.3 Amcor Plc
- Amcor Plc - Overview
- Amcor Plc - Business segments
- Amcor Plc - Key news
- Amcor Plc - Key offerings
- Amcor Plc - Segment focus
- 12.4 ARANOW Packaging Machinery SL
- ARANOW Packaging Machinery SL - Overview
- ARANOW Packaging Machinery SL - Product / Service
- ARANOW Packaging Machinery SL - Key offerings
- 12.5 Armbrust Paper Tubes Inc.
- Armbrust Paper Tubes Inc. - Overview
- Armbrust Paper Tubes Inc. - Product / Service
- Armbrust Paper Tubes Inc. - Key offerings
- 12.6 Berry Global Inc.
- Berry Global Inc. - Overview
- Berry Global Inc. - Business segments
- Berry Global Inc. - Key news
- Berry Global Inc. - Key offerings
- Berry Global Inc. - Segment focus
- 12.7 CCL Industries Inc.
- CCL Industries Inc. - Overview
- CCL Industries Inc. - Business segments
- CCL Industries Inc. - Key news
- CCL Industries Inc. - Key offerings
- CCL Industries Inc. - Segment focus
- 12.8 Clariant International Ltd.
- Clariant International Ltd. - Overview
- Clariant International Ltd. - Business segments
- Clariant International Ltd. - Key news
- Clariant International Ltd. - Key offerings
- Clariant International Ltd. - Segment focus
- 12.9 Constantia Flexibles Group GmbH
- Constantia Flexibles Group GmbH - Overview
- Constantia Flexibles Group GmbH - Product / Service
- Constantia Flexibles Group GmbH - Key news
- Constantia Flexibles Group GmbH - Key offerings
- 12.10 EPL Ltd.
- EPL Ltd. - Overview
- EPL Ltd. - Business segments
- EPL Ltd. - Key offerings
- EPL Ltd. - Segment focus
- 12.11 Hoffmann Neopac AG
- Hoffmann Neopac AG - Overview
- Hoffmann Neopac AG - Product / Service
- Hoffmann Neopac AG - Key offerings
- 12.12 Huhtamaki Oyj
- Huhtamaki Oyj - Overview
- Huhtamaki Oyj - Business segments
- Huhtamaki Oyj - Key news
- Huhtamaki Oyj - Key offerings
- Huhtamaki Oyj - Segment focus
- 12.13 Mondi Plc
- Mondi Plc - Overview
- Mondi Plc - Business segments
- Mondi Plc - Key news
- Mondi Plc - Key offerings
- Mondi Plc - Segment focus
- 12.14 Plastube
- Plastube - Overview
- Plastube - Product / Service
- Plastube - Key offerings
- 12.15 Precision Concepts International
- Precision Concepts International - Overview
- Precision Concepts International - Product / Service
- Precision Concepts International - Key offerings
- 12.16 Sinclair and Rush Inc.
- Sinclair and Rush Inc. - Overview
- Sinclair and Rush Inc. - Product / Service
- Sinclair and Rush Inc. - Key offerings
- 12.17 The Estee Lauder Companies Inc.
- The Estee Lauder Companies Inc. - Overview
- The Estee Lauder Companies Inc. - Product / Service
- The Estee Lauder Companies Inc. - Key news
- The Estee Lauder Companies Inc. - Key offerings
13 Appendix
- 13.1 Scope of the report
- 13.2 Inclusions and exclusions checklist
- Inclusions checklist
- Exclusions checklist
- 13.3 Currency conversion rates for US$
- Currency conversion rates for US$
- 13.4 Research methodology
- Research methodology
- 13.5 Data procurement
- Information sources
- 13.6 Data validation
- Data validation
- 13.7 Validation techniques employed for market sizing
- Validation techniques employed for market sizing
- 13.8 Data synthesis
- Data synthesis
- 13.9 360 degree market analysis
- 360 degree market analysis
- 13.10 List of abbreviations
- List of abbreviations

