|
|
市場調査レポート
商品コード
1525090
スポーツ医学の世界市場 2024-2028Global sports medicine market 2024-2028 |
||||||

|
|||||||
カスタマイズ可能
|
|||||||

| スポーツ医学の世界市場 2024-2028 |
|
出版日: 2024年07月12日
発行: TechNavio
ページ情報: 英文 164 Pages
納期: 即納可能
|

全表示
- 概要
- 図表
- 目次
スポーツ医学市場は2023-2028年に29億6,880万米ドル、予測期間中のCAGRは6.78%で成長すると予測されます。
当レポートでは、スポーツ医学市場の全体的な分析、市場規模・予測、動向、成長促進要因、課題、約25のベンダーを網羅したベンダー分析などを掲載しています。
現在の市場シナリオ、最新動向と促進要因、市場環境全体に関する最新分析を提供しています。市場は、スポーツ傷害の発生率の増加、新製品や治療方法の流入の増加、オンライン医療製品の採用増加によって牽引されています。
| 市場範囲 | |
|---|---|
| 基準年 | 2024 |
| 終了年 | 2028 |
| 予測期間 | 2024-2028 |
| 成長モメンタム | 加速 |
| 前年比2024年 | 6.23% |
| CAGR | 6.78% |
| 増分額 | 29億6,880万米ドル |
本調査では、今後数年間のスポーツ医学市場成長を牽引する主要因の1つとして、低侵襲手術の需要増加を挙げています。また、再生医療の市場開発や3Dプリントインプラントの採用増加も市場の大きな需要につながります。
目次
第1章 エグゼクティブサマリー
- 市場概要
第2章 市場情勢
- 市場エコシステム
- 市場の特徴
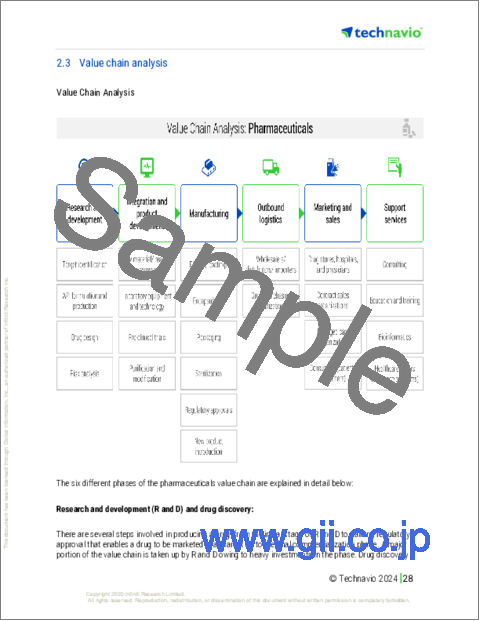
- バリューチェーン分析
第3章 市場規模の評価
- 市場の定義
- 市場セグメント分析
- 市場規模 2023
- 市場の見通し 2023-2028
第4章 市場規模実績
- 世界スポーツ医学市場 2018-2022
- 用途別セグメント分析 2018-2022
- 製品別セグメント分析 2018-2022
- 地域別セグメント分析 2018-2022
- 国別セグメント分析 2018-2022
第5章 ファイブフォース分析
- ファイブフォースの要約
- 買い手の交渉力
- 供給企業の交渉力
- 新規参入業者の脅威
- 代替品の脅威
- 競争の脅威
- 市況
第6章 市場セグメンテーション:用途別
- 市場セグメンテーション
- 比較:用途別
- 膝の治療:市場規模と予測 2023-2028
- 股関節治療:市場規模と予測 2023-2028
- 肩の治療:市場規模と予測 2023-2028
- 脊椎治療:市場規模と予測 2023-2028
- その他:市場規模と予測 2023-2028
- 市場機会:用途別
第7章 市場セグメンテーション:製品別
- 市場セグメンテーション
- 比較:製品別
- 再建製品:市場規模と予測 2023-2028
- サポート・回復製品:市場規模と予測 2023-2028
- アクセサリー:市場規模と予測 2023-2028
- 市場機会:製品別
第8章 顧客情勢
- 顧客情勢の概要
第9章 地域別情勢
- 地域別セグメンテーション
- 地域別比較
- 北米:市場規模と予測 2023-2028
- 欧州:市場規模と予測 2023-2028
- アジア:市場規模と予測 2023-2028
- 世界のその他の地域:市場規模と予測 2023-2028
- 米国:市場規模と予測 2023-2028
- ドイツ:市場規模と予測 2023-2028
- カナダ:市場規模と予測 2023-2028
- 中国:市場規模と予測 2023-2028
- フランス:市場規模と予測 2023-2028
- 市場機会:地域情勢別
第10章 促進要因・課題・機会・抑制要因
- 市場促進要因
- 市場の課題
- 促進要因と課題の影響
- 市場の機会・抑制要因
第11章 競合情勢
- 概要
- 競合情勢
- 混乱の状況
- 業界のリスク
第12章 競合分析
- 企業プロファイル
- 企業の市場ポジショニング
- Alimed Inc.
- Arthrex Inc.
- Breg Inc.
- Conmed Corp.
- Core Products International Inc.
- DJO Global Inc.
- Johnson and Johnson Services Inc.
- medi GmbH and Co. KG
- Medtronic Plc
- Mueller Sports Medicine Inc.
- Ossur hf
- Smith and Nephew plc
- Stryker Corp.
- ThermoTek Inc.
- Zimmer Biomet Holdings Inc.
第13章 付録
Exhibits:
- Exhibits1: Executive Summary - Chart on Market Overview
- Exhibits2: Executive Summary - Data Table on Market Overview
- Exhibits3: Executive Summary - Chart on Global Market Characteristics
- Exhibits4: Executive Summary - Chart on Market By Geographical Landscape
- Exhibits5: Executive Summary - Chart on Market Segmentation by Application
- Exhibits6: Executive Summary - Chart on Market Segmentation by Product
- Exhibits7: Executive Summary - Chart on Incremental Growth
- Exhibits8: Executive Summary - Data Table on Incremental Growth
- Exhibits9: Executive Summary - Chart on Company Market Positioning
- Exhibits10: Parent Market
- Exhibits11: Data Table on - Parent Market
- Exhibits12: Market characteristics analysis
- Exhibits13: Value Chain Analysis
- Exhibits14: Offerings of companies included in the market definition
- Exhibits15: Market segments
- Exhibits16: Chart on Global - Market size and forecast 2023-2028 ($ million)
- Exhibits17: Data Table on Global - Market size and forecast 2023-2028 ($ million)
- Exhibits18: Chart on Global Market: Year-over-year growth 2023-2028 (%)
- Exhibits19: Data Table on Global Market: Year-over-year growth 2023-2028 (%)
- Exhibits20: Historic Market Size - Data Table on Global Sports Medicine Market 2018 - 2022 ($ million)
- Exhibits21: Historic Market Size - Application Segment 2018 - 2022 ($ million)
- Exhibits22: Historic Market Size - Product Segment 2018 - 2022 ($ million)
- Exhibits23: Historic Market Size - Geography Segment 2018 - 2022 ($ million)
- Exhibits24: Historic Market Size - Country Segment 2018 - 2022 ($ million)
- Exhibits25: Five forces analysis - Comparison between 2023 and 2028
- Exhibits26: Bargaining power of buyers - Impact of key factors 2023 and 2028
- Exhibits27: Bargaining power of suppliers - Impact of key factors in 2023 and 2028
- Exhibits28: Threat of new entrants - Impact of key factors in 2023 and 2028
- Exhibits29: Threat of substitutes - Impact of key factors in 2023 and 2028
- Exhibits30: Threat of rivalry - Impact of key factors in 2023 and 2028
- Exhibits31: Chart on Market condition - Five forces 2023 and 2028
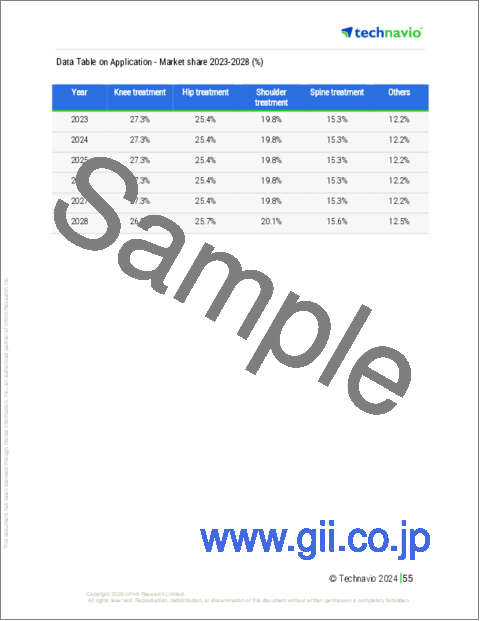
- Exhibits32: Chart on Application - Market share 2023-2028 (%)
- Exhibits33: Data Table on Application - Market share 2023-2028 (%)
- Exhibits34: Chart on Comparison by Application
- Exhibits35: Data Table on Comparison by Application
- Exhibits36: Chart on Knee treatment - Market size and forecast 2023-2028 ($ million)
- Exhibits37: Data Table on Knee treatment - Market size and forecast 2023-2028 ($ million)
- Exhibits38: Chart on Knee treatment - Year-over-year growth 2023-2028 (%)
- Exhibits39: Data Table on Knee treatment - Year-over-year growth 2023-2028 (%)
- Exhibits40: Chart on Hip treatment - Market size and forecast 2023-2028 ($ million)
- Exhibits41: Data Table on Hip treatment - Market size and forecast 2023-2028 ($ million)
- Exhibits42: Chart on Hip treatment - Year-over-year growth 2023-2028 (%)
- Exhibits43: Data Table on Hip treatment - Year-over-year growth 2023-2028 (%)
- Exhibits44: Chart on Shoulder treatment - Market size and forecast 2023-2028 ($ million)
- Exhibits45: Data Table on Shoulder treatment - Market size and forecast 2023-2028 ($ million)
- Exhibits46: Chart on Shoulder treatment - Year-over-year growth 2023-2028 (%)
- Exhibits47: Data Table on Shoulder treatment - Year-over-year growth 2023-2028 (%)
- Exhibits48: Chart on Spine treatment - Market size and forecast 2023-2028 ($ million)
- Exhibits49: Data Table on Spine treatment - Market size and forecast 2023-2028 ($ million)
- Exhibits50: Chart on Spine treatment - Year-over-year growth 2023-2028 (%)
- Exhibits51: Data Table on Spine treatment - Year-over-year growth 2023-2028 (%)
- Exhibits52: Chart on Others - Market size and forecast 2023-2028 ($ million)
- Exhibits53: Data Table on Others - Market size and forecast 2023-2028 ($ million)
- Exhibits54: Chart on Others - Year-over-year growth 2023-2028 (%)
- Exhibits55: Data Table on Others - Year-over-year growth 2023-2028 (%)
- Exhibits56: Market opportunity by Application ($ million)
- Exhibits57: Data Table on Market opportunity by Application ($ million)
- Exhibits58: Chart on Product - Market share 2023-2028 (%)
- Exhibits59: Data Table on Product - Market share 2023-2028 (%)
- Exhibits60: Chart on Comparison by Product
- Exhibits61: Data Table on Comparison by Product
- Exhibits62: Chart on Reconstructive products - Market size and forecast 2023-2028 ($ million)
- Exhibits63: Data Table on Reconstructive products - Market size and forecast 2023-2028 ($ million)
- Exhibits64: Chart on Reconstructive products - Year-over-year growth 2023-2028 (%)
- Exhibits65: Data Table on Reconstructive products - Year-over-year growth 2023-2028 (%)
- Exhibits66: Chart on Support and recovery products - Market size and forecast 2023-2028 ($ million)
- Exhibits67: Data Table on Support and recovery products - Market size and forecast 2023-2028 ($ million)
- Exhibits68: Chart on Support and recovery products - Year-over-year growth 2023-2028 (%)
- Exhibits69: Data Table on Support and recovery products - Year-over-year growth 2023-2028 (%)
- Exhibits70: Chart on Accessories - Market size and forecast 2023-2028 ($ million)
- Exhibits71: Data Table on Accessories - Market size and forecast 2023-2028 ($ million)
- Exhibits72: Chart on Accessories - Year-over-year growth 2023-2028 (%)
- Exhibits73: Data Table on Accessories - Year-over-year growth 2023-2028 (%)
- Exhibits74: Market opportunity by Product ($ million)
- Exhibits75: Data Table on Market opportunity by Product ($ million)
- Exhibits76: Analysis of price sensitivity, lifecycle, customer purchase basket, adoption rates, and purchase criteria
- Exhibits77: Chart on Market share By Geographical Landscape 2023-2028 (%)
- Exhibits78: Data Table on Market share By Geographical Landscape 2023-2028 (%)
- Exhibits79: Chart on Geographic comparison
- Exhibits80: Data Table on Geographic comparison
- Exhibits81: Chart on North America - Market size and forecast 2023-2028 ($ million)
- Exhibits82: Data Table on North America - Market size and forecast 2023-2028 ($ million)
- Exhibits83: Chart on North America - Year-over-year growth 2023-2028 (%)
- Exhibits84: Data Table on North America - Year-over-year growth 2023-2028 (%)
- Exhibits85: Chart on Europe - Market size and forecast 2023-2028 ($ million)
- Exhibits86: Data Table on Europe - Market size and forecast 2023-2028 ($ million)
- Exhibits87: Chart on Europe - Year-over-year growth 2023-2028 (%)
- Exhibits88: Data Table on Europe - Year-over-year growth 2023-2028 (%)
- Exhibits89: Chart on Asia - Market size and forecast 2023-2028 ($ million)
- Exhibits90: Data Table on Asia - Market size and forecast 2023-2028 ($ million)
- Exhibits91: Chart on Asia - Year-over-year growth 2023-2028 (%)
- Exhibits92: Data Table on Asia - Year-over-year growth 2023-2028 (%)
- Exhibits93: Chart on Rest of World (ROW) - Market size and forecast 2023-2028 ($ million)
- Exhibits94: Data Table on Rest of World (ROW) - Market size and forecast 2023-2028 ($ million)
- Exhibits95: Chart on Rest of World (ROW) - Year-over-year growth 2023-2028 (%)
- Exhibits96: Data Table on Rest of World (ROW) - Year-over-year growth 2023-2028 (%)
- Exhibits97: Chart on US - Market size and forecast 2023-2028 ($ million)
- Exhibits98: Data Table on US - Market size and forecast 2023-2028 ($ million)
- Exhibits99: Chart on US - Year-over-year growth 2023-2028 (%)
- Exhibits100: Data Table on US - Year-over-year growth 2023-2028 (%)
- Exhibits101: Chart on Germany - Market size and forecast 2023-2028 ($ million)
- Exhibits102: Data Table on Germany - Market size and forecast 2023-2028 ($ million)
- Exhibits103: Chart on Germany - Year-over-year growth 2023-2028 (%)
- Exhibits104: Data Table on Germany - Year-over-year growth 2023-2028 (%)
- Exhibits105: Chart on Canada - Market size and forecast 2023-2028 ($ million)
- Exhibits106: Data Table on Canada - Market size and forecast 2023-2028 ($ million)
- Exhibits107: Chart on Canada - Year-over-year growth 2023-2028 (%)
- Exhibits108: Data Table on Canada - Year-over-year growth 2023-2028 (%)
- Exhibits109: Chart on China - Market size and forecast 2023-2028 ($ million)
- Exhibits110: Data Table on China - Market size and forecast 2023-2028 ($ million)
- Exhibits111: Chart on China - Year-over-year growth 2023-2028 (%)
- Exhibits112: Data Table on China - Year-over-year growth 2023-2028 (%)
- Exhibits113: Chart on France - Market size and forecast 2023-2028 ($ million)
- Exhibits114: Data Table on France - Market size and forecast 2023-2028 ($ million)
- Exhibits115: Chart on France - Year-over-year growth 2023-2028 (%)
- Exhibits116: Data Table on France - Year-over-year growth 2023-2028 (%)
- Exhibits117: Market opportunity By Geographical Landscape ($ million)
- Exhibits118: Data Tables on Market opportunity By Geographical Landscape ($ million)
- Exhibits119: Impact of drivers and challenges in 2023 and 2028
- Exhibits120: Overview on criticality of inputs and factors of differentiation
- Exhibits121: Overview on factors of disruption
- Exhibits122: Impact of key risks on business
- Exhibits123: Companies covered
- Exhibits124: Matrix on companies position and classification
- Exhibits125: Alimed Inc. - Overview
- Exhibits126: Alimed Inc. - Product / Service
- Exhibits127: Alimed Inc. - Key offerings
- Exhibits128: Arthrex Inc. - Overview
- Exhibits129: Arthrex Inc. - Product / Service
- Exhibits130: Arthrex Inc. - Key offerings
- Exhibits131: Breg Inc. - Overview
- Exhibits132: Breg Inc. - Product / Service
- Exhibits133: Breg Inc. - Key offerings
- Exhibits134: Conmed Corp. - Overview
- Exhibits135: Conmed Corp. - Business segments
- Exhibits136: Conmed Corp. - Key offerings
- Exhibits137: Conmed Corp. - Segment focus
- Exhibits138: Core Products International Inc. - Overview
- Exhibits139: Core Products International Inc. - Product / Service
- Exhibits140: Core Products International Inc. - Key offerings
- Exhibits141: DJO Global Inc. - Overview
- Exhibits142: DJO Global Inc. - Product / Service
- Exhibits143: DJO Global Inc. - Key offerings
- Exhibits144: Johnson and Johnson Services Inc. - Overview
- Exhibits145: Johnson and Johnson Services Inc. - Business segments
- Exhibits146: Johnson and Johnson Services Inc. - Key news
- Exhibits147: Johnson and Johnson Services Inc. - Key offerings
- Exhibits148: Johnson and Johnson Services Inc. - Segment focus
- Exhibits149: medi GmbH and Co. KG - Overview
- Exhibits150: medi GmbH and Co. KG - Product / Service
- Exhibits151: medi GmbH and Co. KG - Key offerings
- Exhibits152: Medtronic Plc - Overview
- Exhibits153: Medtronic Plc - Business segments
- Exhibits154: Medtronic Plc - Key news
- Exhibits155: Medtronic Plc - Key offerings
- Exhibits156: Medtronic Plc - Segment focus
- Exhibits157: Mueller Sports Medicine Inc. - Overview
- Exhibits158: Mueller Sports Medicine Inc. - Product / Service
- Exhibits159: Mueller Sports Medicine Inc. - Key offerings
- Exhibits160: Ossur hf - Overview
- Exhibits161: Ossur hf - Business segments
- Exhibits162: Ossur hf - Key offerings
- Exhibits163: Ossur hf - Segment focus
- Exhibits164: Smith and Nephew plc - Overview
- Exhibits165: Smith and Nephew plc - Business segments
- Exhibits166: Smith and Nephew plc - Key news
- Exhibits167: Smith and Nephew plc - Key offerings
- Exhibits168: Smith and Nephew plc - Segment focus
- Exhibits169: Stryker Corp. - Overview
- Exhibits170: Stryker Corp. - Business segments
- Exhibits171: Stryker Corp. - Key news
- Exhibits172: Stryker Corp. - Key offerings
- Exhibits173: Stryker Corp. - Segment focus
- Exhibits174: ThermoTek Inc. - Overview
- Exhibits175: ThermoTek Inc. - Product / Service
- Exhibits176: ThermoTek Inc. - Key offerings
- Exhibits177: Zimmer Biomet Holdings Inc. - Overview
- Exhibits178: Zimmer Biomet Holdings Inc. - Business segments
- Exhibits179: Zimmer Biomet Holdings Inc. - Key news
- Exhibits180: Zimmer Biomet Holdings Inc. - Key offerings
- Exhibits181: Zimmer Biomet Holdings Inc. - Segment focus
- Exhibits182: Inclusions checklist
- Exhibits183: Exclusions checklist
- Exhibits184: Currency conversion rates for US$
- Exhibits185: Research methodology
- Exhibits186: Information sources
- Exhibits187: Data validation
- Exhibits188: Validation techniques employed for market sizing
- Exhibits189: Data synthesis
- Exhibits190: 360 degree market analysis
- Exhibits191: List of abbreviations
The sports medicine market is forecasted to grow by USD 2968.8 mn during 2023-2028, accelerating at a CAGR of 6.78% during the forecast period. The report on the sports medicine market provides a holistic analysis, market size and forecast, trends, growth drivers, and challenges, as well as vendor analysis covering around 25 vendors.
The report offers an up-to-date analysis regarding the current market scenario, the latest trends and drivers, and the overall market environment. The market is driven by increasing incidence of sports injuries, rise in influx of new products and treatment modalities, and increase in adoption of online medical products.
Technavio's sports medicine market is segmented as below:
| Market Scope | |
|---|---|
| Base Year | 2024 |
| End Year | 2028 |
| Series Year | 2024-2028 |
| Growth Momentum | Accelerate |
| YOY 2024 | 6.23% |
| CAGR | 6.78% |
| Incremental Value | $2968.8mn |
By Application
- Knee treatment
- Hip treatment
- Shoulder treatment
- Spine treatment
- Others
By Product
- Reconstructive products
- Support and recovery products
- Accessories
By Geographical Landscape
- North America
- Europe
- Asia
- Rest of World (ROW)
This study identifies the rise in demand for minimally invasive surgeries as one of the prime reasons driving the sports medicine market growth during the next few years. Also, developments in regenerative medicine and rise in adoption of 3D printed implants will lead to sizable demand in the market.
The report on the sports medicine market covers the following areas:
- Sports medicine market sizing
- Sports medicine market forecast
- Sports medicine market industry analysis
The robust vendor analysis is designed to help clients improve their market position, and in line with this, this report provides a detailed analysis of several leading sports medicine market vendors that include Alimed Inc., Arthrex Inc., Bauerfeind AG, Breg Inc., Conmed Corp., Core Products International Inc., DJO Global Inc., Johnson and Johnson Services Inc., KARL STORZ SE and Co. KG, Kinex Medical Co. LLC, medi GmbH and Co. KG, Medtronic PLC, Mueller Sports Medicine Inc., Ossur hf, Ottobock SE and Co. KGaA, Performance Health Holding Inc., Smith and Nephew PLC, Stryker Corp., ThermoTek Inc., and Zimmer Biomet Holdings Inc.. Also, the sports medicine market analysis report includes information on upcoming trends and challenges that will influence market growth. This is to help companies strategize and leverage all forthcoming growth opportunities.
The study was conducted using an objective combination of primary and secondary information including inputs from key participants in the industry. The report contains a comprehensive market and vendor landscape in addition to an analysis of the key vendors.
The publisher presents a detailed picture of the market by the way of study, synthesis, and summation of data from multiple sources by an analysis of key parameters such as profit, pricing, competition, and promotions. It presents various market facets by identifying the key industry influencers. The data presented is comprehensive, reliable, and a result of extensive research - both primary and secondary. The market research reports provide a complete competitive landscape and an in-depth vendor selection methodology and analysis using qualitative and quantitative research to forecast the accurate market growth.
Table of Contents
1 Executive Summary
- 1.1 Market overview
- Executive Summary - Chart on Market Overview
- Executive Summary - Data Table on Market Overview
- Executive Summary - Chart on Global Market Characteristics
- Executive Summary - Chart on Market By Geographical Landscape
- Executive Summary - Chart on Market Segmentation by Application
- Executive Summary - Chart on Market Segmentation by Product
- Executive Summary - Chart on Incremental Growth
- Executive Summary - Data Table on Incremental Growth
- Executive Summary - Chart on Company Market Positioning
2 Market Landscape
- 2.1 Market ecosystem
- Parent Market
- Data Table on - Parent Market
- 2.2 Market characteristics
- Market characteristics analysis
- 2.3 Value chain analysis
- Value Chain Analysis
3 Market Sizing
- 3.1 Market definition
- Offerings of companies included in the market definition
- 3.2 Market segment analysis
- Market segments
- 3.3 Market size 2023
- 3.4 Market outlook: Forecast for 2023-2028
- Chart on Global - Market size and forecast 2023-2028 ($ million)
- Data Table on Global - Market size and forecast 2023-2028 ($ million)
- Chart on Global Market: Year-over-year growth 2023-2028 (%)
- Data Table on Global Market: Year-over-year growth 2023-2028 (%)
4 Historic Market Size
- 4.1 Global Sports Medicine Market 2018 - 2022
- Historic Market Size - Data Table on Global Sports Medicine Market 2018 - 2022 ($ million)
- 4.2 Application segment analysis 2018 - 2022
- Historic Market Size - Application Segment 2018 - 2022 ($ million)
- 4.3 Product segment analysis 2018 - 2022
- Historic Market Size - Product Segment 2018 - 2022 ($ million)
- 4.4 Geography segment analysis 2018 - 2022
- Historic Market Size - Geography Segment 2018 - 2022 ($ million)
- 4.5 Country segment analysis 2018 - 2022
- Historic Market Size - Country Segment 2018 - 2022 ($ million)
5 Five Forces Analysis
- 5.1 Five forces summary
- Five forces analysis - Comparison between 2023 and 2028
- 5.2 Bargaining power of buyers
- Bargaining power of buyers - Impact of key factors 2023 and 2028
- 5.3 Bargaining power of suppliers
- Bargaining power of suppliers - Impact of key factors in 2023 and 2028
- 5.4 Threat of new entrants
- Threat of new entrants - Impact of key factors in 2023 and 2028
- 5.5 Threat of substitutes
- Threat of substitutes - Impact of key factors in 2023 and 2028
- 5.6 Threat of rivalry
- Threat of rivalry - Impact of key factors in 2023 and 2028
- 5.7 Market condition
- Chart on Market condition - Five forces 2023 and 2028
6 Market Segmentation by Application
- 6.1 Market segments
- Chart on Application - Market share 2023-2028 (%)
- Data Table on Application - Market share 2023-2028 (%)
- 6.2 Comparison by Application
- Chart on Comparison by Application
- Data Table on Comparison by Application
- 6.3 Knee treatment - Market size and forecast 2023-2028
- Chart on Knee treatment - Market size and forecast 2023-2028 ($ million)
- Data Table on Knee treatment - Market size and forecast 2023-2028 ($ million)
- Chart on Knee treatment - Year-over-year growth 2023-2028 (%)
- Data Table on Knee treatment - Year-over-year growth 2023-2028 (%)
- 6.4 Hip treatment - Market size and forecast 2023-2028
- Chart on Hip treatment - Market size and forecast 2023-2028 ($ million)
- Data Table on Hip treatment - Market size and forecast 2023-2028 ($ million)
- Chart on Hip treatment - Year-over-year growth 2023-2028 (%)
- Data Table on Hip treatment - Year-over-year growth 2023-2028 (%)
- 6.5 Shoulder treatment - Market size and forecast 2023-2028
- Chart on Shoulder treatment - Market size and forecast 2023-2028 ($ million)
- Data Table on Shoulder treatment - Market size and forecast 2023-2028 ($ million)
- Chart on Shoulder treatment - Year-over-year growth 2023-2028 (%)
- Data Table on Shoulder treatment - Year-over-year growth 2023-2028 (%)
- 6.6 Spine treatment - Market size and forecast 2023-2028
- Chart on Spine treatment - Market size and forecast 2023-2028 ($ million)
- Data Table on Spine treatment - Market size and forecast 2023-2028 ($ million)
- Chart on Spine treatment - Year-over-year growth 2023-2028 (%)
- Data Table on Spine treatment - Year-over-year growth 2023-2028 (%)
- 6.7 Others - Market size and forecast 2023-2028
- Chart on Others - Market size and forecast 2023-2028 ($ million)
- Data Table on Others - Market size and forecast 2023-2028 ($ million)
- Chart on Others - Year-over-year growth 2023-2028 (%)
- Data Table on Others - Year-over-year growth 2023-2028 (%)
- 6.8 Market opportunity by Application
- Market opportunity by Application ($ million)
- Data Table on Market opportunity by Application ($ million)
7 Market Segmentation by Product
- 7.1 Market segments
- Chart on Product - Market share 2023-2028 (%)
- Data Table on Product - Market share 2023-2028 (%)
- 7.2 Comparison by Product
- Chart on Comparison by Product
- Data Table on Comparison by Product
- 7.3 Reconstructive products - Market size and forecast 2023-2028
- Chart on Reconstructive products - Market size and forecast 2023-2028 ($ million)
- Data Table on Reconstructive products - Market size and forecast 2023-2028 ($ million)
- Chart on Reconstructive products - Year-over-year growth 2023-2028 (%)
- Data Table on Reconstructive products - Year-over-year growth 2023-2028 (%)
- 7.4 Support and recovery products - Market size and forecast 2023-2028
- Chart on Support and recovery products - Market size and forecast 2023-2028 ($ million)
- Data Table on Support and recovery products - Market size and forecast 2023-2028 ($ million)
- Chart on Support and recovery products - Year-over-year growth 2023-2028 (%)
- Data Table on Support and recovery products - Year-over-year growth 2023-2028 (%)
- 7.5 Accessories - Market size and forecast 2023-2028
- Chart on Accessories - Market size and forecast 2023-2028 ($ million)
- Data Table on Accessories - Market size and forecast 2023-2028 ($ million)
- Chart on Accessories - Year-over-year growth 2023-2028 (%)
- Data Table on Accessories - Year-over-year growth 2023-2028 (%)
- 7.6 Market opportunity by Product
- Market opportunity by Product ($ million)
- Data Table on Market opportunity by Product ($ million)
8 Customer Landscape
- 8.1 Customer landscape overview
- Analysis of price sensitivity, lifecycle, customer purchase basket, adoption rates, and purchase criteria
9 Geographic Landscape
- 9.1 Geographic segmentation
- Chart on Market share By Geographical Landscape 2023-2028 (%)
- Data Table on Market share By Geographical Landscape 2023-2028 (%)
- 9.2 Geographic comparison
- Chart on Geographic comparison
- Data Table on Geographic comparison
- 9.3 North America - Market size and forecast 2023-2028
- Chart on North America - Market size and forecast 2023-2028 ($ million)
- Data Table on North America - Market size and forecast 2023-2028 ($ million)
- Chart on North America - Year-over-year growth 2023-2028 (%)
- Data Table on North America - Year-over-year growth 2023-2028 (%)
- 9.4 Europe - Market size and forecast 2023-2028
- Chart on Europe - Market size and forecast 2023-2028 ($ million)
- Data Table on Europe - Market size and forecast 2023-2028 ($ million)
- Chart on Europe - Year-over-year growth 2023-2028 (%)
- Data Table on Europe - Year-over-year growth 2023-2028 (%)
- 9.5 Asia - Market size and forecast 2023-2028
- Chart on Asia - Market size and forecast 2023-2028 ($ million)
- Data Table on Asia - Market size and forecast 2023-2028 ($ million)
- Chart on Asia - Year-over-year growth 2023-2028 (%)
- Data Table on Asia - Year-over-year growth 2023-2028 (%)
- 9.6 Rest of World (ROW) - Market size and forecast 2023-2028
- Chart on Rest of World (ROW) - Market size and forecast 2023-2028 ($ million)
- Data Table on Rest of World (ROW) - Market size and forecast 2023-2028 ($ million)
- Chart on Rest of World (ROW) - Year-over-year growth 2023-2028 (%)
- Data Table on Rest of World (ROW) - Year-over-year growth 2023-2028 (%)
- 9.7 US - Market size and forecast 2023-2028
- Chart on US - Market size and forecast 2023-2028 ($ million)
- Data Table on US - Market size and forecast 2023-2028 ($ million)
- Chart on US - Year-over-year growth 2023-2028 (%)
- Data Table on US - Year-over-year growth 2023-2028 (%)
- 9.8 Germany - Market size and forecast 2023-2028
- Chart on Germany - Market size and forecast 2023-2028 ($ million)
- Data Table on Germany - Market size and forecast 2023-2028 ($ million)
- Chart on Germany - Year-over-year growth 2023-2028 (%)
- Data Table on Germany - Year-over-year growth 2023-2028 (%)
- 9.9 Canada - Market size and forecast 2023-2028
- Chart on Canada - Market size and forecast 2023-2028 ($ million)
- Data Table on Canada - Market size and forecast 2023-2028 ($ million)
- Chart on Canada - Year-over-year growth 2023-2028 (%)
- Data Table on Canada - Year-over-year growth 2023-2028 (%)
- 9.10 China - Market size and forecast 2023-2028
- Chart on China - Market size and forecast 2023-2028 ($ million)
- Data Table on China - Market size and forecast 2023-2028 ($ million)
- Chart on China - Year-over-year growth 2023-2028 (%)
- Data Table on China - Year-over-year growth 2023-2028 (%)
- 9.11 France - Market size and forecast 2023-2028
- Chart on France - Market size and forecast 2023-2028 ($ million)
- Data Table on France - Market size and forecast 2023-2028 ($ million)
- Chart on France - Year-over-year growth 2023-2028 (%)
- Data Table on France - Year-over-year growth 2023-2028 (%)
- 9.12 Market opportunity By Geographical Landscape
- Market opportunity By Geographical Landscape ($ million)
- Data Tables on Market opportunity By Geographical Landscape ($ million)
10 Drivers, Challenges, and Opportunity/Restraints
- 10.1 Market drivers
- 10.2 Market challenges
- 10.3 Impact of drivers and challenges
- Impact of drivers and challenges in 2023 and 2028
- 10.4 Market opportunities/restraints
11 Competitive Landscape
- 11.1 Overview
- 11.2 Competitive Landscape
- Overview on criticality of inputs and factors of differentiation
- 11.3 Landscape disruption
- Overview on factors of disruption
- 11.4 Industry risks
- Impact of key risks on business
12 Competitive Analysis
- 12.1 Companies profiled
- Companies covered
- 12.2 Market positioning of companies
- Matrix on companies position and classification
- 12.3 Alimed Inc.
- Alimed Inc. - Overview
- Alimed Inc. - Product / Service
- Alimed Inc. - Key offerings
- 12.4 Arthrex Inc.
- Arthrex Inc. - Overview
- Arthrex Inc. - Product / Service
- Arthrex Inc. - Key offerings
- 12.5 Breg Inc.
- Breg Inc. - Overview
- Breg Inc. - Product / Service
- Breg Inc. - Key offerings
- 12.6 Conmed Corp.
- Conmed Corp. - Overview
- Conmed Corp. - Business segments
- Conmed Corp. - Key offerings
- Conmed Corp. - Segment focus
- 12.7 Core Products International Inc.
- Core Products International Inc. - Overview
- Core Products International Inc. - Product / Service
- Core Products International Inc. - Key offerings
- 12.8 DJO Global Inc.
- DJO Global Inc. - Overview
- DJO Global Inc. - Product / Service
- DJO Global Inc. - Key offerings
- 12.9 Johnson and Johnson Services Inc.
- Johnson and Johnson Services Inc. - Overview
- Johnson and Johnson Services Inc. - Business segments
- Johnson and Johnson Services Inc. - Key news
- Johnson and Johnson Services Inc. - Key offerings
- Johnson and Johnson Services Inc. - Segment focus
- 12.10 medi GmbH and Co. KG
- medi GmbH and Co. KG - Overview
- medi GmbH and Co. KG - Product / Service
- medi GmbH and Co. KG - Key offerings
- 12.11 Medtronic Plc
- Medtronic Plc - Overview
- Medtronic Plc - Business segments
- Medtronic Plc - Key news
- Medtronic Plc - Key offerings
- Medtronic Plc - Segment focus
- 12.12 Mueller Sports Medicine Inc.
- Mueller Sports Medicine Inc. - Overview
- Mueller Sports Medicine Inc. - Product / Service
- Mueller Sports Medicine Inc. - Key offerings
- 12.13 Ossur hf
- Ossur hf - Overview
- Ossur hf - Business segments
- Ossur hf - Key offerings
- Ossur hf - Segment focus
- 12.14 Smith and Nephew plc
- Smith and Nephew plc - Overview
- Smith and Nephew plc - Business segments
- Smith and Nephew plc - Key news
- Smith and Nephew plc - Key offerings
- Smith and Nephew plc - Segment focus
- 12.15 Stryker Corp.
- Stryker Corp. - Overview
- Stryker Corp. - Business segments
- Stryker Corp. - Key news
- Stryker Corp. - Key offerings
- Stryker Corp. - Segment focus
- 12.16 ThermoTek Inc.
- ThermoTek Inc. - Overview
- ThermoTek Inc. - Product / Service
- ThermoTek Inc. - Key offerings
- 12.17 Zimmer Biomet Holdings Inc.
- Zimmer Biomet Holdings Inc. - Overview
- Zimmer Biomet Holdings Inc. - Business segments
- Zimmer Biomet Holdings Inc. - Key news
- Zimmer Biomet Holdings Inc. - Key offerings
- Zimmer Biomet Holdings Inc. - Segment focus
13 Appendix
- 13.1 Scope of the report
- 13.2 Inclusions and exclusions checklist
- Inclusions checklist
- Exclusions checklist
- 13.3 Currency conversion rates for US$
- Currency conversion rates for US$
- 13.4 Research methodology
- Research methodology
- 13.5 Data procurement
- Information sources
- 13.6 Data validation
- Data validation
- 13.7 Validation techniques employed for market sizing
- Validation techniques employed for market sizing
- 13.8 Data synthesis
- Data synthesis
- 13.9 360 degree market analysis
- 360 degree market analysis
- 13.10 List of abbreviations
- List of abbreviations

