|
|
市場調査レポート
商品コード
1653054
調剤薬局の世界市場 2025~2029年Global Compounding Pharmacy Market 2025-2029 |
||||||

|
|||||||
カスタマイズ可能
|
|||||||


| 調剤薬局の世界市場 2025~2029年 |
|
出版日: 2025年01月30日
発行: TechNavio
ページ情報: 英文 199 Pages
納期: 即納可能
|

全表示
- 概要
- 目次
調剤薬局市場は2024~2029年に17億4,060万米ドル、予測期間中のCAGRは2.2%で成長すると予測されます。
当レポートでは、調剤薬局市場の全体的な分析、市場規模・予測、動向、成長促進要因、課題、約25のベンダーを網羅したベンダー分析などを掲載しています。
現在の市場シナリオ、最新動向と促進要因、市場環境全体に関する最新分析を提供しています。HRTの人気の高まりによる処方薬の需要の促進、ホルモンバランスの乱れの問題の有病率の増加、政府の規制やイニシアチブなどが市場を牽引しています。
| 市場範囲 | |
|---|---|
| 基準年 | 2025年 |
| 終了年 | 2029年 |
| 予測期間 | 2025~2029年 |
| 成長モメンタム | 加速 |
| 前年比[2025年] | 2.1% |
| CAGR | 2.2% |
| 増分額 | 17億4,060万米ドル |
本調査は、産業の主要参加者からのインプットを含め、一次情報と二次情報を客観的に組み合わせて実施しました。レポートには、主要企業の分析に加え、包括的な市場規模データ、地域別分析によるセグメント、ベンダー情勢が含まれています。レポートには過去データと予測データを掲載しています。
本調査では、今後数年間の調剤薬局市場の成長を促進する主要理由の一つとして、個別化医療の人気の高まりを挙げています。また、新興市場における未開拓の機会や、世界の必須医薬品の不足は、同市場における大きな需要につながると考えられます。
目次
第1章 エグゼクティブサマリー
- 市場概要
第2章 Technavio分析
- 価格・ライフサイクル・顧客購入バスケット・採用率・購入基準の分析
- インプットの重要性と差別化の要因
- 混乱の要因
- 促進要因と課題の影響
第3章 市場情勢
- 市場エコシステム
- 市場の特徴
- バリューチェーン分析
第4章 市場規模
- 市場の定義
- 市場セグメント分析
- 市場規模 2024年
- 市場の展望 2024~2029年
第5章 市場規模実績
- 調剤薬局の世界市場 2019~2023年
- 製品別セグメント分析 2019~2023年
- 治療領域セグメント分析 2019~2023年
- 地域別セグメント分析 2019~2023年
- 国別セグメント分析 2019~2023年
第6章 定性分析
- AIの影響:調剤薬局の世界市場
第7章 ファイブフォース分析
- ファイブフォースの要約
- 買い手の交渉力
- 供給企業の交渉力
- 新規参入業者の脅威
- 代替品の脅威
- 競争の脅威
- 市況
第8章 市場セグメンテーション:製品別
- 市場セグメント
- 比較:製品別
- 外用薬:市場規模と予測 2024~2029年
- 経口薬:市場規模と予測 2024~2029年
- 非経口薬:市場規模と予測 2024~2029年
- その他:市場規模と予測 2024~2029年
- 市場機会:製品別
第9章 市場セグメンテーション:治療領域別
- 市場セグメント
- 比較:治療領域別
- 疼痛管理:市場規模と予測 2024~2029年
- ホルモン補充療法:市場規模と予測 2024~2029年
- 皮膚疾患:市場規模と予測 2024~2029年
- その他:市場規模と予測 2024~2029年
- 市場機会:治療領域別
第10章 顧客情勢
- 顧客情勢概要
第11章 地域別情勢
- 地域別セグメンテーション
- 比較:地域別
- 北米:市場規模と予測 2024~2029年
- 欧州:市場規模と予測 2024~2029年
- アジア:市場規模と予測 2024~2029年
- その他:市場規模と予測 2024~2029年
- 米国:市場規模と予測 2024~2029年
- カナダ:市場規模と予測 2024~2029年
- フランス:市場規模と予測 2024~2029年
- 中国:市場規模と予測 2024~2029年
- 日本:市場規模と予測 2024~2029年
- インド:市場規模と予測 2024~2029年
- ドイツ:市場規模と予測 2024~2029年
- 英国:市場規模と予測 2024~2029年
- 韓国:市場規模と予測 2024~2029年
- ブラジル:市場規模と予測 2024~2029年
- 地域情勢による市場機会
第12章 促進要因・課題・機会・抑制要因
- 市場促進要因
- 市場課題
- 促進要因と課題の影響
- 市場機会・抑制要因
第13章 競合情勢
- 概要
- 競合情勢
- 混乱の状況
- 産業のリスク
第14章 競合分析
- 企業プロファイル
- 企業ランキング指数
- 企業の市場ポジショニング
- ACPHARM QUEENSLAND Pty Ltd.
- Advance Pharmacy
- B.Braun SE
- Fagron NV
- Fresenius Kabi AG
- Institutional Pharmacy Solutions
- ITC Compounding Pharmacy
- McGuff Co. Inc.
- Nephron Pharmaceuticals Corp.
- Olympia Pharmacy
- PenCol Specialty Pharmacy
- Rx3 Compounding Pharmacy
- Triangle Compounding Pharmacy
- Valor Compounding Pharmacy
- Wedgewood Village Pharmacy LLC
第15章 付録
The compounding pharmacy market is forecasted to grow by USD 1740.6 million during 2024-2029, accelerating at a CAGR of 2.2% during the forecast period. The report on the compounding pharmacy market provides a holistic analysis, market size and forecast, trends, growth drivers, and challenges, as well as vendor analysis covering around 25 vendors.
The report offers an up-to-date analysis regarding the current market scenario, the latest trends and drivers, and the overall market environment. The market is driven by growing popularity of HRT fueling demand for compounded medications, increasing prevalence of hormonal imbalance problems, and government regulations and initiatives.
| Market Scope | |
|---|---|
| Base Year | 2025 |
| End Year | 2029 |
| Series Year | 2025-2029 |
| Growth Momentum | Accelerate |
| YOY 2025 | 2.1% |
| CAGR | 2.2% |
| Incremental Value | $1740.6 mn |
The study was conducted using an objective combination of primary and secondary information including inputs from key participants in the industry. The report contains a comprehensive market size data, segment with regional analysis and vendor landscape in addition to an analysis of the key companies. Reports have historic and forecast data.
Technavio's compounding pharmacy market is segmented as below:
By Product
- Topical medications
- Oral medications
- Parenteral medications
- Others
By Therapeutic Area
- Pain management
- Hormone replacement
- Dermal disorders
- Others
By Geographical Landscape
- North America
- Europe
- Asia
- Rest of World (ROW)
This study identifies the rising popularity of personalized medicines as one of the prime reasons driving the compounding pharmacy market growth during the next few years. Also, untapped opportunities in emerging markets and global shortage of essential drugs will lead to sizable demand in the market.
The report on the compounding pharmacy market covers the following areas:
- Compounding Pharmacy Market sizing
- Compounding Pharmacy Market forecast
- Compounding Pharmacy Market industry analysis
The robust vendor analysis is designed to help clients improve their market position, and in line with this, this report provides a detailed analysis of several leading compounding pharmacy market vendors that include ACPHARM QUEENSLAND Pty Ltd., Advance Pharmacy, B.Braun SE, Doughertys Pharmacy, Fagron NV, Fresenius Kabi AG, Institutional Pharmacy Solutions, ITC Compounding Pharmacy, Lee Silsby Compounding Pharmacy, McGuff Co. Inc., Nephron Pharmaceuticals Corp., Olympia Pharmacy, PenCol Specialty Pharmacy, QuVa Pharma Inc., Rx3 Compounding Pharmacy, Triangle Compounding Pharmacy, Valor Compounding Pharmacy, Village Compounding Pharmacy, and Wedgewood Village Pharmacy LLC. Also, the compounding pharmacy market analysis report includes information on upcoming trends and challenges that will influence market growth. This is to help companies strategize and leverage all forthcoming growth opportunities.
The publisher presents a detailed picture of the market by the way of study, synthesis, and summation of data from multiple sources by an analysis of key parameters such as profit, pricing, competition, and promotions. It presents various market facets by identifying the key industry influencers. The data presented is comprehensive, reliable, and a result of extensive primary and secondary research. The market research reports provide a complete competitive landscape and an in-depth vendor selection methodology and analysis using qualitative and quantitative research to forecast accurate market growth.
Table of Contents
1 Executive Summary
- 1.1 Market overview
- Executive Summary - Chart on Market Overview
- Executive Summary - Data Table on Market Overview
- Executive Summary - Chart on Global Market Characteristics
- Executive Summary - Chart on Market By Geographical Landscape
- Executive Summary - Chart on Market Segmentation by Product
- Executive Summary - Chart on Market Segmentation by Therapeutic Area
- Executive Summary - Chart on Incremental Growth
- Executive Summary - Data Table on Incremental Growth
- Executive Summary - Chart on Company Market Positioning
2 Technavio Analysis
- 2.1 Analysis of price sensitivity, lifecycle, customer purchase basket, adoption rates, and purchase criteria
- Analysis of price sensitivity, lifecycle, customer purchase basket, adoption rates, and purchase criteria
- 2.2 Criticality of inputs and Factors of differentiation
- Overview on criticality of inputs and factors of differentiation
- 2.3 Factors of disruption
- Overview on factors of disruption
- 2.4 Impact of drivers and challenges
- Impact of drivers and challenges in 2024 and 2029
3 Market Landscape
- 3.1 Market ecosystem
- Parent Market
- Data Table on - Parent Market
- 3.2 Market characteristics
- Market characteristics analysis
- 3.3 Value chain analysis
- Value chain analysis
4 Market Sizing
- 4.1 Market definition
- Offerings of companies included in the market definition
- 4.2 Market segment analysis
- Market segments
- 4.3 Market size 2024
- 4.4 Market outlook: Forecast for 2024-2029
- Chart on Global - Market size and forecast 2024-2029 ($ million)
- Data Table on Global - Market size and forecast 2024-2029 ($ million)
- Chart on Global Market: Year-over-year growth 2024-2029 (%)
- Data Table on Global Market: Year-over-year growth 2024-2029 (%)
5 Historic Market Size
- 5.1 Global Compounding Pharmacy Market 2019 - 2023
- Historic Market Size - Data Table on Global Compounding Pharmacy Market 2019 - 2023 ($ million)
- 5.2 Product segment analysis 2019 - 2023
- Historic Market Size - Product Segment 2019 - 2023 ($ million)
- 5.3 Therapeutic Area segment analysis 2019 - 2023
- Historic Market Size - Therapeutic Area Segment 2019 - 2023 ($ million)
- 5.4 Geography segment analysis 2019 - 2023
- Historic Market Size - Geography Segment 2019 - 2023 ($ million)
- 5.5 Country segment analysis 2019 - 2023
- Historic Market Size - Country Segment 2019 - 2023 ($ million)
6 Qualitative Analysis
- 6.1 The AI impact on Global Compounding Pharmacy Market
7 Five Forces Analysis
- 7.1 Five forces summary
- Five forces analysis - Comparison between 2024 and 2029
- 7.2 Bargaining power of buyers
- Bargaining power of buyers - Impact of key factors 2024 and 2029
- 7.3 Bargaining power of suppliers
- Bargaining power of suppliers - Impact of key factors in 2024 and 2029
- 7.4 Threat of new entrants
- Threat of new entrants - Impact of key factors in 2024 and 2029
- 7.5 Threat of substitutes
- Threat of substitutes - Impact of key factors in 2024 and 2029
- 7.6 Threat of rivalry
- Threat of rivalry - Impact of key factors in 2024 and 2029
- 7.7 Market condition
- Chart on Market condition - Five forces 2024 and 2029
8 Market Segmentation by Product
- 8.1 Market segments
- Chart on Product - Market share 2024-2029 (%)
- Data Table on Product - Market share 2024-2029 (%)
- 8.2 Comparison by Product
- Chart on Comparison by Product
- Data Table on Comparison by Product
- 8.3 Topical medications - Market size and forecast 2024-2029
- Chart on Topical medications - Market size and forecast 2024-2029 ($ million)
- Data Table on Topical medications - Market size and forecast 2024-2029 ($ million)
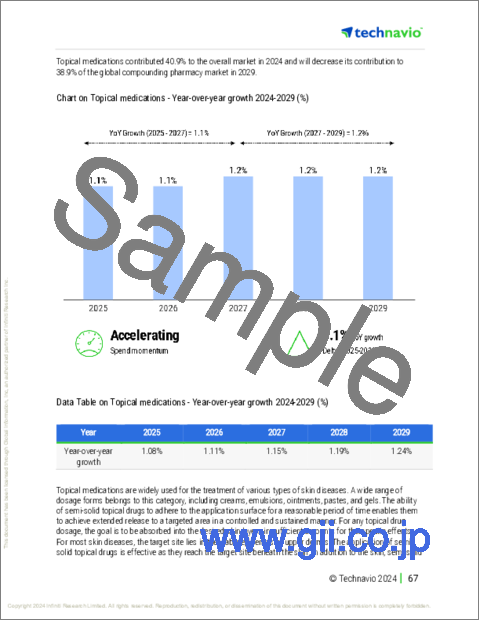
- Chart on Topical medications - Year-over-year growth 2024-2029 (%)
- Data Table on Topical medications - Year-over-year growth 2024-2029 (%)
- 8.4 Oral medications - Market size and forecast 2024-2029
- Chart on Oral medications - Market size and forecast 2024-2029 ($ million)
- Data Table on Oral medications - Market size and forecast 2024-2029 ($ million)
- Chart on Oral medications - Year-over-year growth 2024-2029 (%)
- Data Table on Oral medications - Year-over-year growth 2024-2029 (%)
- 8.5 Parenteral medications - Market size and forecast 2024-2029
- Chart on Parenteral medications - Market size and forecast 2024-2029 ($ million)
- Data Table on Parenteral medications - Market size and forecast 2024-2029 ($ million)
- Chart on Parenteral medications - Year-over-year growth 2024-2029 (%)
- Data Table on Parenteral medications - Year-over-year growth 2024-2029 (%)
- 8.6 Others - Market size and forecast 2024-2029
- Chart on Others - Market size and forecast 2024-2029 ($ million)
- Data Table on Others - Market size and forecast 2024-2029 ($ million)
- Chart on Others - Year-over-year growth 2024-2029 (%)
- Data Table on Others - Year-over-year growth 2024-2029 (%)
- 8.7 Market opportunity by Product
- Market opportunity by Product ($ million)
- Data Table on Market opportunity by Product ($ million)
9 Market Segmentation by Therapeutic Area
- 9.1 Market segments
- Chart on Therapeutic Area - Market share 2024-2029 (%)
- Data Table on Therapeutic Area - Market share 2024-2029 (%)
- 9.2 Comparison by Therapeutic Area
- Chart on Comparison by Therapeutic Area
- Data Table on Comparison by Therapeutic Area
- 9.3 Pain management - Market size and forecast 2024-2029
- Chart on Pain management - Market size and forecast 2024-2029 ($ million)
- Data Table on Pain management - Market size and forecast 2024-2029 ($ million)
- Chart on Pain management - Year-over-year growth 2024-2029 (%)
- Data Table on Pain management - Year-over-year growth 2024-2029 (%)
- 9.4 Hormone replacement - Market size and forecast 2024-2029
- Chart on Hormone replacement - Market size and forecast 2024-2029 ($ million)
- Data Table on Hormone replacement - Market size and forecast 2024-2029 ($ million)
- Chart on Hormone replacement - Year-over-year growth 2024-2029 (%)
- Data Table on Hormone replacement - Year-over-year growth 2024-2029 (%)
- 9.5 Dermal disorders - Market size and forecast 2024-2029
- Chart on Dermal disorders - Market size and forecast 2024-2029 ($ million)
- Data Table on Dermal disorders - Market size and forecast 2024-2029 ($ million)
- Chart on Dermal disorders - Year-over-year growth 2024-2029 (%)
- Data Table on Dermal disorders - Year-over-year growth 2024-2029 (%)
- 9.6 Others - Market size and forecast 2024-2029
- Chart on Others - Market size and forecast 2024-2029 ($ million)
- Data Table on Others - Market size and forecast 2024-2029 ($ million)
- Chart on Others - Year-over-year growth 2024-2029 (%)
- Data Table on Others - Year-over-year growth 2024-2029 (%)
- 9.7 Market opportunity by Therapeutic Area
- Market opportunity by Therapeutic Area ($ million)
- Data Table on Market opportunity by Therapeutic Area ($ million)
10 Customer Landscape
- 10.1 Customer landscape overview
- Analysis of price sensitivity, lifecycle, customer purchase basket, adoption rates, and purchase criteria
11 Geographic Landscape
- 11.1 Geographic segmentation
- Chart on Market share By Geographical Landscape 2024-2029 (%)
- Data Table on Market share By Geographical Landscape 2024-2029 (%)
- 11.2 Geographic comparison
- Chart on Geographic comparison
- Data Table on Geographic comparison
- 11.3 North America - Market size and forecast 2024-2029
- Chart on North America - Market size and forecast 2024-2029 ($ million)
- Data Table on North America - Market size and forecast 2024-2029 ($ million)
- Chart on North America - Year-over-year growth 2024-2029 (%)
- Data Table on North America - Year-over-year growth 2024-2029 (%)
- 11.4 Europe - Market size and forecast 2024-2029
- Chart on Europe - Market size and forecast 2024-2029 ($ million)
- Data Table on Europe - Market size and forecast 2024-2029 ($ million)
- Chart on Europe - Year-over-year growth 2024-2029 (%)
- Data Table on Europe - Year-over-year growth 2024-2029 (%)
- 11.5 Asia - Market size and forecast 2024-2029
- Chart on Asia - Market size and forecast 2024-2029 ($ million)
- Data Table on Asia - Market size and forecast 2024-2029 ($ million)
- Chart on Asia - Year-over-year growth 2024-2029 (%)
- Data Table on Asia - Year-over-year growth 2024-2029 (%)
- 11.6 Rest of World (ROW) - Market size and forecast 2024-2029
- Chart on Rest of World (ROW) - Market size and forecast 2024-2029 ($ million)
- Data Table on Rest of World (ROW) - Market size and forecast 2024-2029 ($ million)
- Chart on Rest of World (ROW) - Year-over-year growth 2024-2029 (%)
- Data Table on Rest of World (ROW) - Year-over-year growth 2024-2029 (%)
- 11.7 US - Market size and forecast 2024-2029
- Chart on US - Market size and forecast 2024-2029 ($ million)
- Data Table on US - Market size and forecast 2024-2029 ($ million)
- Chart on US - Year-over-year growth 2024-2029 (%)
- Data Table on US - Year-over-year growth 2024-2029 (%)
- 11.8 Canada - Market size and forecast 2024-2029
- Chart on Canada - Market size and forecast 2024-2029 ($ million)
- Data Table on Canada - Market size and forecast 2024-2029 ($ million)
- Chart on Canada - Year-over-year growth 2024-2029 (%)
- Data Table on Canada - Year-over-year growth 2024-2029 (%)
- 11.9 France - Market size and forecast 2024-2029
- Chart on France - Market size and forecast 2024-2029 ($ million)
- Data Table on France - Market size and forecast 2024-2029 ($ million)
- Chart on France - Year-over-year growth 2024-2029 (%)
- Data Table on France - Year-over-year growth 2024-2029 (%)
- 11.10 China - Market size and forecast 2024-2029
- Chart on China - Market size and forecast 2024-2029 ($ million)
- Data Table on China - Market size and forecast 2024-2029 ($ million)
- Chart on China - Year-over-year growth 2024-2029 (%)
- Data Table on China - Year-over-year growth 2024-2029 (%)
- 11.11 Japan - Market size and forecast 2024-2029
- Chart on Japan - Market size and forecast 2024-2029 ($ million)
- Data Table on Japan - Market size and forecast 2024-2029 ($ million)
- Chart on Japan - Year-over-year growth 2024-2029 (%)
- Data Table on Japan - Year-over-year growth 2024-2029 (%)
- 11.12 India - Market size and forecast 2024-2029
- Chart on India - Market size and forecast 2024-2029 ($ million)
- Data Table on India - Market size and forecast 2024-2029 ($ million)
- Chart on India - Year-over-year growth 2024-2029 (%)
- Data Table on India - Year-over-year growth 2024-2029 (%)
- 11.13 Germany - Market size and forecast 2024-2029
- Chart on Germany - Market size and forecast 2024-2029 ($ million)
- Data Table on Germany - Market size and forecast 2024-2029 ($ million)
- Chart on Germany - Year-over-year growth 2024-2029 (%)
- Data Table on Germany - Year-over-year growth 2024-2029 (%)
- 11.14 UK - Market size and forecast 2024-2029
- Chart on UK - Market size and forecast 2024-2029 ($ million)
- Data Table on UK - Market size and forecast 2024-2029 ($ million)
- Chart on UK - Year-over-year growth 2024-2029 (%)
- Data Table on UK - Year-over-year growth 2024-2029 (%)
- 11.15 South Korea - Market size and forecast 2024-2029
- Chart on South Korea - Market size and forecast 2024-2029 ($ million)
- Data Table on South Korea - Market size and forecast 2024-2029 ($ million)
- Chart on South Korea - Year-over-year growth 2024-2029 (%)
- Data Table on South Korea - Year-over-year growth 2024-2029 (%)
- 11.16 Brazil - Market size and forecast 2024-2029
- Chart on Brazil - Market size and forecast 2024-2029 ($ million)
- Data Table on Brazil - Market size and forecast 2024-2029 ($ million)
- Chart on Brazil - Year-over-year growth 2024-2029 (%)
- Data Table on Brazil - Year-over-year growth 2024-2029 (%)
- 11.17 Market opportunity By Geographical Landscape
- Market opportunity By Geographical Landscape ($ million)
- Data Tables on Market opportunity By Geographical Landscape ($ million)
12 Drivers, Challenges, and Opportunity/Restraints
- 12.1 Market drivers
- 12.2 Market challenges
- 12.3 Impact of drivers and challenges
- Impact of drivers and challenges in 2024 and 2029
- 12.4 Market opportunities/restraints
13 Competitive Landscape
- 13.1 Overview
- 13.2 Competitive Landscape
- Overview on criticality of inputs and factors of differentiation
- 13.3 Landscape disruption
- Overview on factors of disruption
- 13.4 Industry risks
- Impact of key risks on business
14 Competitive Analysis
- 14.1 Companies profiled
- Companies covered
- 14.2 Company ranking index
- Company ranking index
- 14.3 Market positioning of companies
- Matrix on companies position and classification
- 14.4 ACPHARM QUEENSLAND Pty Ltd.
- ACPHARM QUEENSLAND Pty Ltd. - Overview
- ACPHARM QUEENSLAND Pty Ltd. - Product / Service
- ACPHARM QUEENSLAND Pty Ltd. - Key offerings
- SWOT
- 14.5 Advance Pharmacy
- Advance Pharmacy - Overview
- Advance Pharmacy - Product / Service
- Advance Pharmacy - Key offerings
- SWOT
- 14.6 B.Braun SE
- B.Braun SE - Overview
- B.Braun SE - Product / Service
- B.Braun SE - Key news
- B.Braun SE - Key offerings
- SWOT
- 14.7 Fagron NV
- Fagron NV - Overview
- Fagron NV - Business segments
- Fagron NV - Key offerings
- Fagron NV - Segment focus
- SWOT
- 14.8 Fresenius Kabi AG
- Fresenius Kabi AG - Overview
- Fresenius Kabi AG - Product / Service
- Fresenius Kabi AG - Key offerings
- SWOT
- 14.9 Institutional Pharmacy Solutions
- Institutional Pharmacy Solutions - Overview
- Institutional Pharmacy Solutions - Product / Service
- Institutional Pharmacy Solutions - Key offerings
- SWOT
- 14.10 ITC Compounding Pharmacy
- ITC Compounding Pharmacy - Overview
- ITC Compounding Pharmacy - Product / Service
- ITC Compounding Pharmacy - Key offerings
- SWOT
- 14.11 McGuff Co. Inc.
- McGuff Co. Inc. - Overview
- McGuff Co. Inc. - Product / Service
- McGuff Co. Inc. - Key offerings
- SWOT
- 14.12 Nephron Pharmaceuticals Corp.
- Nephron Pharmaceuticals Corp. - Overview
- Nephron Pharmaceuticals Corp. - Product / Service
- Nephron Pharmaceuticals Corp. - Key offerings
- SWOT
- 14.13 Olympia Pharmacy
- Olympia Pharmacy - Overview
- Olympia Pharmacy - Product / Service
- Olympia Pharmacy - Key offerings
- SWOT
- 14.14 PenCol Specialty Pharmacy
- PenCol Specialty Pharmacy - Overview
- PenCol Specialty Pharmacy - Product / Service
- PenCol Specialty Pharmacy - Key offerings
- SWOT
- 14.15 Rx3 Compounding Pharmacy
- Rx3 Compounding Pharmacy - Overview
- Rx3 Compounding Pharmacy - Product / Service
- Rx3 Compounding Pharmacy - Key offerings
- SWOT
- 14.16 Triangle Compounding Pharmacy
- Triangle Compounding Pharmacy - Overview
- Triangle Compounding Pharmacy - Product / Service
- Triangle Compounding Pharmacy - Key offerings
- SWOT
- 14.17 Valor Compounding Pharmacy
- Valor Compounding Pharmacy - Overview
- Valor Compounding Pharmacy - Product / Service
- Valor Compounding Pharmacy - Key offerings
- SWOT
- 14.18 Wedgewood Village Pharmacy LLC
- Wedgewood Village Pharmacy LLC - Overview
- Wedgewood Village Pharmacy LLC - Product / Service
- Wedgewood Village Pharmacy LLC - Key offerings
- SWOT
15 Appendix
- 15.1 Scope of the report
- 15.2 Inclusions and exclusions checklist
- Inclusions checklist
- Exclusions checklist
- 15.3 Currency conversion rates for US$
- Currency conversion rates for US$
- 15.4 Research methodology
- Research methodology
- 15.5 Data procurement
- Information sources
- 15.6 Data validation
- Data validation
- 15.7 Validation techniques employed for market sizing
- Validation techniques employed for market sizing
- 15.8 Data synthesis
- Data synthesis
- 15.9 360 degree market analysis
- 360 degree market analysis
- 15.10 List of abbreviations
- List of abbreviations

