|
|
市場調査レポート
商品コード
1693094
パーソナルケア家電の世界市場 2025-2029Global Personal Care Appliances Market 2025-2029 |
||||||

|
|||||||
カスタマイズ可能
|
|||||||


| パーソナルケア家電の世界市場 2025-2029 |
|
出版日: 2025年03月20日
発行: TechNavio
ページ情報: 英文 230 Pages
納期: 即納可能
|

全表示
- 概要
- 図表
- 目次
パーソナルケア家電市場は2024-2029年に76億9,000万米ドル、予測期間中のCAGRは6.2%で成長すると予測されます。
当レポートでは、パーソナルケア家電市場の全体的な分析、市場規模・予測、動向、成長促進要因、課題、約25のベンダーを網羅したベンダー分析などを掲載しています。
現在の市場シナリオ、最新動向と促進要因、市場環境全体に関する最新分析を提供しています。市場は、ポートフォリオの拡張と製品のプレミアム化につながる製品イノベーション、消費者の裁量所得の増加、パーソナルグルーミングにおけるファッション動向の進化によって牽引されています。
| 市場範囲 | |
|---|---|
| 基準年 | 2025 |
| 終了年 | 2029 |
| 予測期間 | 2025-2029 |
| 成長モメンタム | 加速 |
| 前年比2025年 | 5.5% |
| CAGR | 6.2% |
| 増分額 | 76億9,000万米ドル |
本調査は、業界の主要参加者からのインプットを含め、一次情報と二次情報を客観的に組み合わせて実施しました。レポートには、主要企業の分析に加え、包括的な市場規模データ、地域別分析によるセグメント、ベンダー情勢が含まれています。レポートにはヒストリカルデータと予測データがあります。
本調査では、パーソナルケア家電の世界市場における新製品の発売が、今後数年間のパーソナルケア家電市場の成長を促進する主要な要因の一つであると特定しています。また、パーソナルケア家電のオンライン販売の増加や、パーソナルケア家電の販売を増加させるためのソーシャルメディアマーケティングの利用は、市場の大きな需要につながるでしょう。
目次
第1章 エグゼクティブサマリー
- 市場概要
第2章 Technavio分析
- 価格・ライフサイクル・顧客購入バスケット・採用率・購入基準の分析
- インプットの重要性と差別化の要因
- 混乱の要因
- 促進要因と課題の影響
第3章 市場情勢
- 市場エコシステム
- 市場の特徴
- バリューチェーン分析
第4章 市場規模
- 市場の定義
- 市場セグメント分析
- 市場規模 2024
- 市場の見通し 2024-2029
第5章 市場規模実績
- パーソナルケア家電の世界市場 2019-2023
- 流通チャネルセグメント分析 2019-2023
- 製品セグメント分析 2019-2023
- 性別セグメント分析 2019-2023
- タイプセグメント分析 2019-2023
- 地域別セグメント分析 2019-2023
- 国別セグメント分析 2019-2023
第6章 定性分析
- AIの影響パーソナルケア家電の世界市場
第7章 ファイブフォース分析
- ファイブフォースの要約
- 買い手の交渉力
- 供給企業の交渉力
- 新規参入業者の脅威
- 代替品の脅威
- 競争の脅威
- 市況
第8章 市場セグメンテーション:流通チャネル別
- 市場セグメント
- 比較:流通チャネル別
- オフライン:市場規模と予測 2024-2029
- オンライン:市場規模と予測 2024-2029
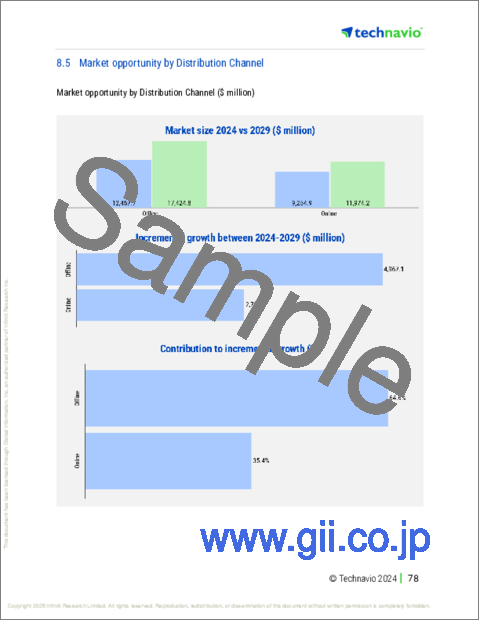
- 市場機会:流通チャネル別
第9章 市場セグメンテーション:製品別
- 市場セグメント
- 比較:製品別
- ヘアケア用品:市場規模と予測 2024-2029
- 脱毛器具:市場規模と予測 2024-2029
- 口腔ケア器具:市場規模と予測 2024-2029
- 市場機会:製品別
第10章 市場セグメンテーション:男女別
- 市場セグメント
- 比較:男女別
- 女性:市場規模と予測 2024-2029
- 男性:市場規模と予測 2024-2029
- ユニセックス:市場規模と予測 2024-2029
- 市場機会:男女別
第11章 市場セグメンテーション:タイプ別
- 市場セグメント
- 比較:タイプ別
- コード付き:市場規模と予測 2024-2029
- コードレス:市場規模と予測 2024-2029
- 市場機会:タイプ別
第12章 顧客情勢
- 顧客情勢の概要
第13章 地域別情勢
- 地域別セグメンテーション
- 地域別比較
- アジア太平洋:市場規模と予測 2024-2029
- 欧州:市場規模と予測 2024-2029
- 北米:市場規模と予測 2024-2029
- 南米:市場規模と予測 2024-2029
- 中東・アフリカ:市場規模と予測 2024-2029
- 米国:市場規模と予測 2024-2029
- 中国:市場規模と予測 2024-2029
- 日本:市場規模と予測 2024-2029
- インド:市場規模と予測 2024-2029
- 英国:市場規模と予測 2024-2029
- ドイツ:市場規模と予測 2024-2029
- 韓国:市場規模と予測 2024-2029
- カナダ:市場規模と予測 2024-2029
- フランス:市場規模と予測 2024-2029
- イタリア:市場規模と予測 2024-2029
- 市場機会:地域情勢別
第14章 促進要因・課題・機会・抑制要因
- 市場促進要因
- 市場の課題
- 促進要因と課題の影響
- 市場の機会・抑制要因
第15章 競合情勢
- 概要
- 競合情勢
- 混乱の状況
- 業界のリスク
第16章 競合分析
- 企業プロファイル
- 企業ランキング指数
- 企業の市場ポジショニング
- Amika LLC
- Andis Co.
- Beauty Quest Group
- Colgate Palmolive Co.
- Conair Corp.
- Coty Inc.
- Drybar Holdings LLC
- Dyson Group Co.
- Elchim Spa
- FKA Distributing Co. LLC
- IkonicWorld
- Koninklijke Philips NV
- Panasonic Holdings Corp.
- The Procter and Gamble Co.
- Wahl Clipper Corp.
第17章 付録
Exhibits:
- Exhibits1: Executive Summary - Chart on Market Overview
- Exhibits2: Executive Summary - Data Table on Market Overview
- Exhibits3: Executive Summary - Chart on Global Market Characteristics
- Exhibits4: Executive Summary - Chart on Market By Geographical Landscape
- Exhibits5: Executive Summary - Chart on Market Segmentation by Distribution Channel
- Exhibits6: Executive Summary - Chart on Market Segmentation by Product
- Exhibits7: Executive Summary - Chart on Market Segmentation by Gender
- Exhibits8: Executive Summary - Chart on Market Segmentation by Type
- Exhibits9: Executive Summary - Chart on Incremental Growth
- Exhibits10: Executive Summary - Data Table on Incremental Growth
- Exhibits11: Executive Summary - Chart on Company Market Positioning
- Exhibits12: Analysis of price sensitivity, lifecycle, customer purchase basket, adoption rates, and purchase criteria
- Exhibits13: Overview on criticality of inputs and factors of differentiation
- Exhibits14: Overview on factors of disruption
- Exhibits15: Impact of drivers and challenges in 2024 and 2029
- Exhibits16: Parent Market
- Exhibits17: Data Table on - Parent Market
- Exhibits18: Market characteristics analysis
- Exhibits19: Value chain analysis
- Exhibits20: Offerings of companies included in the market definition
- Exhibits21: Market segments
- Exhibits22: Chart on Global - Market size and forecast 2024-2029 ($ billion)
- Exhibits23: Data Table on Global - Market size and forecast 2024-2029 ($ billion)
- Exhibits24: Chart on Global Market: Year-over-year growth 2024-2029 (%)
- Exhibits25: Data Table on Global Market: Year-over-year growth 2024-2029 (%)
- Exhibits26: Historic Market Size - Data Table on Global Personal Care Appliances Market 2019 - 2023 ($ billion)
- Exhibits27: Historic Market Size - Distribution Channel Segment 2019 - 2023 ($ billion)
- Exhibits28: Historic Market Size - Product Segment 2019 - 2023 ($ billion)
- Exhibits29: Historic Market Size - Gender Segment 2019 - 2023 ($ billion)
- Exhibits30: Historic Market Size - Type Segment 2019 - 2023 ($ billion)
- Exhibits31: Historic Market Size - Geography Segment 2019 - 2023 ($ billion)
- Exhibits32: Historic Market Size - Country Segment 2019 - 2023 ($ billion)
- Exhibits33: Five forces analysis - Comparison between 2024 and 2029
- Exhibits34: Bargaining power of buyers - Impact of key factors 2024 and 2029
- Exhibits35: Bargaining power of suppliers - Impact of key factors in 2024 and 2029
- Exhibits36: Threat of new entrants - Impact of key factors in 2024 and 2029
- Exhibits37: Threat of substitutes - Impact of key factors in 2024 and 2029
- Exhibits38: Threat of rivalry - Impact of key factors in 2024 and 2029
- Exhibits39: Chart on Market condition - Five forces 2024 and 2029
- Exhibits40: Chart on Distribution Channel - Market share 2024-2029 (%)
- Exhibits41: Data Table on Distribution Channel - Market share 2024-2029 (%)
- Exhibits42: Chart on Comparison by Distribution Channel
- Exhibits43: Data Table on Comparison by Distribution Channel
- Exhibits44: Chart on Offline - Market size and forecast 2024-2029 ($ billion)
- Exhibits45: Data Table on Offline - Market size and forecast 2024-2029 ($ billion)
- Exhibits46: Chart on Offline - Year-over-year growth 2024-2029 (%)
- Exhibits47: Data Table on Offline - Year-over-year growth 2024-2029 (%)
- Exhibits48: Chart on Online - Market size and forecast 2024-2029 ($ billion)
- Exhibits49: Data Table on Online - Market size and forecast 2024-2029 ($ billion)
- Exhibits50: Chart on Online - Year-over-year growth 2024-2029 (%)
- Exhibits51: Data Table on Online - Year-over-year growth 2024-2029 (%)
- Exhibits52: Market opportunity by Distribution Channel ($ billion)
- Exhibits53: Data Table on Market opportunity by Distribution Channel ($ billion)
- Exhibits54: Chart on Product - Market share 2024-2029 (%)
- Exhibits55: Data Table on Product - Market share 2024-2029 (%)
- Exhibits56: Chart on Comparison by Product
- Exhibits57: Data Table on Comparison by Product
- Exhibits58: Chart on Hair care appliances - Market size and forecast 2024-2029 ($ billion)
- Exhibits59: Data Table on Hair care appliances - Market size and forecast 2024-2029 ($ billion)
- Exhibits60: Chart on Hair care appliances - Year-over-year growth 2024-2029 (%)
- Exhibits61: Data Table on Hair care appliances - Year-over-year growth 2024-2029 (%)
- Exhibits62: Chart on Hair removal appliances - Market size and forecast 2024-2029 ($ billion)
- Exhibits63: Data Table on Hair removal appliances - Market size and forecast 2024-2029 ($ billion)
- Exhibits64: Chart on Hair removal appliances - Year-over-year growth 2024-2029 (%)
- Exhibits65: Data Table on Hair removal appliances - Year-over-year growth 2024-2029 (%)
- Exhibits66: Chart on Oral care appliances - Market size and forecast 2024-2029 ($ billion)
- Exhibits67: Data Table on Oral care appliances - Market size and forecast 2024-2029 ($ billion)
- Exhibits68: Chart on Oral care appliances - Year-over-year growth 2024-2029 (%)
- Exhibits69: Data Table on Oral care appliances - Year-over-year growth 2024-2029 (%)
- Exhibits70: Market opportunity by Product ($ billion)
- Exhibits71: Data Table on Market opportunity by Product ($ billion)
- Exhibits72: Chart on Gender - Market share 2024-2029 (%)
- Exhibits73: Data Table on Gender - Market share 2024-2029 (%)
- Exhibits74: Chart on Comparison by Gender
- Exhibits75: Data Table on Comparison by Gender
- Exhibits76: Chart on Women - Market size and forecast 2024-2029 ($ billion)
- Exhibits77: Data Table on Women - Market size and forecast 2024-2029 ($ billion)
- Exhibits78: Chart on Women - Year-over-year growth 2024-2029 (%)
- Exhibits79: Data Table on Women - Year-over-year growth 2024-2029 (%)
- Exhibits80: Chart on Men - Market size and forecast 2024-2029 ($ billion)
- Exhibits81: Data Table on Men - Market size and forecast 2024-2029 ($ billion)
- Exhibits82: Chart on Men - Year-over-year growth 2024-2029 (%)
- Exhibits83: Data Table on Men - Year-over-year growth 2024-2029 (%)
- Exhibits84: Chart on Unisex - Market size and forecast 2024-2029 ($ billion)
- Exhibits85: Data Table on Unisex - Market size and forecast 2024-2029 ($ billion)
- Exhibits86: Chart on Unisex - Year-over-year growth 2024-2029 (%)
- Exhibits87: Data Table on Unisex - Year-over-year growth 2024-2029 (%)
- Exhibits88: Market opportunity by Gender ($ billion)
- Exhibits89: Data Table on Market opportunity by Gender ($ billion)
- Exhibits90: Chart on Type - Market share 2024-2029 (%)
- Exhibits91: Data Table on Type - Market share 2024-2029 (%)
- Exhibits92: Chart on Comparison by Type
- Exhibits93: Data Table on Comparison by Type
- Exhibits94: Chart on Corded - Market size and forecast 2024-2029 ($ billion)
- Exhibits95: Data Table on Corded - Market size and forecast 2024-2029 ($ billion)
- Exhibits96: Chart on Corded - Year-over-year growth 2024-2029 (%)
- Exhibits97: Data Table on Corded - Year-over-year growth 2024-2029 (%)
- Exhibits98: Chart on Cordless - Market size and forecast 2024-2029 ($ billion)
- Exhibits99: Data Table on Cordless - Market size and forecast 2024-2029 ($ billion)
- Exhibits100: Chart on Cordless - Year-over-year growth 2024-2029 (%)
- Exhibits101: Data Table on Cordless - Year-over-year growth 2024-2029 (%)
- Exhibits102: Market opportunity by Type ($ billion)
- Exhibits103: Data Table on Market opportunity by Type ($ billion)
- Exhibits104: Analysis of price sensitivity, lifecycle, customer purchase basket, adoption rates, and purchase criteria
- Exhibits105: Chart on Market share By Geographical Landscape 2024-2029 (%)
- Exhibits106: Data Table on Market share By Geographical Landscape 2024-2029 (%)
- Exhibits107: Chart on Geographic comparison
- Exhibits108: Data Table on Geographic comparison
- Exhibits109: Chart on APAC - Market size and forecast 2024-2029 ($ billion)
- Exhibits110: Data Table on APAC - Market size and forecast 2024-2029 ($ billion)
- Exhibits111: Chart on APAC - Year-over-year growth 2024-2029 (%)
- Exhibits112: Data Table on APAC - Year-over-year growth 2024-2029 (%)
- Exhibits113: Chart on Europe - Market size and forecast 2024-2029 ($ billion)
- Exhibits114: Data Table on Europe - Market size and forecast 2024-2029 ($ billion)
- Exhibits115: Chart on Europe - Year-over-year growth 2024-2029 (%)
- Exhibits116: Data Table on Europe - Year-over-year growth 2024-2029 (%)
- Exhibits117: Chart on North America - Market size and forecast 2024-2029 ($ billion)
- Exhibits118: Data Table on North America - Market size and forecast 2024-2029 ($ billion)
- Exhibits119: Chart on North America - Year-over-year growth 2024-2029 (%)
- Exhibits120: Data Table on North America - Year-over-year growth 2024-2029 (%)
- Exhibits121: Chart on South America - Market size and forecast 2024-2029 ($ billion)
- Exhibits122: Data Table on South America - Market size and forecast 2024-2029 ($ billion)
- Exhibits123: Chart on South America - Year-over-year growth 2024-2029 (%)
- Exhibits124: Data Table on South America - Year-over-year growth 2024-2029 (%)
- Exhibits125: Chart on Middle East and Africa - Market size and forecast 2024-2029 ($ billion)
- Exhibits126: Data Table on Middle East and Africa - Market size and forecast 2024-2029 ($ billion)
- Exhibits127: Chart on Middle East and Africa - Year-over-year growth 2024-2029 (%)
- Exhibits128: Data Table on Middle East and Africa - Year-over-year growth 2024-2029 (%)
- Exhibits129: Chart on US - Market size and forecast 2024-2029 ($ billion)
- Exhibits130: Data Table on US - Market size and forecast 2024-2029 ($ billion)
- Exhibits131: Chart on US - Year-over-year growth 2024-2029 (%)
- Exhibits132: Data Table on US - Year-over-year growth 2024-2029 (%)
- Exhibits133: Chart on China - Market size and forecast 2024-2029 ($ billion)
- Exhibits134: Data Table on China - Market size and forecast 2024-2029 ($ billion)
- Exhibits135: Chart on China - Year-over-year growth 2024-2029 (%)
- Exhibits136: Data Table on China - Year-over-year growth 2024-2029 (%)
- Exhibits137: Chart on Japan - Market size and forecast 2024-2029 ($ billion)
- Exhibits138: Data Table on Japan - Market size and forecast 2024-2029 ($ billion)
- Exhibits139: Chart on Japan - Year-over-year growth 2024-2029 (%)
- Exhibits140: Data Table on Japan - Year-over-year growth 2024-2029 (%)
- Exhibits141: Chart on India - Market size and forecast 2024-2029 ($ billion)
- Exhibits142: Data Table on India - Market size and forecast 2024-2029 ($ billion)
- Exhibits143: Chart on India - Year-over-year growth 2024-2029 (%)
- Exhibits144: Data Table on India - Year-over-year growth 2024-2029 (%)
- Exhibits145: Chart on UK - Market size and forecast 2024-2029 ($ billion)
- Exhibits146: Data Table on UK - Market size and forecast 2024-2029 ($ billion)
- Exhibits147: Chart on UK - Year-over-year growth 2024-2029 (%)
- Exhibits148: Data Table on UK - Year-over-year growth 2024-2029 (%)
- Exhibits149: Chart on Germany - Market size and forecast 2024-2029 ($ billion)
- Exhibits150: Data Table on Germany - Market size and forecast 2024-2029 ($ billion)
- Exhibits151: Chart on Germany - Year-over-year growth 2024-2029 (%)
- Exhibits152: Data Table on Germany - Year-over-year growth 2024-2029 (%)
- Exhibits153: Chart on South Korea - Market size and forecast 2024-2029 ($ billion)
- Exhibits154: Data Table on South Korea - Market size and forecast 2024-2029 ($ billion)
- Exhibits155: Chart on South Korea - Year-over-year growth 2024-2029 (%)
- Exhibits156: Data Table on South Korea - Year-over-year growth 2024-2029 (%)
- Exhibits157: Chart on Canada - Market size and forecast 2024-2029 ($ billion)
- Exhibits158: Data Table on Canada - Market size and forecast 2024-2029 ($ billion)
- Exhibits159: Chart on Canada - Year-over-year growth 2024-2029 (%)
- Exhibits160: Data Table on Canada - Year-over-year growth 2024-2029 (%)
- Exhibits161: Chart on France - Market size and forecast 2024-2029 ($ billion)
- Exhibits162: Data Table on France - Market size and forecast 2024-2029 ($ billion)
- Exhibits163: Chart on France - Year-over-year growth 2024-2029 (%)
- Exhibits164: Data Table on France - Year-over-year growth 2024-2029 (%)
- Exhibits165: Chart on Italy - Market size and forecast 2024-2029 ($ billion)
- Exhibits166: Data Table on Italy - Market size and forecast 2024-2029 ($ billion)
- Exhibits167: Chart on Italy - Year-over-year growth 2024-2029 (%)
- Exhibits168: Data Table on Italy - Year-over-year growth 2024-2029 (%)
- Exhibits169: Market opportunity By Geographical Landscape ($ billion)
- Exhibits170: Data Tables on Market opportunity By Geographical Landscape ($ billion)
- Exhibits171: Impact of drivers and challenges in 2024 and 2029
- Exhibits172: Overview on criticality of inputs and factors of differentiation
- Exhibits173: Overview on factors of disruption
- Exhibits174: Impact of key risks on business
- Exhibits175: Companies covered
- Exhibits176: Company ranking index
- Exhibits177: Matrix on companies position and classification
- Exhibits178: Amika LLC - Overview
- Exhibits179: Amika LLC - Product / Service
- Exhibits180: Amika LLC - Key offerings
- Exhibits181: SWOT
- Exhibits182: Andis Co. - Overview
- Exhibits183: Andis Co. - Product / Service
- Exhibits184: Andis Co. - Key offerings
- Exhibits185: SWOT
- Exhibits186: Beauty Quest Group - Overview
- Exhibits187: Beauty Quest Group - Product / Service
- Exhibits188: Beauty Quest Group - Key offerings
- Exhibits189: SWOT
- Exhibits190: Colgate Palmolive Co. - Overview
- Exhibits191: Colgate Palmolive Co. - Business segments
- Exhibits192: Colgate Palmolive Co. - Key offerings
- Exhibits193: Colgate Palmolive Co. - Segment focus
- Exhibits194: SWOT
- Exhibits195: Conair Corp. - Overview
- Exhibits196: Conair Corp. - Product / Service
- Exhibits197: Conair Corp. - Key offerings
- Exhibits198: SWOT
- Exhibits199: Coty Inc. - Overview
- Exhibits200: Coty Inc. - Business segments
- Exhibits201: Coty Inc. - Key news
- Exhibits202: Coty Inc. - Key offerings
- Exhibits203: Coty Inc. - Segment focus
- Exhibits204: SWOT
- Exhibits205: Drybar Holdings LLC - Overview
- Exhibits206: Drybar Holdings LLC - Product / Service
- Exhibits207: Drybar Holdings LLC - Key offerings
- Exhibits208: SWOT
- Exhibits209: Dyson Group Co. - Overview
- Exhibits210: Dyson Group Co. - Product / Service
- Exhibits211: Dyson Group Co. - Key offerings
- Exhibits212: SWOT
- Exhibits213: Elchim Spa - Overview
- Exhibits214: Elchim Spa - Product / Service
- Exhibits215: Elchim Spa - Key offerings
- Exhibits216: SWOT
- Exhibits217: FKA Distributing Co. LLC - Overview
- Exhibits218: FKA Distributing Co. LLC - Product / Service
- Exhibits219: FKA Distributing Co. LLC - Key offerings
- Exhibits220: SWOT
- Exhibits221: IkonicWorld - Overview
- Exhibits222: IkonicWorld - Product / Service
- Exhibits223: IkonicWorld - Key offerings
- Exhibits224: SWOT
- Exhibits225: Koninklijke Philips NV - Overview
- Exhibits226: Koninklijke Philips NV - Business segments
- Exhibits227: Koninklijke Philips NV - Key news
- Exhibits228: Koninklijke Philips NV - Key offerings
- Exhibits229: Koninklijke Philips NV - Segment focus
- Exhibits230: SWOT
- Exhibits231: Panasonic Holdings Corp. - Overview
- Exhibits232: Panasonic Holdings Corp. - Business segments
- Exhibits233: Panasonic Holdings Corp. - Key news
- Exhibits234: Panasonic Holdings Corp. - Key offerings
- Exhibits235: Panasonic Holdings Corp. - Segment focus
- Exhibits236: SWOT
- Exhibits237: The Procter and Gamble Co. - Overview
- Exhibits238: The Procter and Gamble Co. - Business segments
- Exhibits239: The Procter and Gamble Co. - Key offerings
- Exhibits240: The Procter and Gamble Co. - Segment focus
- Exhibits241: SWOT
- Exhibits242: Wahl Clipper Corp. - Overview
- Exhibits243: Wahl Clipper Corp. - Product / Service
- Exhibits244: Wahl Clipper Corp. - Key offerings
- Exhibits245: SWOT
- Exhibits246: Inclusions checklist
- Exhibits247: Exclusions checklist
- Exhibits248: Currency conversion rates for US$
- Exhibits249: Research methodology
- Exhibits250: Information sources
- Exhibits251: Data validation
- Exhibits252: Validation techniques employed for market sizing
- Exhibits253: Data synthesis
- Exhibits254: 360 degree market analysis
- Exhibits255: List of abbreviations
The personal care appliances market is forecasted to grow by USD 7.69 billion during 2024-2029, accelerating at a CAGR of 6.2% during the forecast period. The report on the personal care appliances market provides a holistic analysis, market size and forecast, trends, growth drivers, and challenges, as well as vendor analysis covering around 25 vendors.
The report offers an up-to-date analysis regarding the current market scenario, the latest trends and drivers, and the overall market environment. The market is driven by product innovations leading to portfolio extension and product premiumization, rise in discretionary income of consumers, and evolving fashion trends in personal grooming.
| Market Scope | |
|---|---|
| Base Year | 2025 |
| End Year | 2029 |
| Series Year | 2025-2029 |
| Growth Momentum | Accelerate |
| YOY 2025 | 5.5% |
| CAGR | 6.2% |
| Incremental Value | $7.69 bn |
The study was conducted using an objective combination of primary and secondary information including inputs from key participants in the industry. The report contains a comprehensive market size data, segment with regional analysis and vendor landscape in addition to an analysis of the key companies. Reports have historic and forecast data.
Technavio's personal care appliances market is segmented as below:
By Distribution Channel
- Offline
- Online
By Product
- Hair care appliances
- Hair removal appliances
- Oral care appliances
By Gender
- Women
- Men
- Unisex
By Type
- Corded
- Cordless
By Geographical Landscape
- APAC
- Europe
- North America
- South America
- Middle East and Africa
This study identifies the new product launches in global personal care appliances market as one of the prime reasons driving the personal care appliances market growth during the next few years. Also, rise in online sales of personal care appliances and use of social media marketing to increase sales of personal care appliances will lead to sizable demand in the market.
The report on the personal care appliances market covers the following areas:
- Personal Care Appliances Market sizing
- Personal Care Appliances Market forecast
- Personal Care Appliances Market industry analysis
The robust vendor analysis is designed to help clients improve their market position, and in line with this, this report provides a detailed analysis of several leading personal care appliances market vendors that include Amika LLC, Andis Co., Beauty Quest Group, Colgate Palmolive Co., Conair Corp., Coty Inc., Drybar Holdings LLC, Dyson Group Co., Elchim Spa, Farouk Systems Inc., FKA Distributing Co. LLC, IkonicWorld, Koninklijke Philips NV, Olivia Garden Int. Inc, Panasonic Holdings Corp., Spectrum Brands Holdings Inc., T3 Micro Inc., The Procter and Gamble Co., Velecta Paramount, and Wahl Clipper Corp.. Also, the personal care appliances market analysis report includes information on upcoming trends and challenges that will influence market growth. This is to help companies strategize and leverage all forthcoming growth opportunities.
The publisher presents a detailed picture of the market by the way of study, synthesis, and summation of data from multiple sources by an analysis of key parameters such as profit, pricing, competition, and promotions. It presents various market facets by identifying the key industry influencers. The data presented is comprehensive, reliable, and a result of extensive primary and secondary research. The market research reports provide a complete competitive landscape and an in-depth vendor selection methodology and analysis using qualitative and quantitative research to forecast accurate market growth.
Table of Contents
1 Executive Summary
- 1.1 Market overview
- Executive Summary - Chart on Market Overview
- Executive Summary - Data Table on Market Overview
- Executive Summary - Chart on Global Market Characteristics
- Executive Summary - Chart on Market By Geographical Landscape
- Executive Summary - Chart on Market Segmentation by Distribution Channel
- Executive Summary - Chart on Market Segmentation by Product
- Executive Summary - Chart on Market Segmentation by Gender
- Executive Summary - Chart on Market Segmentation by Type
- Executive Summary - Chart on Incremental Growth
- Executive Summary - Data Table on Incremental Growth
- Executive Summary - Chart on Company Market Positioning
2 Technavio Analysis
- 2.1 Analysis of price sensitivity, lifecycle, customer purchase basket, adoption rates, and purchase criteria
- Analysis of price sensitivity, lifecycle, customer purchase basket, adoption rates, and purchase criteria
- 2.2 Criticality of inputs and Factors of differentiation
- Overview on criticality of inputs and factors of differentiation
- 2.3 Factors of disruption
- Overview on factors of disruption
- 2.4 Impact of drivers and challenges
- Impact of drivers and challenges in 2024 and 2029
3 Market Landscape
- 3.1 Market ecosystem
- Parent Market
- Data Table on - Parent Market
- 3.2 Market characteristics
- Market characteristics analysis
- 3.3 Value chain analysis
- Value chain analysis
4 Market Sizing
- 4.1 Market definition
- Offerings of companies included in the market definition
- 4.2 Market segment analysis
- Market segments
- 4.3 Market size 2024
- 4.4 Market outlook: Forecast for 2024-2029
- Chart on Global - Market size and forecast 2024-2029 ($ billion)
- Data Table on Global - Market size and forecast 2024-2029 ($ billion)
- Chart on Global Market: Year-over-year growth 2024-2029 (%)
- Data Table on Global Market: Year-over-year growth 2024-2029 (%)
5 Historic Market Size
- 5.1 Global Personal Care Appliances Market 2019 - 2023
- Historic Market Size - Data Table on Global Personal Care Appliances Market 2019 - 2023 ($ billion)
- 5.2 Distribution Channel segment analysis 2019 - 2023
- Historic Market Size - Distribution Channel Segment 2019 - 2023 ($ billion)
- 5.3 Product segment analysis 2019 - 2023
- Historic Market Size - Product Segment 2019 - 2023 ($ billion)
- 5.4 Gender segment analysis 2019 - 2023
- Historic Market Size - Gender Segment 2019 - 2023 ($ billion)
- 5.5 Type segment analysis 2019 - 2023
- Historic Market Size - Type Segment 2019 - 2023 ($ billion)
- 5.6 Geography segment analysis 2019 - 2023
- Historic Market Size - Geography Segment 2019 - 2023 ($ billion)
- 5.7 Country segment analysis 2019 - 2023
- Historic Market Size - Country Segment 2019 - 2023 ($ billion)
6 Qualitative Analysis
- 6.1 AI Impact on Global Personal Care Appliances Market
7 Five Forces Analysis
- 7.1 Five forces summary
- Five forces analysis - Comparison between 2024 and 2029
- 7.2 Bargaining power of buyers
- Bargaining power of buyers - Impact of key factors 2024 and 2029
- 7.3 Bargaining power of suppliers
- Bargaining power of suppliers - Impact of key factors in 2024 and 2029
- 7.4 Threat of new entrants
- Threat of new entrants - Impact of key factors in 2024 and 2029
- 7.5 Threat of substitutes
- Threat of substitutes - Impact of key factors in 2024 and 2029
- 7.6 Threat of rivalry
- Threat of rivalry - Impact of key factors in 2024 and 2029
- 7.7 Market condition
- Chart on Market condition - Five forces 2024 and 2029
8 Market Segmentation by Distribution Channel
- 8.1 Market segments
- Chart on Distribution Channel - Market share 2024-2029 (%)
- Data Table on Distribution Channel - Market share 2024-2029 (%)
- 8.2 Comparison by Distribution Channel
- Chart on Comparison by Distribution Channel
- Data Table on Comparison by Distribution Channel
- 8.3 Offline - Market size and forecast 2024-2029
- Chart on Offline - Market size and forecast 2024-2029 ($ billion)
- Data Table on Offline - Market size and forecast 2024-2029 ($ billion)
- Chart on Offline - Year-over-year growth 2024-2029 (%)
- Data Table on Offline - Year-over-year growth 2024-2029 (%)
- 8.4 Online - Market size and forecast 2024-2029
- Chart on Online - Market size and forecast 2024-2029 ($ billion)
- Data Table on Online - Market size and forecast 2024-2029 ($ billion)
- Chart on Online - Year-over-year growth 2024-2029 (%)
- Data Table on Online - Year-over-year growth 2024-2029 (%)
- 8.5 Market opportunity by Distribution Channel
- Market opportunity by Distribution Channel ($ billion)
- Data Table on Market opportunity by Distribution Channel ($ billion)
9 Market Segmentation by Product
- 9.1 Market segments
- Chart on Product - Market share 2024-2029 (%)
- Data Table on Product - Market share 2024-2029 (%)
- 9.2 Comparison by Product
- Chart on Comparison by Product
- Data Table on Comparison by Product
- 9.3 Hair care appliances - Market size and forecast 2024-2029
- Chart on Hair care appliances - Market size and forecast 2024-2029 ($ billion)
- Data Table on Hair care appliances - Market size and forecast 2024-2029 ($ billion)
- Chart on Hair care appliances - Year-over-year growth 2024-2029 (%)
- Data Table on Hair care appliances - Year-over-year growth 2024-2029 (%)
- 9.4 Hair removal appliances - Market size and forecast 2024-2029
- Chart on Hair removal appliances - Market size and forecast 2024-2029 ($ billion)
- Data Table on Hair removal appliances - Market size and forecast 2024-2029 ($ billion)
- Chart on Hair removal appliances - Year-over-year growth 2024-2029 (%)
- Data Table on Hair removal appliances - Year-over-year growth 2024-2029 (%)
- 9.5 Oral care appliances - Market size and forecast 2024-2029
- Chart on Oral care appliances - Market size and forecast 2024-2029 ($ billion)
- Data Table on Oral care appliances - Market size and forecast 2024-2029 ($ billion)
- Chart on Oral care appliances - Year-over-year growth 2024-2029 (%)
- Data Table on Oral care appliances - Year-over-year growth 2024-2029 (%)
- 9.6 Market opportunity by Product
- Market opportunity by Product ($ billion)
- Data Table on Market opportunity by Product ($ billion)
10 Market Segmentation by Gender
- 10.1 Market segments
- Chart on Gender - Market share 2024-2029 (%)
- Data Table on Gender - Market share 2024-2029 (%)
- 10.2 Comparison by Gender
- Chart on Comparison by Gender
- Data Table on Comparison by Gender
- 10.3 Women - Market size and forecast 2024-2029
- Chart on Women - Market size and forecast 2024-2029 ($ billion)
- Data Table on Women - Market size and forecast 2024-2029 ($ billion)
- Chart on Women - Year-over-year growth 2024-2029 (%)
- Data Table on Women - Year-over-year growth 2024-2029 (%)
- 10.4 Men - Market size and forecast 2024-2029
- Chart on Men - Market size and forecast 2024-2029 ($ billion)
- Data Table on Men - Market size and forecast 2024-2029 ($ billion)
- Chart on Men - Year-over-year growth 2024-2029 (%)
- Data Table on Men - Year-over-year growth 2024-2029 (%)
- 10.5 Unisex - Market size and forecast 2024-2029
- Chart on Unisex - Market size and forecast 2024-2029 ($ billion)
- Data Table on Unisex - Market size and forecast 2024-2029 ($ billion)
- Chart on Unisex - Year-over-year growth 2024-2029 (%)
- Data Table on Unisex - Year-over-year growth 2024-2029 (%)
- 10.6 Market opportunity by Gender
- Market opportunity by Gender ($ billion)
- Data Table on Market opportunity by Gender ($ billion)
11 Market Segmentation by Type
- 11.1 Market segments
- Chart on Type - Market share 2024-2029 (%)
- Data Table on Type - Market share 2024-2029 (%)
- 11.2 Comparison by Type
- Chart on Comparison by Type
- Data Table on Comparison by Type
- 11.3 Corded - Market size and forecast 2024-2029
- Chart on Corded - Market size and forecast 2024-2029 ($ billion)
- Data Table on Corded - Market size and forecast 2024-2029 ($ billion)
- Chart on Corded - Year-over-year growth 2024-2029 (%)
- Data Table on Corded - Year-over-year growth 2024-2029 (%)
- 11.4 Cordless - Market size and forecast 2024-2029
- Chart on Cordless - Market size and forecast 2024-2029 ($ billion)
- Data Table on Cordless - Market size and forecast 2024-2029 ($ billion)
- Chart on Cordless - Year-over-year growth 2024-2029 (%)
- Data Table on Cordless - Year-over-year growth 2024-2029 (%)
- 11.5 Market opportunity by Type
- Market opportunity by Type ($ billion)
- Data Table on Market opportunity by Type ($ billion)
12 Customer Landscape
- 12.1 Customer landscape overview
- Analysis of price sensitivity, lifecycle, customer purchase basket, adoption rates, and purchase criteria
13 Geographic Landscape
- 13.1 Geographic segmentation
- Chart on Market share By Geographical Landscape 2024-2029 (%)
- Data Table on Market share By Geographical Landscape 2024-2029 (%)
- 13.2 Geographic comparison
- Chart on Geographic comparison
- Data Table on Geographic comparison
- 13.3 APAC - Market size and forecast 2024-2029
- Chart on APAC - Market size and forecast 2024-2029 ($ billion)
- Data Table on APAC - Market size and forecast 2024-2029 ($ billion)
- Chart on APAC - Year-over-year growth 2024-2029 (%)
- Data Table on APAC - Year-over-year growth 2024-2029 (%)
- 13.4 Europe - Market size and forecast 2024-2029
- Chart on Europe - Market size and forecast 2024-2029 ($ billion)
- Data Table on Europe - Market size and forecast 2024-2029 ($ billion)
- Chart on Europe - Year-over-year growth 2024-2029 (%)
- Data Table on Europe - Year-over-year growth 2024-2029 (%)
- 13.5 North America - Market size and forecast 2024-2029
- Chart on North America - Market size and forecast 2024-2029 ($ billion)
- Data Table on North America - Market size and forecast 2024-2029 ($ billion)
- Chart on North America - Year-over-year growth 2024-2029 (%)
- Data Table on North America - Year-over-year growth 2024-2029 (%)
- 13.6 South America - Market size and forecast 2024-2029
- Chart on South America - Market size and forecast 2024-2029 ($ billion)
- Data Table on South America - Market size and forecast 2024-2029 ($ billion)
- Chart on South America - Year-over-year growth 2024-2029 (%)
- Data Table on South America - Year-over-year growth 2024-2029 (%)
- 13.7 Middle East and Africa - Market size and forecast 2024-2029
- Chart on Middle East and Africa - Market size and forecast 2024-2029 ($ billion)
- Data Table on Middle East and Africa - Market size and forecast 2024-2029 ($ billion)
- Chart on Middle East and Africa - Year-over-year growth 2024-2029 (%)
- Data Table on Middle East and Africa - Year-over-year growth 2024-2029 (%)
- 13.8 US - Market size and forecast 2024-2029
- Chart on US - Market size and forecast 2024-2029 ($ billion)
- Data Table on US - Market size and forecast 2024-2029 ($ billion)
- Chart on US - Year-over-year growth 2024-2029 (%)
- Data Table on US - Year-over-year growth 2024-2029 (%)
- 13.9 China - Market size and forecast 2024-2029
- Chart on China - Market size and forecast 2024-2029 ($ billion)
- Data Table on China - Market size and forecast 2024-2029 ($ billion)
- Chart on China - Year-over-year growth 2024-2029 (%)
- Data Table on China - Year-over-year growth 2024-2029 (%)
- 13.10 Japan - Market size and forecast 2024-2029
- Chart on Japan - Market size and forecast 2024-2029 ($ billion)
- Data Table on Japan - Market size and forecast 2024-2029 ($ billion)
- Chart on Japan - Year-over-year growth 2024-2029 (%)
- Data Table on Japan - Year-over-year growth 2024-2029 (%)
- 13.11 India - Market size and forecast 2024-2029
- Chart on India - Market size and forecast 2024-2029 ($ billion)
- Data Table on India - Market size and forecast 2024-2029 ($ billion)
- Chart on India - Year-over-year growth 2024-2029 (%)
- Data Table on India - Year-over-year growth 2024-2029 (%)
- 13.12 UK - Market size and forecast 2024-2029
- Chart on UK - Market size and forecast 2024-2029 ($ billion)
- Data Table on UK - Market size and forecast 2024-2029 ($ billion)
- Chart on UK - Year-over-year growth 2024-2029 (%)
- Data Table on UK - Year-over-year growth 2024-2029 (%)
- 13.13 Germany - Market size and forecast 2024-2029
- Chart on Germany - Market size and forecast 2024-2029 ($ billion)
- Data Table on Germany - Market size and forecast 2024-2029 ($ billion)
- Chart on Germany - Year-over-year growth 2024-2029 (%)
- Data Table on Germany - Year-over-year growth 2024-2029 (%)
- 13.14 South Korea - Market size and forecast 2024-2029
- Chart on South Korea - Market size and forecast 2024-2029 ($ billion)
- Data Table on South Korea - Market size and forecast 2024-2029 ($ billion)
- Chart on South Korea - Year-over-year growth 2024-2029 (%)
- Data Table on South Korea - Year-over-year growth 2024-2029 (%)
- 13.15 Canada - Market size and forecast 2024-2029
- Chart on Canada - Market size and forecast 2024-2029 ($ billion)
- Data Table on Canada - Market size and forecast 2024-2029 ($ billion)
- Chart on Canada - Year-over-year growth 2024-2029 (%)
- Data Table on Canada - Year-over-year growth 2024-2029 (%)
- 13.16 France - Market size and forecast 2024-2029
- Chart on France - Market size and forecast 2024-2029 ($ billion)
- Data Table on France - Market size and forecast 2024-2029 ($ billion)
- Chart on France - Year-over-year growth 2024-2029 (%)
- Data Table on France - Year-over-year growth 2024-2029 (%)
- 13.17 Italy - Market size and forecast 2024-2029
- Chart on Italy - Market size and forecast 2024-2029 ($ billion)
- Data Table on Italy - Market size and forecast 2024-2029 ($ billion)
- Chart on Italy - Year-over-year growth 2024-2029 (%)
- Data Table on Italy - Year-over-year growth 2024-2029 (%)
- 13.18 Market opportunity By Geographical Landscape
- Market opportunity By Geographical Landscape ($ billion)
- Data Tables on Market opportunity By Geographical Landscape ($ billion)
14 Drivers, Challenges, and Opportunity/Restraints
- 14.1 Market drivers
- 14.2 Market challenges
- 14.3 Impact of drivers and challenges
- Impact of drivers and challenges in 2024 and 2029
- 14.4 Market opportunities/restraints
15 Competitive Landscape
- 15.1 Overview
- 15.2 Competitive Landscape
- Overview on criticality of inputs and factors of differentiation
- 15.3 Landscape disruption
- Overview on factors of disruption
- 15.4 Industry risks
- Impact of key risks on business
16 Competitive Analysis
- 16.1 Companies profiled
- Companies covered
- 16.2 Company ranking index
- Company ranking index
- 16.3 Market positioning of companies
- Matrix on companies position and classification
- 16.4 Amika LLC
- Amika LLC - Overview
- Amika LLC - Product / Service
- Amika LLC - Key offerings
- SWOT
- 16.5 Andis Co.
- Andis Co. - Overview
- Andis Co. - Product / Service
- Andis Co. - Key offerings
- SWOT
- 16.6 Beauty Quest Group
- Beauty Quest Group - Overview
- Beauty Quest Group - Product / Service
- Beauty Quest Group - Key offerings
- SWOT
- 16.7 Colgate Palmolive Co.
- Colgate Palmolive Co. - Overview
- Colgate Palmolive Co. - Business segments
- Colgate Palmolive Co. - Key offerings
- Colgate Palmolive Co. - Segment focus
- SWOT
- 16.8 Conair Corp.
- Conair Corp. - Overview
- Conair Corp. - Product / Service
- Conair Corp. - Key offerings
- SWOT
- 16.9 Coty Inc.
- Coty Inc. - Overview
- Coty Inc. - Business segments
- Coty Inc. - Key news
- Coty Inc. - Key offerings
- Coty Inc. - Segment focus
- SWOT
- 16.10 Drybar Holdings LLC
- Drybar Holdings LLC - Overview
- Drybar Holdings LLC - Product / Service
- Drybar Holdings LLC - Key offerings
- SWOT
- 16.11 Dyson Group Co.
- Dyson Group Co. - Overview
- Dyson Group Co. - Product / Service
- Dyson Group Co. - Key offerings
- SWOT
- 16.12 Elchim Spa
- Elchim Spa - Overview
- Elchim Spa - Product / Service
- Elchim Spa - Key offerings
- SWOT
- 16.13 FKA Distributing Co. LLC
- FKA Distributing Co. LLC - Overview
- FKA Distributing Co. LLC - Product / Service
- FKA Distributing Co. LLC - Key offerings
- SWOT
- 16.14 IkonicWorld
- IkonicWorld - Overview
- IkonicWorld - Product / Service
- IkonicWorld - Key offerings
- SWOT
- 16.15 Koninklijke Philips NV
- Koninklijke Philips NV - Overview
- Koninklijke Philips NV - Business segments
- Koninklijke Philips NV - Key news
- Koninklijke Philips NV - Key offerings
- Koninklijke Philips NV - Segment focus
- SWOT
- 16.16 Panasonic Holdings Corp.
- Panasonic Holdings Corp. - Overview
- Panasonic Holdings Corp. - Business segments
- Panasonic Holdings Corp. - Key news
- Panasonic Holdings Corp. - Key offerings
- Panasonic Holdings Corp. - Segment focus
- SWOT
- 16.17 The Procter and Gamble Co.
- The Procter and Gamble Co. - Overview
- The Procter and Gamble Co. - Business segments
- The Procter and Gamble Co. - Key offerings
- The Procter and Gamble Co. - Segment focus
- SWOT
- 16.18 Wahl Clipper Corp.
- Wahl Clipper Corp. - Overview
- Wahl Clipper Corp. - Product / Service
- Wahl Clipper Corp. - Key offerings
- SWOT
17 Appendix
- 17.1 Scope of the report
- 17.2 Inclusions and exclusions checklist
- Inclusions checklist
- Exclusions checklist
- 17.3 Currency conversion rates for US$
- Currency conversion rates for US$
- 17.4 Research methodology
- Research methodology
- 17.5 Data procurement
- Information sources
- 17.6 Data validation
- Data validation
- 17.7 Validation techniques employed for market sizing
- Validation techniques employed for market sizing
- 17.8 Data synthesis
- Data synthesis
- 17.9 360 degree market analysis
- 360 degree market analysis
- 17.10 List of abbreviations
- List of abbreviations

