|
|
市場調査レポート
商品コード
1524803
トラック隊列走行システムの世界市場 2024-2028Global truck platooning system market 2024-2028 |
||||||

|
|||||||
カスタマイズ可能
|
|||||||

| トラック隊列走行システムの世界市場 2024-2028 |
|
出版日: 2024年07月03日
発行: TechNavio
ページ情報: 英文 158 Pages
納期: 即納可能
|

全表示
- 概要
- 図表
- 目次
トラック隊列走行システム市場は2023-2028年に22億4,610万米ドル、予測期間中のCAGRは77.99%で成長すると予測されています。
当レポートでは、トラック隊列走行システム市場の全体的な分析、市場規模・予測、動向、成長促進要因、課題、約25のベンダーを網羅したベンダー分析などを掲載しています。
現在の市場シナリオ、最新動向と促進要因、市場環境全体に関する最新分析を提供しています。市場は、車両による運行コストと燃料消費量の削減需要の増加、商用車販売の拡大、厳しい環境規制と交通安全に対する需要の高まりによって牽引されています。
| 市場範囲 | |
|---|---|
| 基準年 | 2024 |
| 終了年 | 2028 |
| 予測期間 | 2024-2028 |
| 成長モメンタム | 加速 |
| 前年比2024年 | 59.83% |
| CAGR | 77.99% |
| 増分額 | 22億4,610万米ドル |
本調査では、今後数年間のトラック隊列走行システム市場成長を牽引する主要因の1つとして、自動運転トラックの採用増加を挙げています。また、コネクテッドカーの需要増加やトラック隊列走行システムの最近の動向は、市場の大きな需要につながります。
目次
第1章 エグゼクティブサマリー
- 市場概要
第2章 市場情勢
- 市場エコシステム
- 市場の特徴
- バリューチェーン分析
第3章 市場規模の評価
- 市場の定義
- 市場セグメント分析
- 市場規模 2023
- 市場の見通し 2023-2028
第4章 市場規模実績
- 世界トラック隊列走行システム市場 2018-2022
- コンポーネント別セグメント分析 2018-2022
- 車両タイプ別セグメント分析 2018-2022
- 地域別セグメント分析 2018-2022
- 国別セグメント分析 2018-2022
第5章 ファイブフォース分析
- ファイブフォースの要約
- 買い手の交渉力
- 供給企業の交渉力
- 新規参入業者の脅威
- 代替品の脅威
- 競争の脅威
- 市況
第6章 市場セグメンテーション:コンポーネント別
- 市場セグメンテーション
- 比較:コンポーネント別
- ハードウェア:市場規模と予測 2023-2028
- ソフトウェア:市場規模と予測 2023-2028
- サービス:市場規模と予測 2023-2028
- 市場機会:コンポーネント別
第7章 市場セグメンテーション:車両タイプ別
- 市場セグメンテーション
- 比較:車両タイプ別
- 大型商用車(HCV):市場規模と予測 2023-2028
- 小型商用車:市場規模と予測 2023-2028
- 市場機会:車両タイプ別
第8章 顧客情勢
- 顧客情勢の概要
第9章 地域別情勢
- 地域別セグメンテーション
- 地域別比較
- 北米:市場規模と予測 2023-2028
- 欧州:市場規模と予測 2023-2028
- アジア太平洋:市場規模と予測 2023-2028
- 中東・アフリカ:市場規模と予測 2023-2028
- 南米:市場規模と予測 2023-2028
- 米国:市場規模と予測 2023-2028
- ドイツ:市場規模と予測 2023-2028
- 中国:市場規模と予測 2023-2028
- 英国:市場規模と予測 2023-2028
- カナダ:市場規模と予測 2023-2028
- 市場機会:地域情勢別
第10章 促進要因・課題・機会・抑制要因
- 市場促進要因
- 市場の課題
- 促進要因と課題の影響
- 市場の機会・抑制要因
第11章 競合情勢
- 概要
- 競合情勢
- 混乱の状況
- 業界のリスク
第12章 競合分析
- 企業プロファイル
- 企業の市場ポジショニング
- AB Volvo
- Aptiv Plc
- Continental AG
- Daimler Truck AG
- Iveco SpA
- PACCAR Inc.
- Peloton Technology Inc.
- Robert Bosch GmbH
- Toyota Tsusho Corp.
- Traton SE
- ZF Friedrichshafen AG
第13章 付録
Exhibits:
- Exhibits1: Executive Summary - Chart on Market Overview
- Exhibits2: Executive Summary - Data Table on Market Overview
- Exhibits3: Executive Summary - Chart on Global Market Characteristics
- Exhibits4: Executive Summary - Chart on Market By Geographical Landscape
- Exhibits5: Executive Summary - Chart on Market Segmentation by Component
- Exhibits6: Executive Summary - Chart on Market Segmentation by Vehicle Type
- Exhibits7: Executive Summary - Chart on Incremental Growth
- Exhibits8: Executive Summary - Data Table on Incremental Growth
- Exhibits9: Executive Summary - Chart on Company Market Positioning
- Exhibits10: Parent Market
- Exhibits11: Data Table on - Parent Market
- Exhibits12: Market characteristics analysis
- Exhibits13: Value Chain Analysis
- Exhibits14: Offerings of companies included in the market definition
- Exhibits15: Market segments
- Exhibits16: Chart on Global - Market size and forecast 2023-2028 ($ million)
- Exhibits17: Data Table on Global - Market size and forecast 2023-2028 ($ million)
- Exhibits18: Chart on Global Market: Year-over-year growth 2023-2028 (%)
- Exhibits19: Data Table on Global Market: Year-over-year growth 2023-2028 (%)
- Exhibits20: Historic Market Size - Data Table on Global Truck Platooning System Market 2018 - 2022 ($ million)
- Exhibits21: Historic Market Size - Component Segment 2018 - 2022 ($ million)
- Exhibits22: Historic Market Size - Vehicle Type Segment 2018 - 2022 ($ million)
- Exhibits23: Historic Market Size - Geography Segment 2018 - 2022 ($ million)
- Exhibits24: Historic Market Size - Country Segment 2018 - 2022 ($ million)
- Exhibits25: Five forces analysis - Comparison between 2023 and 2028
- Exhibits26: Bargaining power of buyers - Impact of key factors 2023 and 2028
- Exhibits27: Bargaining power of suppliers - Impact of key factors in 2023 and 2028
- Exhibits28: Threat of new entrants - Impact of key factors in 2023 and 2028
- Exhibits29: Threat of substitutes - Impact of key factors in 2023 and 2028
- Exhibits30: Threat of rivalry - Impact of key factors in 2023 and 2028
- Exhibits31: Chart on Market condition - Five forces 2023 and 2028
- Exhibits32: Chart on Component - Market share 2023-2028 (%)
- Exhibits33: Data Table on Component - Market share 2023-2028 (%)
- Exhibits34: Chart on Comparison by Component
- Exhibits35: Data Table on Comparison by Component
- Exhibits36: Chart on Hardware - Market size and forecast 2023-2028 ($ million)
- Exhibits37: Data Table on Hardware - Market size and forecast 2023-2028 ($ million)
- Exhibits38: Chart on Hardware - Year-over-year growth 2023-2028 (%)
- Exhibits39: Data Table on Hardware - Year-over-year growth 2023-2028 (%)
- Exhibits40: Chart on Software - Market size and forecast 2023-2028 ($ million)
- Exhibits41: Data Table on Software - Market size and forecast 2023-2028 ($ million)
- Exhibits42: Chart on Software - Year-over-year growth 2023-2028 (%)
- Exhibits43: Data Table on Software - Year-over-year growth 2023-2028 (%)
- Exhibits44: Chart on Services - Market size and forecast 2023-2028 ($ million)
- Exhibits45: Data Table on Services - Market size and forecast 2023-2028 ($ million)
- Exhibits46: Chart on Services - Year-over-year growth 2023-2028 (%)
- Exhibits47: Data Table on Services - Year-over-year growth 2023-2028 (%)
- Exhibits48: Market opportunity by Component ($ million)
- Exhibits49: Data Table on Market opportunity by Component ($ million)
- Exhibits50: Chart on Vehicle Type - Market share 2023-2028 (%)
- Exhibits51: Data Table on Vehicle Type - Market share 2023-2028 (%)
- Exhibits52: Chart on Comparison by Vehicle Type
- Exhibits53: Data Table on Comparison by Vehicle Type
- Exhibits54: Chart on HCV - Market size and forecast 2023-2028 ($ million)
- Exhibits55: Data Table on HCV - Market size and forecast 2023-2028 ($ million)
- Exhibits56: Chart on HCV - Year-over-year growth 2023-2028 (%)
- Exhibits57: Data Table on HCV - Year-over-year growth 2023-2028 (%)
- Exhibits58: Chart on LCV - Market size and forecast 2023-2028 ($ million)
- Exhibits59: Data Table on LCV - Market size and forecast 2023-2028 ($ million)
- Exhibits60: Chart on LCV - Year-over-year growth 2023-2028 (%)
- Exhibits61: Data Table on LCV - Year-over-year growth 2023-2028 (%)
- Exhibits62: Market opportunity by Vehicle Type ($ million)
- Exhibits63: Data Table on Market opportunity by Vehicle Type ($ million)
- Exhibits64: Analysis of price sensitivity, lifecycle, customer purchase basket, adoption rates, and purchase criteria
- Exhibits65: Chart on Market share By Geographical Landscape 2023-2028 (%)
- Exhibits66: Data Table on Market share By Geographical Landscape 2023-2028 (%)
- Exhibits67: Chart on Geographic comparison
- Exhibits68: Data Table on Geographic comparison
- Exhibits69: Chart on North America - Market size and forecast 2023-2028 ($ million)
- Exhibits70: Data Table on North America - Market size and forecast 2023-2028 ($ million)
- Exhibits71: Chart on North America - Year-over-year growth 2023-2028 (%)
- Exhibits72: Data Table on North America - Year-over-year growth 2023-2028 (%)
- Exhibits73: Chart on Europe - Market size and forecast 2023-2028 ($ million)
- Exhibits74: Data Table on Europe - Market size and forecast 2023-2028 ($ million)
- Exhibits75: Chart on Europe - Year-over-year growth 2023-2028 (%)
- Exhibits76: Data Table on Europe - Year-over-year growth 2023-2028 (%)
- Exhibits77: Chart on APAC - Market size and forecast 2023-2028 ($ million)
- Exhibits78: Data Table on APAC - Market size and forecast 2023-2028 ($ million)
- Exhibits79: Chart on APAC - Year-over-year growth 2023-2028 (%)
- Exhibits80: Data Table on APAC - Year-over-year growth 2023-2028 (%)
- Exhibits81: Chart on Middle East and Africa - Market size and forecast 2023-2028 ($ million)
- Exhibits82: Data Table on Middle East and Africa - Market size and forecast 2023-2028 ($ million)
- Exhibits83: Chart on Middle East and Africa - Year-over-year growth 2023-2028 (%)
- Exhibits84: Data Table on Middle East and Africa - Year-over-year growth 2023-2028 (%)
- Exhibits85: Chart on South America - Market size and forecast 2023-2028 ($ million)
- Exhibits86: Data Table on South America - Market size and forecast 2023-2028 ($ million)
- Exhibits87: Chart on South America - Year-over-year growth 2023-2028 (%)
- Exhibits88: Data Table on South America - Year-over-year growth 2023-2028 (%)
- Exhibits89: Chart on US - Market size and forecast 2023-2028 ($ million)
- Exhibits90: Data Table on US - Market size and forecast 2023-2028 ($ million)
- Exhibits91: Chart on US - Year-over-year growth 2023-2028 (%)
- Exhibits92: Data Table on US - Year-over-year growth 2023-2028 (%)
- Exhibits93: Chart on Germany - Market size and forecast 2023-2028 ($ million)
- Exhibits94: Data Table on Germany - Market size and forecast 2023-2028 ($ million)
- Exhibits95: Chart on Germany - Year-over-year growth 2023-2028 (%)
- Exhibits96: Data Table on Germany - Year-over-year growth 2023-2028 (%)
- Exhibits97: Chart on China - Market size and forecast 2023-2028 ($ million)
- Exhibits98: Data Table on China - Market size and forecast 2023-2028 ($ million)
- Exhibits99: Chart on China - Year-over-year growth 2023-2028 (%)
- Exhibits100: Data Table on China - Year-over-year growth 2023-2028 (%)
- Exhibits101: Chart on UK - Market size and forecast 2023-2028 ($ million)
- Exhibits102: Data Table on UK - Market size and forecast 2023-2028 ($ million)
- Exhibits103: Chart on UK - Year-over-year growth 2023-2028 (%)
- Exhibits104: Data Table on UK - Year-over-year growth 2023-2028 (%)
- Exhibits105: Chart on Canada - Market size and forecast 2023-2028 ($ million)
- Exhibits106: Data Table on Canada - Market size and forecast 2023-2028 ($ million)
- Exhibits107: Chart on Canada - Year-over-year growth 2023-2028 (%)
- Exhibits108: Data Table on Canada - Year-over-year growth 2023-2028 (%)
- Exhibits109: Market opportunity By Geographical Landscape ($ million)
- Exhibits110: Data Tables on Market opportunity By Geographical Landscape ($ million)
- Exhibits111: Impact of drivers and challenges in 2023 and 2028
- Exhibits112: Overview on criticality of inputs and factors of differentiation
- Exhibits113: Overview on factors of disruption
- Exhibits114: Impact of key risks on business
- Exhibits115: Companies covered
- Exhibits116: Matrix on companies position and classification
- Exhibits117: AB Volvo - Overview
- Exhibits118: AB Volvo - Business segments
- Exhibits119: AB Volvo - Key news
- Exhibits120: AB Volvo - Key offerings
- Exhibits121: AB Volvo - Segment focus
- Exhibits122: Aptiv Plc - Overview
- Exhibits123: Aptiv Plc - Business segments
- Exhibits124: Aptiv Plc - Key news
- Exhibits125: Aptiv Plc - Key offerings
- Exhibits126: Aptiv Plc - Segment focus
- Exhibits127: Continental AG - Overview
- Exhibits128: Continental AG - Business segments
- Exhibits129: Continental AG - Key news
- Exhibits130: Continental AG - Key offerings
- Exhibits131: Continental AG - Segment focus
- Exhibits132: Daimler Truck AG - Overview
- Exhibits133: Daimler Truck AG - Business segments
- Exhibits134: Daimler Truck AG - Key news
- Exhibits135: Daimler Truck AG - Key offerings
- Exhibits136: Daimler Truck AG - Segment focus
- Exhibits137: Iveco SpA - Overview
- Exhibits138: Iveco SpA - Product / Service
- Exhibits139: Iveco SpA - Key offerings
- Exhibits140: PACCAR Inc. - Overview
- Exhibits141: PACCAR Inc. - Business segments
- Exhibits142: PACCAR Inc. - Key news
- Exhibits143: PACCAR Inc. - Key offerings
- Exhibits144: PACCAR Inc. - Segment focus
- Exhibits145: Peloton Technology Inc. - Overview
- Exhibits146: Peloton Technology Inc. - Product / Service
- Exhibits147: Peloton Technology Inc. - Key offerings
- Exhibits148: Robert Bosch GmbH - Overview
- Exhibits149: Robert Bosch GmbH - Product / Service
- Exhibits150: Robert Bosch GmbH - Key news
- Exhibits151: Robert Bosch GmbH - Key offerings
- Exhibits152: Toyota Tsusho Corp. - Overview
- Exhibits153: Toyota Tsusho Corp. - Business segments
- Exhibits154: Toyota Tsusho Corp. - Key news
- Exhibits155: Toyota Tsusho Corp. - Key offerings
- Exhibits156: Toyota Tsusho Corp. - Segment focus
- Exhibits157: Traton SE - Overview
- Exhibits158: Traton SE - Business segments
- Exhibits159: Traton SE - Key offerings
- Exhibits160: Traton SE - Segment focus
- Exhibits161: ZF Friedrichshafen AG - Overview
- Exhibits162: ZF Friedrichshafen AG - Business segments
- Exhibits163: ZF Friedrichshafen AG - Key news
- Exhibits164: ZF Friedrichshafen AG - Key offerings
- Exhibits165: ZF Friedrichshafen AG - Segment focus
- Exhibits166: Inclusions checklist
- Exhibits167: Exclusions checklist
- Exhibits168: Currency conversion rates for US$
- Exhibits169: Research methodology
- Exhibits170: Information sources
- Exhibits171: Data validation
- Exhibits172: Validation techniques employed for market sizing
- Exhibits173: Data synthesis
- Exhibits174: 360 degree market analysis
- Exhibits175: List of abbreviations
The truck platooning system market is forecasted to grow by USD 2246.1 mn during 2023-2028, accelerating at a CAGR of 77.99% during the forecast period. The report on the truck platooning system market provides a holistic analysis, market size and forecast, trends, growth drivers, and challenges, as well as vendor analysis covering around 25 vendors.
The report offers an up-to-date analysis regarding the current market scenario, the latest trends and drivers, and the overall market environment. The market is driven by increase in demand to reduce operating cost and fuel consumption by fleet, growing sales of commercial vehicles, and stringent environmental regulations and rising demand for road safety.
Technavio's truck platooning system market is segmented as below:
| Market Scope | |
|---|---|
| Base Year | 2024 |
| End Year | 2028 |
| Series Year | 2024-2028 |
| Growth Momentum | Accelerate |
| YOY 2024 | 59.83% |
| CAGR | 77.99% |
| Incremental Value | $2246.1mn |
By Component
- Hardware
- Software
- Services
By Vehicle Type
- HCV
- LCV
By Geographical Landscape
- North America
- Europe
- APAC
- Middle East and Africa
- South America
This study identifies the increase in adoption of self-driving trucks as one of the prime reasons driving the truck platooning system market growth during the next few years. Also, increase in demand for connected vehicles and recent developments in truck platooning system will lead to sizable demand in the market.
The report on the truck platooning system market covers the following areas:
- Truck platooning system market sizing
- Truck platooning system market forecast
- Truck platooning system market industry analysis
The robust vendor analysis is designed to help clients improve their market position, and in line with this, this report provides a detailed analysis of several leading truck platooning system market vendors that include AB Volvo, Aptiv PLC, Continental AG, Daimler Truck AG, Iveco SpA, PACCAR Inc., Peloton Technology Inc., Robert Bosch GmbH, Toyota Tsusho Corp., Traton SE, and ZF Friedrichshafen AG. Also, the truck platooning system market analysis report includes information on upcoming trends and challenges that will influence market growth. This is to help companies strategize and leverage all forthcoming growth opportunities.
The study was conducted using an objective combination of primary and secondary information including inputs from key participants in the industry. The report contains a comprehensive market and vendor landscape in addition to an analysis of the key vendors.
The publisher presents a detailed picture of the market by the way of study, synthesis, and summation of data from multiple sources by an analysis of key parameters such as profit, pricing, competition, and promotions. It presents various market facets by identifying the key industry influencers. The data presented is comprehensive, reliable, and a result of extensive research - both primary and secondary. The market research reports provide a complete competitive landscape and an in-depth vendor selection methodology and analysis using qualitative and quantitative research to forecast the accurate market growth.
Table of Contents
1 Executive Summary
- 1.1 Market overview
- Executive Summary - Chart on Market Overview
- Executive Summary - Data Table on Market Overview
- Executive Summary - Chart on Global Market Characteristics
- Executive Summary - Chart on Market By Geographical Landscape
- Executive Summary - Chart on Market Segmentation by Component
- Executive Summary - Chart on Market Segmentation by Vehicle Type
- Executive Summary - Chart on Incremental Growth
- Executive Summary - Data Table on Incremental Growth
- Executive Summary - Chart on Company Market Positioning
2 Market Landscape
- 2.1 Market ecosystem
- Parent Market
- Data Table on - Parent Market
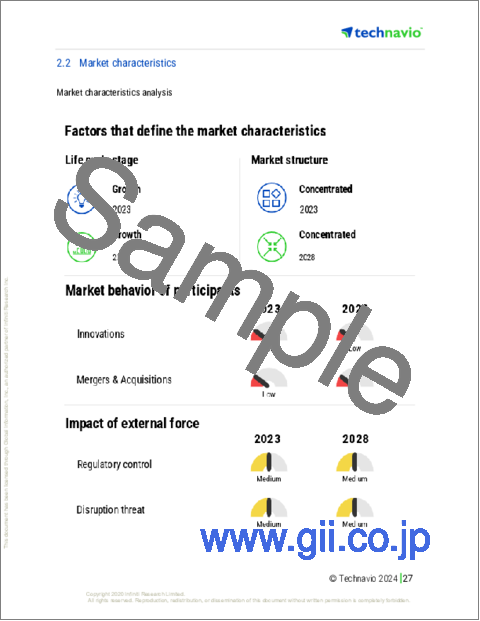
- 2.2 Market characteristics
- Market characteristics analysis
- 2.3 Value chain analysis
- Value Chain Analysis
3 Market Sizing
- 3.1 Market definition
- Offerings of companies included in the market definition
- 3.2 Market segment analysis
- Market segments
- 3.3 Market size 2023
- 3.4 Market outlook: Forecast for 2023-2028
- Chart on Global - Market size and forecast 2023-2028 ($ million)
- Data Table on Global - Market size and forecast 2023-2028 ($ million)
- Chart on Global Market: Year-over-year growth 2023-2028 (%)
- Data Table on Global Market: Year-over-year growth 2023-2028 (%)
4 Historic Market Size
- 4.1 Global Truck Platooning System Market 2018 - 2022
- Historic Market Size - Data Table on Global Truck Platooning System Market 2018 - 2022 ($ million)
- 4.2 Component segment analysis 2018 - 2022
- Historic Market Size - Component Segment 2018 - 2022 ($ million)
- 4.3 Vehicle Type segment analysis 2018 - 2022
- Historic Market Size - Vehicle Type Segment 2018 - 2022 ($ million)
- 4.4 Geography segment analysis 2018 - 2022
- Historic Market Size - Geography Segment 2018 - 2022 ($ million)
- 4.5 Country segment analysis 2018 - 2022
- Historic Market Size - Country Segment 2018 - 2022 ($ million)
5 Five Forces Analysis
- 5.1 Five forces summary
- Five forces analysis - Comparison between 2023 and 2028
- 5.2 Bargaining power of buyers
- Bargaining power of buyers - Impact of key factors 2023 and 2028
- 5.3 Bargaining power of suppliers
- Bargaining power of suppliers - Impact of key factors in 2023 and 2028
- 5.4 Threat of new entrants
- Threat of new entrants - Impact of key factors in 2023 and 2028
- 5.5 Threat of substitutes
- Threat of substitutes - Impact of key factors in 2023 and 2028
- 5.6 Threat of rivalry
- Threat of rivalry - Impact of key factors in 2023 and 2028
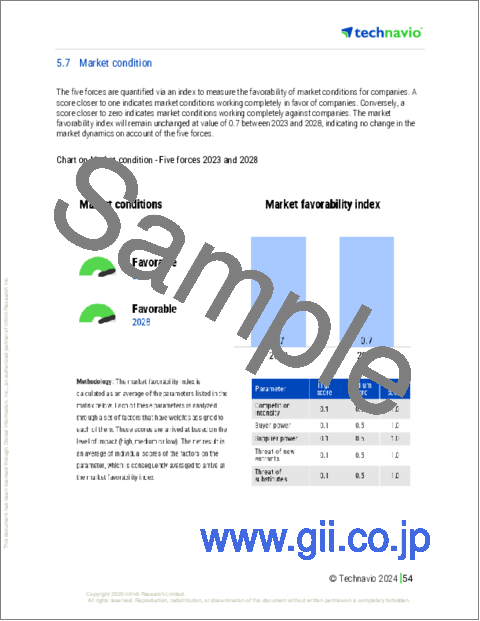
- 5.7 Market condition
- Chart on Market condition - Five forces 2023 and 2028
6 Market Segmentation by Component
- 6.1 Market segments
- Chart on Component - Market share 2023-2028 (%)
- Data Table on Component - Market share 2023-2028 (%)
- 6.2 Comparison by Component
- Chart on Comparison by Component
- Data Table on Comparison by Component
- 6.3 Hardware - Market size and forecast 2023-2028
- Chart on Hardware - Market size and forecast 2023-2028 ($ million)
- Data Table on Hardware - Market size and forecast 2023-2028 ($ million)
- Chart on Hardware - Year-over-year growth 2023-2028 (%)
- Data Table on Hardware - Year-over-year growth 2023-2028 (%)
- 6.4 Software - Market size and forecast 2023-2028
- Chart on Software - Market size and forecast 2023-2028 ($ million)
- Data Table on Software - Market size and forecast 2023-2028 ($ million)
- Chart on Software - Year-over-year growth 2023-2028 (%)
- Data Table on Software - Year-over-year growth 2023-2028 (%)
- 6.5 Services - Market size and forecast 2023-2028
- Chart on Services - Market size and forecast 2023-2028 ($ million)
- Data Table on Services - Market size and forecast 2023-2028 ($ million)
- Chart on Services - Year-over-year growth 2023-2028 (%)
- Data Table on Services - Year-over-year growth 2023-2028 (%)
- 6.6 Market opportunity by Component
- Market opportunity by Component ($ million)
- Data Table on Market opportunity by Component ($ million)
7 Market Segmentation by Vehicle Type
- 7.1 Market segments
- Chart on Vehicle Type - Market share 2023-2028 (%)
- Data Table on Vehicle Type - Market share 2023-2028 (%)
- 7.2 Comparison by Vehicle Type
- Chart on Comparison by Vehicle Type
- Data Table on Comparison by Vehicle Type
- 7.3 HCV - Market size and forecast 2023-2028
- Chart on HCV - Market size and forecast 2023-2028 ($ million)
- Data Table on HCV - Market size and forecast 2023-2028 ($ million)
- Chart on HCV - Year-over-year growth 2023-2028 (%)
- Data Table on HCV - Year-over-year growth 2023-2028 (%)
- 7.4 LCV - Market size and forecast 2023-2028
- Chart on LCV - Market size and forecast 2023-2028 ($ million)
- Data Table on LCV - Market size and forecast 2023-2028 ($ million)
- Chart on LCV - Year-over-year growth 2023-2028 (%)
- Data Table on LCV - Year-over-year growth 2023-2028 (%)
- 7.5 Market opportunity by Vehicle Type
- Market opportunity by Vehicle Type ($ million)
- Data Table on Market opportunity by Vehicle Type ($ million)
8 Customer Landscape
- 8.1 Customer landscape overview
- Analysis of price sensitivity, lifecycle, customer purchase basket, adoption rates, and purchase criteria
9 Geographic Landscape
- 9.1 Geographic segmentation
- Chart on Market share By Geographical Landscape 2023-2028 (%)
- Data Table on Market share By Geographical Landscape 2023-2028 (%)
- 9.2 Geographic comparison
- Chart on Geographic comparison
- Data Table on Geographic comparison
- 9.3 North America - Market size and forecast 2023-2028
- Chart on North America - Market size and forecast 2023-2028 ($ million)
- Data Table on North America - Market size and forecast 2023-2028 ($ million)
- Chart on North America - Year-over-year growth 2023-2028 (%)
- Data Table on North America - Year-over-year growth 2023-2028 (%)
- 9.4 Europe - Market size and forecast 2023-2028
- Chart on Europe - Market size and forecast 2023-2028 ($ million)
- Data Table on Europe - Market size and forecast 2023-2028 ($ million)
- Chart on Europe - Year-over-year growth 2023-2028 (%)
- Data Table on Europe - Year-over-year growth 2023-2028 (%)
- 9.5 APAC - Market size and forecast 2023-2028
- Chart on APAC - Market size and forecast 2023-2028 ($ million)
- Data Table on APAC - Market size and forecast 2023-2028 ($ million)
- Chart on APAC - Year-over-year growth 2023-2028 (%)
- Data Table on APAC - Year-over-year growth 2023-2028 (%)
- 9.6 Middle East and Africa - Market size and forecast 2023-2028
- Chart on Middle East and Africa - Market size and forecast 2023-2028 ($ million)
- Data Table on Middle East and Africa - Market size and forecast 2023-2028 ($ million)
- Chart on Middle East and Africa - Year-over-year growth 2023-2028 (%)
- Data Table on Middle East and Africa - Year-over-year growth 2023-2028 (%)
- 9.7 South America - Market size and forecast 2023-2028
- Chart on South America - Market size and forecast 2023-2028 ($ million)
- Data Table on South America - Market size and forecast 2023-2028 ($ million)
- Chart on South America - Year-over-year growth 2023-2028 (%)
- Data Table on South America - Year-over-year growth 2023-2028 (%)
- 9.8 US - Market size and forecast 2023-2028
- Chart on US - Market size and forecast 2023-2028 ($ million)
- Data Table on US - Market size and forecast 2023-2028 ($ million)
- Chart on US - Year-over-year growth 2023-2028 (%)
- Data Table on US - Year-over-year growth 2023-2028 (%)
- 9.9 Germany - Market size and forecast 2023-2028
- Chart on Germany - Market size and forecast 2023-2028 ($ million)
- Data Table on Germany - Market size and forecast 2023-2028 ($ million)
- Chart on Germany - Year-over-year growth 2023-2028 (%)
- Data Table on Germany - Year-over-year growth 2023-2028 (%)
- 9.10 China - Market size and forecast 2023-2028
- Chart on China - Market size and forecast 2023-2028 ($ million)
- Data Table on China - Market size and forecast 2023-2028 ($ million)
- Chart on China - Year-over-year growth 2023-2028 (%)
- Data Table on China - Year-over-year growth 2023-2028 (%)
- 9.11 UK - Market size and forecast 2023-2028
- Chart on UK - Market size and forecast 2023-2028 ($ million)
- Data Table on UK - Market size and forecast 2023-2028 ($ million)
- Chart on UK - Year-over-year growth 2023-2028 (%)
- Data Table on UK - Year-over-year growth 2023-2028 (%)
- 9.12 Canada - Market size and forecast 2023-2028
- Chart on Canada - Market size and forecast 2023-2028 ($ million)
- Data Table on Canada - Market size and forecast 2023-2028 ($ million)
- Chart on Canada - Year-over-year growth 2023-2028 (%)
- Data Table on Canada - Year-over-year growth 2023-2028 (%)
- 9.13 Market opportunity By Geographical Landscape
- Market opportunity By Geographical Landscape ($ million)
- Data Tables on Market opportunity By Geographical Landscape ($ million)
10 Drivers, Challenges, and Opportunity/Restraints
- 10.1 Market drivers
- 10.2 Market challenges
- 10.3 Impact of drivers and challenges
- Impact of drivers and challenges in 2023 and 2028
- 10.4 Market opportunities/restraints
11 Competitive Landscape
- 11.1 Overview
- 11.2 Competitive Landscape
- Overview on criticality of inputs and factors of differentiation
- 11.3 Landscape disruption
- Overview on factors of disruption
- 11.4 Industry risks
- Impact of key risks on business
12 Competitive Analysis
- 12.1 Companies profiled
- Companies covered
- 12.2 Market positioning of companies
- Matrix on companies position and classification
- 12.3 AB Volvo
- AB Volvo - Overview
- AB Volvo - Business segments
- AB Volvo - Key news
- AB Volvo - Key offerings
- AB Volvo - Segment focus
- 12.4 Aptiv Plc
- Aptiv Plc - Overview
- Aptiv Plc - Business segments
- Aptiv Plc - Key news
- Aptiv Plc - Key offerings
- Aptiv Plc - Segment focus
- 12.5 Continental AG
- Continental AG - Overview
- Continental AG - Business segments
- Continental AG - Key news
- Continental AG - Key offerings
- Continental AG - Segment focus
- 12.6 Daimler Truck AG
- Daimler Truck AG - Overview
- Daimler Truck AG - Business segments
- Daimler Truck AG - Key news
- Daimler Truck AG - Key offerings
- Daimler Truck AG - Segment focus
- 12.7 Iveco SpA
- Iveco SpA - Overview
- Iveco SpA - Product / Service
- Iveco SpA - Key offerings
- 12.8 PACCAR Inc.
- PACCAR Inc. - Overview
- PACCAR Inc. - Business segments
- PACCAR Inc. - Key news
- PACCAR Inc. - Key offerings
- PACCAR Inc. - Segment focus
- 12.9 Peloton Technology Inc.
- Peloton Technology Inc. - Overview
- Peloton Technology Inc. - Product / Service
- Peloton Technology Inc. - Key offerings
- 12.10 Robert Bosch GmbH
- Robert Bosch GmbH - Overview
- Robert Bosch GmbH - Product / Service
- Robert Bosch GmbH - Key news
- Robert Bosch GmbH - Key offerings
- 12.11 Toyota Tsusho Corp.
- Toyota Tsusho Corp. - Overview
- Toyota Tsusho Corp. - Business segments
- Toyota Tsusho Corp. - Key news
- Toyota Tsusho Corp. - Key offerings
- Toyota Tsusho Corp. - Segment focus
- 12.12 Traton SE
- Traton SE - Overview
- Traton SE - Business segments
- Traton SE - Key offerings
- Traton SE - Segment focus
- 12.13 ZF Friedrichshafen AG
- ZF Friedrichshafen AG - Overview
- ZF Friedrichshafen AG - Business segments
- ZF Friedrichshafen AG - Key news
- ZF Friedrichshafen AG - Key offerings
- ZF Friedrichshafen AG - Segment focus
13 Appendix
- 13.1 Scope of the report
- 13.2 Inclusions and exclusions checklist
- Inclusions checklist
- Exclusions checklist
- 13.3 Currency conversion rates for US$
- Currency conversion rates for US$
- 13.4 Research methodology
- Research methodology
- 13.5 Data procurement
- Information sources
- 13.6 Data validation
- Data validation
- 13.7 Validation techniques employed for market sizing
- Validation techniques employed for market sizing
- 13.8 Data synthesis
- Data synthesis
- 13.9 360 degree market analysis
- 360 degree market analysis
- 13.10 List of abbreviations
- List of abbreviations

