|
|
市場調査レポート
商品コード
1515770
軍事ロジスティクスの世界市場 2024-2028Global military logistics market 2024-2028 |
||||||

|
|||||||
カスタマイズ可能
|
|||||||


| 軍事ロジスティクスの世界市場 2024-2028 |
|
出版日: 2024年05月22日
発行: TechNavio
ページ情報: 英文 177 Pages
納期: 即納可能
|

全表示
- 概要
- 図表
- 目次
軍事ロジスティクス市場は2023-2028年に9億7,110万米ドル、予測期間中のCAGRは2.09%で成長すると予測されます。
当レポートでは、軍事ロジスティクス市場の全体的な分析、市場規模・予測、動向、成長促進要因、課題、約25のベンダーを網羅したベンダー分析などを掲載しています。
現在の市場シナリオ、最新動向と促進要因、市場環境全体に関する最新分析を提供しています。市場は、国際平和維持活動への需要の高まり、世界の軍事支出の増加、政情不安や紛争の増加によって牽引されています。
| 市場範囲 | |
|---|---|
| 基準年 | 2024 |
| 終了年 | 2028 |
| 予測期間 | 2024-2028 |
| 成長モメンタム | 加速 |
| 前年比2024年 | 2.03% |
| CAGR | 2.09% |
| 増分額 | 9億7,110万米ドル |
本調査では、今後数年間の軍事ロジスティクス市場成長を牽引する主な要因の1つとして、軍事作戦の世界化の進展を挙げています。また、軍事ロジスティクスにおける自動化と人工知能(AI)の利用の増加、軍とロジスティクス企業間の協力関係の拡大は、市場の大きな需要につながります。
目次
第1章 エグゼクティブサマリー
- 市場概要
第2章 市場情勢
- 市場エコシステム
- 市場の特徴
- バリューチェーン分析
第3章 市場規模の評価
- 市場の定義
- 市場セグメント分析
- 市場規模 2023
- 市場の見通し 2023-2028
第4章 市場規模実績
- 世界軍事ロジスティクス市場 2018-2022
- エンドユーザー別セグメント分析 2018-2022
- タイプ別セグメント分析 2018-2022
- 地域別セグメント分析 2018-2022
- 国別セグメント分析 2018-2022
第5章 ファイブフォース分析
- ファイブフォースの要約
- 買い手の交渉力
- 供給企業の交渉力
- 新規参入業者の脅威
- 代替品の脅威
- 競争の脅威
- 市況
第6章 市場セグメンテーション:エンドユーザー別
- 市場セグメンテーション
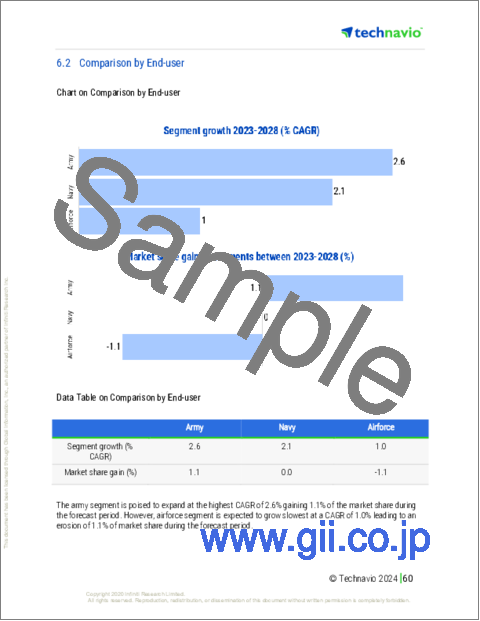
- 比較:エンドユーザー別
- 陸軍:市場規模と予測 2023-2028
- 海軍:市場規模と予測 2023-2028
- 空軍:市場規模と予測 2023-2028
- 市場機会:エンドユーザー別
第7章 市場セグメンテーション:タイプ別
- 市場セグメンテーション
- 比較:タイプ別
- 物流と流通:市場規模と予測 2023-2028
- 施設管理:市場規模と予測 2023-2028
- サービス:市場規模と予測 2023-2028
- 市場機会:タイプ別
第8章 顧客情勢
- 顧客情勢の概要
第9章 地域別情勢
- 地域別セグメンテーション
- 地域別比較
- 北米:市場規模と予測 2023-2028
- 欧州:市場規模と予測 2023-2028
- アジア太平洋:市場規模と予測 2023-2028
- 南米:市場規模と予測 2023-2028
- 中東・アフリカ:市場規模と予測 2023-2028
- 米国:市場規模と予測 2023-2028
- 中国:市場規模と予測 2023-2028
- インド:市場規模と予測 2023-2028
- ロシア:市場規模と予測 2023-2028
- フランス:市場規模と予測 2023-2028
- 市場機会:地域情勢別
第10章 促進要因・課題・機会・抑制要因
- 市場促進要因
- 市場の課題
- 促進要因と課題の影響
- 市場の機会・抑制要因
第11章 競合情勢
- 概要
- 競合情勢
- 混乱の状況
- 業界のリスク
第12章 競合分析
- 企業プロファイル
- 企業の市場ポジショニング
- AECOM
- Agility Public Warehousing Co. K.S.C.P
- Amentum Services Inc.
- Anham Fzco LLC
- BAE Systems Plc
- CACI International Inc.
- CLAXTON LOGISTICS SERVICES LLC
- CMA CGM SA Group
- Crowley Maritime Corp.
- Fluor Corp.
- General Dynamics Corp.
- KBR Inc.
- Lockheed Martin Corp.
- One Network Enterprises Inc.
- Thales Group
第13章 付録
Exhibits:
- Exhibits1: Executive Summary - Chart on Market Overview
- Exhibits2: Executive Summary - Data Table on Market Overview
- Exhibits3: Executive Summary - Chart on Global Market Characteristics
- Exhibits4: Executive Summary - Chart on Market By Geographical Landscape
- Exhibits5: Executive Summary - Chart on Market Segmentation by End-user
- Exhibits6: Executive Summary - Chart on Market Segmentation by Type
- Exhibits7: Executive Summary - Chart on Incremental Growth
- Exhibits8: Executive Summary - Data Table on Incremental Growth
- Exhibits9: Executive Summary - Chart on Company Market Positioning
- Exhibits10: Parent Market
- Exhibits11: Data Table on - Parent Market
- Exhibits12: Market characteristics analysis
- Exhibits13: Value Chain Analysis
- Exhibits14: Offerings of companies included in the market definition
- Exhibits15: Market segments
- Exhibits16: Chart on Global - Market size and forecast 2023-2028 ($ million)
- Exhibits17: Data Table on Global - Market size and forecast 2023-2028 ($ million)
- Exhibits18: Chart on Global Market: Year-over-year growth 2023-2028 (%)
- Exhibits19: Data Table on Global Market: Year-over-year growth 2023-2028 (%)
- Exhibits20: Historic Market Size - Data Table on Global Military Logistics Market 2018 - 2022 ($ million)
- Exhibits21: Historic Market Size - End-user Segment 2018 - 2022 ($ million)
- Exhibits22: Historic Market Size - Type Segment 2018 - 2022 ($ million)
- Exhibits23: Historic Market Size - Geography Segment 2018 - 2022 ($ million)
- Exhibits24: Historic Market Size - Country Segment 2018 - 2022 ($ million)
- Exhibits25: Five forces analysis - Comparison between 2023 and 2028
- Exhibits26: Bargaining power of buyers - Impact of key factors 2023 and 2028
- Exhibits27: Bargaining power of suppliers - Impact of key factors in 2023 and 2028
- Exhibits28: Threat of new entrants - Impact of key factors in 2023 and 2028
- Exhibits29: Threat of substitutes - Impact of key factors in 2023 and 2028
- Exhibits30: Threat of rivalry - Impact of key factors in 2023 and 2028
- Exhibits31: Chart on Market condition - Five forces 2023 and 2028
- Exhibits32: Chart on End-user - Market share 2023-2028 (%)
- Exhibits33: Data Table on End-user - Market share 2023-2028 (%)
- Exhibits34: Chart on Comparison by End-user
- Exhibits35: Data Table on Comparison by End-user
- Exhibits36: Chart on Army - Market size and forecast 2023-2028 ($ million)
- Exhibits37: Data Table on Army - Market size and forecast 2023-2028 ($ million)
- Exhibits38: Chart on Army - Year-over-year growth 2023-2028 (%)
- Exhibits39: Data Table on Army - Year-over-year growth 2023-2028 (%)
- Exhibits40: Chart on Navy - Market size and forecast 2023-2028 ($ million)
- Exhibits41: Data Table on Navy - Market size and forecast 2023-2028 ($ million)
- Exhibits42: Chart on Navy - Year-over-year growth 2023-2028 (%)
- Exhibits43: Data Table on Navy - Year-over-year growth 2023-2028 (%)
- Exhibits44: Chart on Airforce - Market size and forecast 2023-2028 ($ million)
- Exhibits45: Data Table on Airforce - Market size and forecast 2023-2028 ($ million)
- Exhibits46: Chart on Airforce - Year-over-year growth 2023-2028 (%)
- Exhibits47: Data Table on Airforce - Year-over-year growth 2023-2028 (%)
- Exhibits48: Market opportunity by End-user ($ million)
- Exhibits49: Data Table on Market opportunity by End-user ($ million)
- Exhibits50: Chart on Type - Market share 2023-2028 (%)
- Exhibits51: Data Table on Type - Market share 2023-2028 (%)
- Exhibits52: Chart on Comparison by Type
- Exhibits53: Data Table on Comparison by Type
- Exhibits54: Chart on Logistics and distribution - Market size and forecast 2023-2028 ($ million)
- Exhibits55: Data Table on Logistics and distribution - Market size and forecast 2023-2028 ($ million)
- Exhibits56: Chart on Logistics and distribution - Year-over-year growth 2023-2028 (%)
- Exhibits57: Data Table on Logistics and distribution - Year-over-year growth 2023-2028 (%)
- Exhibits58: Chart on Facility management - Market size and forecast 2023-2028 ($ million)
- Exhibits59: Data Table on Facility management - Market size and forecast 2023-2028 ($ million)
- Exhibits60: Chart on Facility management - Year-over-year growth 2023-2028 (%)
- Exhibits61: Data Table on Facility management - Year-over-year growth 2023-2028 (%)
- Exhibits62: Chart on Services - Market size and forecast 2023-2028 ($ million)
- Exhibits63: Data Table on Services - Market size and forecast 2023-2028 ($ million)
- Exhibits64: Chart on Services - Year-over-year growth 2023-2028 (%)
- Exhibits65: Data Table on Services - Year-over-year growth 2023-2028 (%)
- Exhibits66: Market opportunity by Type ($ million)
- Exhibits67: Data Table on Market opportunity by Type ($ million)
- Exhibits68: Analysis of price sensitivity, lifecycle, customer purchase basket, adoption rates, and purchase criteria
- Exhibits69: Chart on Market share By Geographical Landscape 2023-2028 (%)
- Exhibits70: Data Table on Market share By Geographical Landscape 2023-2028 (%)
- Exhibits71: Chart on Geographic comparison
- Exhibits72: Data Table on Geographic comparison
- Exhibits73: Chart on North America - Market size and forecast 2023-2028 ($ million)
- Exhibits74: Data Table on North America - Market size and forecast 2023-2028 ($ million)
- Exhibits75: Chart on North America - Year-over-year growth 2023-2028 (%)
- Exhibits76: Data Table on North America - Year-over-year growth 2023-2028 (%)
- Exhibits77: Chart on Europe - Market size and forecast 2023-2028 ($ million)
- Exhibits78: Data Table on Europe - Market size and forecast 2023-2028 ($ million)
- Exhibits79: Chart on Europe - Year-over-year growth 2023-2028 (%)
- Exhibits80: Data Table on Europe - Year-over-year growth 2023-2028 (%)
- Exhibits81: Chart on APAC - Market size and forecast 2023-2028 ($ million)
- Exhibits82: Data Table on APAC - Market size and forecast 2023-2028 ($ million)
- Exhibits83: Chart on APAC - Year-over-year growth 2023-2028 (%)
- Exhibits84: Data Table on APAC - Year-over-year growth 2023-2028 (%)
- Exhibits85: Chart on South America - Market size and forecast 2023-2028 ($ million)
- Exhibits86: Data Table on South America - Market size and forecast 2023-2028 ($ million)
- Exhibits87: Chart on South America - Year-over-year growth 2023-2028 (%)
- Exhibits88: Data Table on South America - Year-over-year growth 2023-2028 (%)
- Exhibits89: Chart on Middle East and Africa - Market size and forecast 2023-2028 ($ million)
- Exhibits90: Data Table on Middle East and Africa - Market size and forecast 2023-2028 ($ million)
- Exhibits91: Chart on Middle East and Africa - Year-over-year growth 2023-2028 (%)
- Exhibits92: Data Table on Middle East and Africa - Year-over-year growth 2023-2028 (%)
- Exhibits93: Chart on US - Market size and forecast 2023-2028 ($ million)
- Exhibits94: Data Table on US - Market size and forecast 2023-2028 ($ million)
- Exhibits95: Chart on US - Year-over-year growth 2023-2028 (%)
- Exhibits96: Data Table on US - Year-over-year growth 2023-2028 (%)
- Exhibits97: Chart on China - Market size and forecast 2023-2028 ($ million)
- Exhibits98: Data Table on China - Market size and forecast 2023-2028 ($ million)
- Exhibits99: Chart on China - Year-over-year growth 2023-2028 (%)
- Exhibits100: Data Table on China - Year-over-year growth 2023-2028 (%)
- Exhibits101: Chart on India - Market size and forecast 2023-2028 ($ million)
- Exhibits102: Data Table on India - Market size and forecast 2023-2028 ($ million)
- Exhibits103: Chart on India - Year-over-year growth 2023-2028 (%)
- Exhibits104: Data Table on India - Year-over-year growth 2023-2028 (%)
- Exhibits105: Chart on Russia - Market size and forecast 2023-2028 ($ million)
- Exhibits106: Data Table on Russia - Market size and forecast 2023-2028 ($ million)
- Exhibits107: Chart on Russia - Year-over-year growth 2023-2028 (%)
- Exhibits108: Data Table on Russia - Year-over-year growth 2023-2028 (%)
- Exhibits109: Chart on France - Market size and forecast 2023-2028 ($ million)
- Exhibits110: Data Table on France - Market size and forecast 2023-2028 ($ million)
- Exhibits111: Chart on France - Year-over-year growth 2023-2028 (%)
- Exhibits112: Data Table on France - Year-over-year growth 2023-2028 (%)
- Exhibits113: Market opportunity By Geographical Landscape ($ million)
- Exhibits114: Data Tables on Market opportunity By Geographical Landscape ($ million)
- Exhibits115: Impact of drivers and challenges in 2023 and 2028
- Exhibits116: Overview on criticality of inputs and factors of differentiation
- Exhibits117: Overview on factors of disruption
- Exhibits118: Impact of key risks on business
- Exhibits119: Companies covered
- Exhibits120: Matrix on companies position and classification
- Exhibits121: AECOM - Overview
- Exhibits122: AECOM - Business segments
- Exhibits123: AECOM - Key news
- Exhibits124: AECOM - Key offerings
- Exhibits125: AECOM - Segment focus
- Exhibits126: Agility Public Warehousing Co. K.S.C.P - Overview
- Exhibits127: Agility Public Warehousing Co. K.S.C.P - Business segments
- Exhibits128: Agility Public Warehousing Co. K.S.C.P - Key offerings
- Exhibits129: Agility Public Warehousing Co. K.S.C.P - Segment focus
- Exhibits130: Amentum Services Inc. - Overview
- Exhibits131: Amentum Services Inc. - Product / Service
- Exhibits132: Amentum Services Inc. - Key offerings
- Exhibits133: Anham Fzco LLC - Overview
- Exhibits134: Anham Fzco LLC - Product / Service
- Exhibits135: Anham Fzco LLC - Key offerings
- Exhibits136: BAE Systems Plc - Overview
- Exhibits137: BAE Systems Plc - Business segments
- Exhibits138: BAE Systems Plc - Key news
- Exhibits139: BAE Systems Plc - Key offerings
- Exhibits140: BAE Systems Plc - Segment focus
- Exhibits141: CACI International Inc. - Overview
- Exhibits142: CACI International Inc. - Business segments
- Exhibits143: CACI International Inc. - Key offerings
- Exhibits144: CACI International Inc. - Segment focus
- Exhibits145: CLAXTON LOGISTICS SERVICES LLC - Overview
- Exhibits146: CLAXTON LOGISTICS SERVICES LLC - Product / Service
- Exhibits147: CLAXTON LOGISTICS SERVICES LLC - Key offerings
- Exhibits148: CMA CGM SA Group - Overview
- Exhibits149: CMA CGM SA Group - Product / Service
- Exhibits150: CMA CGM SA Group - Key offerings
- Exhibits151: Crowley Maritime Corp. - Overview
- Exhibits152: Crowley Maritime Corp. - Product / Service
- Exhibits153: Crowley Maritime Corp. - Key offerings
- Exhibits154: Fluor Corp. - Overview
- Exhibits155: Fluor Corp. - Business segments
- Exhibits156: Fluor Corp. - Key news
- Exhibits157: Fluor Corp. - Key offerings
- Exhibits158: Fluor Corp. - Segment focus
- Exhibits159: General Dynamics Corp. - Overview
- Exhibits160: General Dynamics Corp. - Business segments
- Exhibits161: General Dynamics Corp. - Key news
- Exhibits162: General Dynamics Corp. - Key offerings
- Exhibits163: General Dynamics Corp. - Segment focus
- Exhibits164: KBR Inc. - Overview
- Exhibits165: KBR Inc. - Business segments
- Exhibits166: KBR Inc. - Key news
- Exhibits167: KBR Inc. - Key offerings
- Exhibits168: KBR Inc. - Segment focus
- Exhibits169: Lockheed Martin Corp. - Overview
- Exhibits170: Lockheed Martin Corp. - Business segments
- Exhibits171: Lockheed Martin Corp. - Key news
- Exhibits172: Lockheed Martin Corp. - Key offerings
- Exhibits173: Lockheed Martin Corp. - Segment focus
- Exhibits174: One Network Enterprises Inc. - Overview
- Exhibits175: One Network Enterprises Inc. - Product / Service
- Exhibits176: One Network Enterprises Inc. - Key offerings
- Exhibits177: Thales Group - Overview
- Exhibits178: Thales Group - Business segments
- Exhibits179: Thales Group - Key news
- Exhibits180: Thales Group - Key offerings
- Exhibits181: Thales Group - Segment focus
- Exhibits182: Inclusions checklist
- Exhibits183: Exclusions checklist
- Exhibits184: Currency conversion rates for US$
- Exhibits185: Research methodology
- Exhibits186: Information sources
- Exhibits187: Data validation
- Exhibits188: Validation techniques employed for market sizing
- Exhibits189: Data synthesis
- Exhibits190: 360 degree market analysis
- Exhibits191: List of abbreviations
The military logistics market is forecasted to grow by USD 971.1 mn during 2023-2028, accelerating at a CAGR of 2.09% during the forecast period. The report on the military logistics market provides a holistic analysis, market size and forecast, trends, growth drivers, and challenges, as well as vendor analysis covering around 25 vendors.
The report offers an up-to-date analysis regarding the current market scenario, the latest trends and drivers, and the overall market environment. The market is driven by growing demand for international peacekeeping operations, growing military spending globally, and growing political instability and conflicts.
Technavio's military logistics market is segmented as below:
| Market Scope | |
|---|---|
| Base Year | 2024 |
| End Year | 2028 |
| Series Year | 2024-2028 |
| Growth Momentum | Accelerate |
| YOY 2024 | 2.03% |
| CAGR | 2.09% |
| Incremental Value | $971.1mn |
ByEnd-user
- Army
- Navy
- Airforce
ByType
- Logistics and distribution
- Facility management
- Services
ByGeography
- North America
- Europe
- APAC
- South America
- Middle East and Africa
This study identifies the increasing globalization of military operations as one of the prime reasons driving the military logistics market growth during the next few years. Also, increasing use of automation and artificial intelligence (ai) in military logistics and growing collaboration between military forces and logistics companies will lead to sizable demand in the market.
The report on the military logistics market covers the following areas:
- Military logistics market sizing
- Military logistics market forecast
- Military logistics market industry analysis
The robust vendor analysis is designed to help clients improve their market position, and in line with this, this report provides a detailed analysis of several leading military logistics market vendors that include AECOM, Agility Public Warehousing Co. K.S.C.P, Amentum Services Inc., Anham Fzco LLC, BAE Systems Plc, CACI International Inc., CLAXTON LOGISTICS SERVICES LLC, CMA CGM SA Group, Colak Group, Crane Worldwide Logistics, Crowley Maritime Corp., Fluor Corp., General Dynamics Corp., KBR Inc., Lockheed Martin Corp., ManTech International Corp., One Network Enterprises Inc., SEKO Logistics, Thales Group, and Wincanton Plc. Also, the military logistics market analysis report includes information on upcoming trends and challenges that will influence market growth. This is to help companies strategize and leverage all forthcoming growth opportunities.
The study was conducted using an objective combination of primary and secondary information including inputs from key participants in the industry. The report contains a comprehensive market and vendor landscape in addition to an analysis of the key vendors.
The publisher presents a detailed picture of the market by the way of study, synthesis, and summation of data from multiple sources by an analysis of key parameters such as profit, pricing, competition, and promotions. It presents various market facets by identifying the key industry influencers. The data presented is comprehensive, reliable, and a result of extensive research - both primary and secondary. The market research reports provide a complete competitive landscape and an in-depth vendor selection methodology and analysis using qualitative and quantitative research to forecast the accurate market growth.
Table of Contents
1 Executive Summary
- 1.1 Market overview
- Executive Summary - Chart on Market Overview
- Executive Summary - Data Table on Market Overview
- Executive Summary - Chart on Global Market Characteristics
- Executive Summary - Chart on Market By Geographical Landscape
- Executive Summary - Chart on Market Segmentation by End-user
- Executive Summary - Chart on Market Segmentation by Type
- Executive Summary - Chart on Incremental Growth
- Executive Summary - Data Table on Incremental Growth
- Executive Summary - Chart on Company Market Positioning
2 Market Landscape
- 2.1 Market ecosystem
- Parent Market
- Data Table on - Parent Market
- 2.2 Market characteristics
- Market characteristics analysis
- 2.3 Value chain analysis
- Value Chain Analysis
3 Market Sizing
- 3.1 Market definition
- Offerings of companies included in the market definition
- 3.2 Market segment analysis
- Market segments
- 3.3 Market size 2023
- 3.4 Market outlook: Forecast for 2023-2028
- Chart on Global - Market size and forecast 2023-2028 ($ million)
- Data Table on Global - Market size and forecast 2023-2028 ($ million)
- Chart on Global Market: Year-over-year growth 2023-2028 (%)
- Data Table on Global Market: Year-over-year growth 2023-2028 (%)
4 Historic Market Size
- 4.1 Global Military Logistics Market 2018 - 2022
- Historic Market Size - Data Table on Global Military Logistics Market 2018 - 2022 ($ million)
- 4.2 End-user segment analysis 2018 - 2022
- Historic Market Size - End-user Segment 2018 - 2022 ($ million)
- 4.3 Type segment analysis 2018 - 2022
- Historic Market Size - Type Segment 2018 - 2022 ($ million)
- 4.4 Geography segment analysis 2018 - 2022
- Historic Market Size - Geography Segment 2018 - 2022 ($ million)
- 4.5 Country segment analysis 2018 - 2022
- Historic Market Size - Country Segment 2018 - 2022 ($ million)
5 Five Forces Analysis
- 5.1 Five forces summary
- Five forces analysis - Comparison between 2023 and 2028
- 5.2 Bargaining power of buyers
- Bargaining power of buyers - Impact of key factors 2023 and 2028
- 5.3 Bargaining power of suppliers
- Bargaining power of suppliers - Impact of key factors in 2023 and 2028
- 5.4 Threat of new entrants
- Threat of new entrants - Impact of key factors in 2023 and 2028
- 5.5 Threat of substitutes
- Threat of substitutes - Impact of key factors in 2023 and 2028
- 5.6 Threat of rivalry
- Threat of rivalry - Impact of key factors in 2023 and 2028
- 5.7 Market condition
- Chart on Market condition - Five forces 2023 and 2028
6 Market Segmentation by End-user
- 6.1 Market segments
- Chart on End-user - Market share 2023-2028 (%)
- Data Table on End-user - Market share 2023-2028 (%)
- 6.2 Comparison by End-user
- Chart on Comparison by End-user
- Data Table on Comparison by End-user
- 6.3 Army - Market size and forecast 2023-2028
- Chart on Army - Market size and forecast 2023-2028 ($ million)
- Data Table on Army - Market size and forecast 2023-2028 ($ million)
- Chart on Army - Year-over-year growth 2023-2028 (%)
- Data Table on Army - Year-over-year growth 2023-2028 (%)
- 6.4 Navy - Market size and forecast 2023-2028
- Chart on Navy - Market size and forecast 2023-2028 ($ million)
- Data Table on Navy - Market size and forecast 2023-2028 ($ million)
- Chart on Navy - Year-over-year growth 2023-2028 (%)
- Data Table on Navy - Year-over-year growth 2023-2028 (%)
- 6.5 Airforce - Market size and forecast 2023-2028
- Chart on Airforce - Market size and forecast 2023-2028 ($ million)
- Data Table on Airforce - Market size and forecast 2023-2028 ($ million)
- Chart on Airforce - Year-over-year growth 2023-2028 (%)
- Data Table on Airforce - Year-over-year growth 2023-2028 (%)
- 6.6 Market opportunity by End-user
- Market opportunity by End-user ($ million)
- Data Table on Market opportunity by End-user ($ million)
7 Market Segmentation by Type
- 7.1 Market segments
- Chart on Type - Market share 2023-2028 (%)
- Data Table on Type - Market share 2023-2028 (%)
- 7.2 Comparison by Type
- Chart on Comparison by Type
- Data Table on Comparison by Type
- 7.3 Logistics and distribution - Market size and forecast 2023-2028
- Chart on Logistics and distribution - Market size and forecast 2023-2028 ($ million)
- Data Table on Logistics and distribution - Market size and forecast 2023-2028 ($ million)
- Chart on Logistics and distribution - Year-over-year growth 2023-2028 (%)
- Data Table on Logistics and distribution - Year-over-year growth 2023-2028 (%)
- 7.4 Facility management - Market size and forecast 2023-2028
- Chart on Facility management - Market size and forecast 2023-2028 ($ million)
- Data Table on Facility management - Market size and forecast 2023-2028 ($ million)
- Chart on Facility management - Year-over-year growth 2023-2028 (%)
- Data Table on Facility management - Year-over-year growth 2023-2028 (%)
- 7.5 Services - Market size and forecast 2023-2028
- Chart on Services - Market size and forecast 2023-2028 ($ million)
- Data Table on Services - Market size and forecast 2023-2028 ($ million)
- Chart on Services - Year-over-year growth 2023-2028 (%)
- Data Table on Services - Year-over-year growth 2023-2028 (%)
- 7.6 Market opportunity by Type
- Market opportunity by Type ($ million)
- Data Table on Market opportunity by Type ($ million)
8 Customer Landscape
- 8.1 Customer landscape overview
- Analysis of price sensitivity, lifecycle, customer purchase basket, adoption rates, and purchase criteria
9 Geographic Landscape
- 9.1 Geographic segmentation
- Chart on Market share By Geographical Landscape 2023-2028 (%)
- Data Table on Market share By Geographical Landscape 2023-2028 (%)
- 9.2 Geographic comparison
- Chart on Geographic comparison
- Data Table on Geographic comparison
- 9.3 North America - Market size and forecast 2023-2028
- Chart on North America - Market size and forecast 2023-2028 ($ million)
- Data Table on North America - Market size and forecast 2023-2028 ($ million)
- Chart on North America - Year-over-year growth 2023-2028 (%)
- Data Table on North America - Year-over-year growth 2023-2028 (%)
- 9.4 Europe - Market size and forecast 2023-2028
- Chart on Europe - Market size and forecast 2023-2028 ($ million)
- Data Table on Europe - Market size and forecast 2023-2028 ($ million)
- Chart on Europe - Year-over-year growth 2023-2028 (%)
- Data Table on Europe - Year-over-year growth 2023-2028 (%)
- 9.5 APAC - Market size and forecast 2023-2028
- Chart on APAC - Market size and forecast 2023-2028 ($ million)
- Data Table on APAC - Market size and forecast 2023-2028 ($ million)
- Chart on APAC - Year-over-year growth 2023-2028 (%)
- Data Table on APAC - Year-over-year growth 2023-2028 (%)
- 9.6 South America - Market size and forecast 2023-2028
- Chart on South America - Market size and forecast 2023-2028 ($ million)
- Data Table on South America - Market size and forecast 2023-2028 ($ million)
- Chart on South America - Year-over-year growth 2023-2028 (%)
- Data Table on South America - Year-over-year growth 2023-2028 (%)
- 9.7 Middle East and Africa - Market size and forecast 2023-2028
- Chart on Middle East and Africa - Market size and forecast 2023-2028 ($ million)
- Data Table on Middle East and Africa - Market size and forecast 2023-2028 ($ million)
- Chart on Middle East and Africa - Year-over-year growth 2023-2028 (%)
- Data Table on Middle East and Africa - Year-over-year growth 2023-2028 (%)
- 9.8 US - Market size and forecast 2023-2028
- Chart on US - Market size and forecast 2023-2028 ($ million)
- Data Table on US - Market size and forecast 2023-2028 ($ million)
- Chart on US - Year-over-year growth 2023-2028 (%)
- Data Table on US - Year-over-year growth 2023-2028 (%)
- 9.9 China - Market size and forecast 2023-2028
- Chart on China - Market size and forecast 2023-2028 ($ million)
- Data Table on China - Market size and forecast 2023-2028 ($ million)
- Chart on China - Year-over-year growth 2023-2028 (%)
- Data Table on China - Year-over-year growth 2023-2028 (%)
- 9.10 India - Market size and forecast 2023-2028
- Chart on India - Market size and forecast 2023-2028 ($ million)
- Data Table on India - Market size and forecast 2023-2028 ($ million)
- Chart on India - Year-over-year growth 2023-2028 (%)
- Data Table on India - Year-over-year growth 2023-2028 (%)
- 9.11 Russia - Market size and forecast 2023-2028
- Chart on Russia - Market size and forecast 2023-2028 ($ million)
- Data Table on Russia - Market size and forecast 2023-2028 ($ million)
- Chart on Russia - Year-over-year growth 2023-2028 (%)
- Data Table on Russia - Year-over-year growth 2023-2028 (%)
- 9.12 France - Market size and forecast 2023-2028
- Chart on France - Market size and forecast 2023-2028 ($ million)
- Data Table on France - Market size and forecast 2023-2028 ($ million)
- Chart on France - Year-over-year growth 2023-2028 (%)
- Data Table on France - Year-over-year growth 2023-2028 (%)
- 9.13 Market opportunity By Geographical Landscape
- Market opportunity By Geographical Landscape ($ million)
- Data Tables on Market opportunity By Geographical Landscape ($ million)
10 Drivers, Challenges, and Opportunity/Restraints
- 10.1 Market drivers
- 10.2 Market challenges
- 10.3 Impact of drivers and challenges
- Impact of drivers and challenges in 2023 and 2028
- 10.4 Market opportunities/restraints
11 Competitive Landscape
- 11.1 Overview
- 11.2 Competitive Landscape
- Overview on criticality of inputs and factors of differentiation
- 11.3 Landscape disruption
- Overview on factors of disruption
- 11.4 Industry risks
- Impact of key risks on business
12 Competitive Analysis
- 12.1 Companies profiled
- Companies covered
- 12.2 Market positioning of companies
- Matrix on companies position and classification
- 12.3 AECOM
- AECOM - Overview
- AECOM - Business segments
- AECOM - Key news
- AECOM - Key offerings
- AECOM - Segment focus
- 12.4 Agility Public Warehousing Co. K.S.C.P
- Agility Public Warehousing Co. K.S.C.P - Overview
- Agility Public Warehousing Co. K.S.C.P - Business segments
- Agility Public Warehousing Co. K.S.C.P - Key offerings
- Agility Public Warehousing Co. K.S.C.P - Segment focus
- 12.5 Amentum Services Inc.
- Amentum Services Inc. - Overview
- Amentum Services Inc. - Product / Service
- Amentum Services Inc. - Key offerings
- 12.6 Anham Fzco LLC
- Anham Fzco LLC - Overview
- Anham Fzco LLC - Product / Service
- Anham Fzco LLC - Key offerings
- 12.7 BAE Systems Plc
- BAE Systems Plc - Overview
- BAE Systems Plc - Business segments
- BAE Systems Plc - Key news
- BAE Systems Plc - Key offerings
- BAE Systems Plc - Segment focus
- 12.8 CACI International Inc.
- CACI International Inc. - Overview
- CACI International Inc. - Business segments
- CACI International Inc. - Key offerings
- CACI International Inc. - Segment focus
- 12.9 CLAXTON LOGISTICS SERVICES LLC
- CLAXTON LOGISTICS SERVICES LLC - Overview
- CLAXTON LOGISTICS SERVICES LLC - Product / Service
- CLAXTON LOGISTICS SERVICES LLC - Key offerings
- 12.10 CMA CGM SA Group
- CMA CGM SA Group - Overview
- CMA CGM SA Group - Product / Service
- CMA CGM SA Group - Key offerings
- 12.11 Crowley Maritime Corp.
- Crowley Maritime Corp. - Overview
- Crowley Maritime Corp. - Product / Service
- Crowley Maritime Corp. - Key offerings
- 12.12 Fluor Corp.
- Fluor Corp. - Overview
- Fluor Corp. - Business segments
- Fluor Corp. - Key news
- Fluor Corp. - Key offerings
- Fluor Corp. - Segment focus
- 12.13 General Dynamics Corp.
- General Dynamics Corp. - Overview
- General Dynamics Corp. - Business segments
- General Dynamics Corp. - Key news
- General Dynamics Corp. - Key offerings
- General Dynamics Corp. - Segment focus
- 12.14 KBR Inc.
- KBR Inc. - Overview
- KBR Inc. - Business segments
- KBR Inc. - Key news
- KBR Inc. - Key offerings
- KBR Inc. - Segment focus
- 12.15 Lockheed Martin Corp.
- Lockheed Martin Corp. - Overview
- Lockheed Martin Corp. - Business segments
- Lockheed Martin Corp. - Key news
- Lockheed Martin Corp. - Key offerings
- Lockheed Martin Corp. - Segment focus
- 12.16 One Network Enterprises Inc.
- One Network Enterprises Inc. - Overview
- One Network Enterprises Inc. - Product / Service
- One Network Enterprises Inc. - Key offerings
- 12.17 Thales Group
- Thales Group - Overview
- Thales Group - Business segments
- Thales Group - Key news
- Thales Group - Key offerings
- Thales Group - Segment focus
13 Appendix
- 13.1 Scope of the report
- 13.2 Inclusions and exclusions checklist
- Inclusions checklist
- Exclusions checklist
- 13.3 Currency conversion rates for US$
- Currency conversion rates for US$
- 13.4 Research methodology
- Research methodology
- 13.5 Data procurement
- Information sources
- 13.6 Data validation
- Data validation
- 13.7 Validation techniques employed for market sizing
- Validation techniques employed for market sizing
- 13.8 Data synthesis
- Data synthesis
- 13.9 360 degree market analysis
- 360 degree market analysis
- 13.10 List of abbreviations
- List of abbreviations

