|
|
市場調査レポート
商品コード
1915277
世界の創薬情報学市場2026-2030年Global Drug Discovery Informatics Market 2026-2030 |
||||||
|
|||||||
カスタマイズ可能
|
|||||||

| 世界の創薬情報学市場2026-2030年 |
|
出版日: 2026年01月19日
発行: TechNavio
ページ情報: 英文 287 Pages
納期: 即納可能
|

概要
世界の創薬情報学市場は、2025年から2030年にかけて60億2,740万米ドルの成長が見込まれ、予測期間中のCAGRは12.5%と予測されています。
本報告書では、世界の創薬情報学市場に関する包括的な分析、市場規模と予測、動向、成長要因、課題に加え、約25社のベンダー分析を提供しております。
本レポートは、現在の市場状況、最新の動向と促進要因、市場環境全般に関する最新の分析を提供します。市場の成長は、データ駆動型創薬への需要増加、計算生物学の進歩、製薬・バイオテクノロジー分野におけるパイプラインの拡大、アウトソーシングの傾向によって牽引されています。
本調査は、業界の主要関係者からの情報を含む、一次情報と二次情報の客観的な組み合わせを用いて実施されました。本レポートには、主要企業の分析に加え、包括的な市場規模データ、地域別分析を伴うセグメント、ベンダー情勢が含まれています。レポートには過去データと予測データが掲載されています。
| 市場範囲 | |
|---|---|
| 基準年 | 2026年 |
| 終了年 | 2030年 |
| 予測期間 | 2026-2030 |
| 成長モメンタム | 加速 |
| 前年比2026年 | 11.6% |
| CAGR | 12.5% |
| 増分額 | 60億2,740万米ドル |
本調査では、今後数年間における世界の創薬情報学市場の成長を牽引する主な要因の一つとして、AIおよび機械学習(ML)の情報学プラットフォームへの統合を挙げております。また、クラウドベースの創薬情報学ソリューションの導入拡大と、統合型エンドツーエンド創薬情報学プラットフォームへの注目の高まりが、市場における相当な需要につながると見込まれます。
目次
第1章 エグゼクティブサマリー
第2章 Technavio分析
- 価格・ライフサイクル・顧客購入バスケット・採用率・購入基準の分析
- インプットの重要性と差別化の要因
- 混乱の要因
- 促進要因と課題の影響
第3章 市場情勢
- 市場エコシステム
- 市場の特徴
- バリューチェーン分析
第4章 市場規模
- 市場の定義
- 市場セグメント分析
- 市場規模 2025
- 市場の見通し 2025-2030
第5章 市場規模実績
- 世界の創薬情報学市場 2020-2024
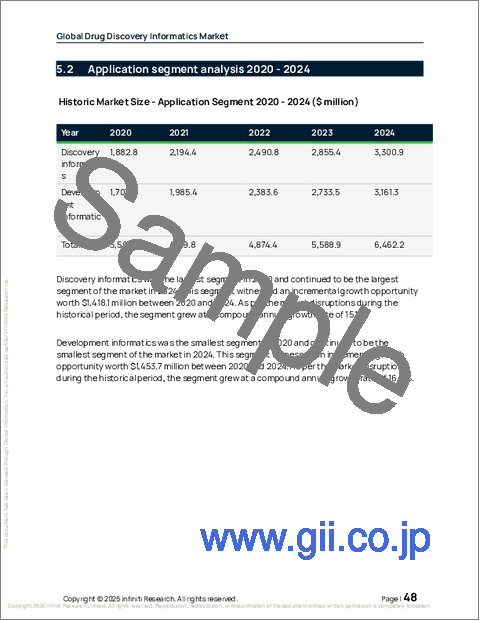
- 用途別セグメント分析 2020-2024
- ソリューションセグメント分析 2020-2024
- エンドユーザーセグメント分析 2020-2024
- 地域別セグメント分析 2020-2024
- 国別セグメント分析 2020-2024
第6章 定性分析
- AIがもたらす影響世界の創薬情報学市場
第7章 ファイブフォース分析
- ファイブフォースの要約
- 買い手の交渉力
- 供給企業の交渉力
- 新規参入業者の脅威
- 代替品の脅威
- 競争の脅威
- 市況
第8章 市場セグメンテーション:用途別
- 比較:用途別
- 創薬情報学
- 開発情報学
- 市場機会:用途別
第9章 市場セグメンテーション:ソリューション別
- 比較:ソリューション別
- ソフトウェア
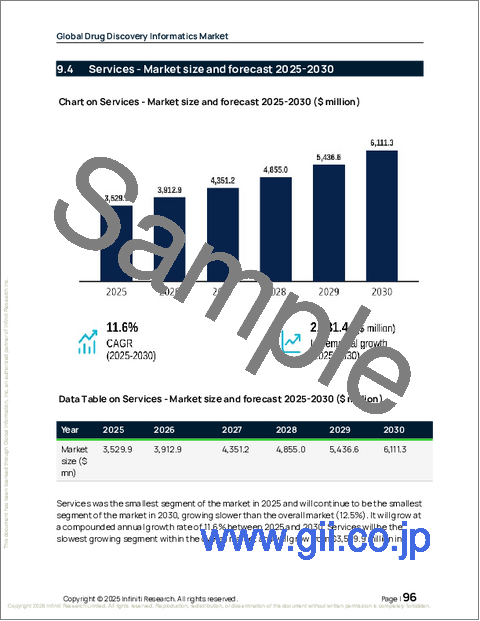
- サービス
- 市場機会:ソリューション別
第10章 市場セグメンテーション:エンドユーザー別
- 比較:エンドユーザー別
- 製薬・バイオテクノロジー企業
- 受託調査機関
- 学術研究機関
- 市場機会:エンドユーザー別
第11章 顧客情勢
第12章 地域別情勢
- 地域別セグメンテーション
- 地域別比較
- 北米
- 米国
- カナダ
- メキシコ
- 欧州
- ドイツ
- 英国
- フランス
- イタリア
- スペイン
- オランダ
- アジア
- 中国
- 日本
- インド
- 韓国
- タイ
- インドネシア
- 世界のその他の地域
- ブラジル
- イスラエル
- サウジアラビア
- アラブ首長国連邦
- アルゼンチン
- 南アフリカ
- トルコ
- コロンビア
- 市場機会:地域別
第13章 促進要因・課題・機会
- 市場促進要因
- 市場の課題
- 促進要因と課題の影響
- 市場機会
第14章 競合情勢
- 概要
- 競合情勢
- 混乱の状況
- 業界のリスク
第15章 競合分析
- 企業プロファイル
- 企業ランキング指標
- 企業の市場ポジショニング
- Certara Inc.
- Charles River Laboratories
- Collaborative Drug Discovery
- Cresset Biomolecular Ltd.
- Dassault Systemes SE
- Dotmatics
- Evotec SE
- IBM Corp.
- Jubilant Pharmova Ltd.
- LabVantage Solutions Inc.
- OpenEye Scientific
- Revvity Inc.
- Schrodinger Inc.
- Selvita SA
- Thermo Fisher Scientific Inc.

