|
|
市場調査レポート
商品コード
1557452
産業用センサーの世界市場 2024-2028Global Industrial Sensors Market 2024-2028 |
||||||
|
|||||||
カスタマイズ可能
|
|||||||

| 産業用センサーの世界市場 2024-2028 |
|
出版日: 2024年08月13日
発行: TechNavio
ページ情報: 英文 185 Pages
納期: 即納可能
|

全表示
- 概要
- 図表
- 目次
産業用センサー市場は2023-2028年に143億米ドル、予測期間中のCAGRは9.44%で成長すると予測されます。
当レポートでは、産業用センサー市場の全体的な分析、市場規模・予測、動向、成長促進要因、課題、約25のベンダーを網羅したベンダー分析などを掲載しています。
現在の市場シナリオ、最新動向と促進要因、市場環境全体に関する最新分析を提供しています。市場は、スマート工場とIIoTの需要増加、産業用センサーの小型化、プロセス産業によるワイヤレスセンサーの需要増加が牽引しています。
| 市場範囲 | |
|---|---|
| 基準年 | 2024 |
| 終了年 | 2028 |
| 予測期間 | 2024-2028 |
| 成長モメンタム | 加速 |
| 前年比2024年 | 8.37% |
| CAGR | 9.44% |
| 増分額 | 143億米ドル |
本調査では、今後数年間の産業用センサー市場成長を牽引する主な要因の1つとして、遠隔監視用センサーの需要増加を挙げています。また、産業における予測分析のためのリアルタイムデータ監視の増加や、データ誘導型意思決定の採用も、市場の大きな需要につながります。
目次
第1章 エグゼクティブサマリー
- 市場概要
第2章 市場情勢
- 市場エコシステム
- 市場の特徴
- バリューチェーン分析
第3章 市場規模の評価
- 市場の定義
- 市場セグメント分析
- 市場規模 2023
- 市場の見通し 2023-2028
第4章 市場規模実績
- 産業用センサーの世界市場 2018-2022
- エンドユーザー別セグメント分析 2018-2022
- 製品別セグメント分析 2018-2022
- 地域別セグメント分析 2018-2022
- 国別セグメント分析 2018-2022
第5章 ファイブフォース分析
- ファイブフォースの要約
- 買い手の交渉力
- 供給企業の交渉力
- 新規参入業者の脅威
- 代替品の脅威
- 競争の脅威
- 市況
第6章 市場セグメンテーション:エンドユーザー別
- 市場セグメンテーション
- 比較:エンドユーザー別
- プロセス産業:市場規模と予測 2023-2028
- 個別産業:市場規模と予測 2023-2028
- 市場機会:エンドユーザー別
第7章 市場セグメンテーション:製品別
- 市場セグメンテーション
- 比較:製品別
- 圧力センサー:市場規模と予測 2023-2028
- 温度センサー:市場規模と予測 2023-2028
- 近接センサー:市場規模と予測 2023-2028
- フローセンサー:市場規模と予測 2023-2028
- その他:市場規模と予測 2023-2028
- 市場機会:製品別
第8章 顧客情勢
- 顧客情勢の概要
第9章 地域別情勢
- 地域別セグメンテーション
- 地域別比較
- アジア太平洋:市場規模と予測 2023-2028
- 欧州:市場規模と予測 2023-2028
- 北米:市場規模と予測 2023-2028
- 中東・アフリカ:市場規模と予測 2023-2028
- 南米:市場規模と予測 2023-2028
- 米国:市場規模と予測 2023-2028
- 中国:市場規模と予測 2023-2028
- 日本:市場規模と予測 2023-2028
- ドイツ:市場規模と予測 2023-2028
- フランス:市場規模と予測 2023-2028
- 市場機会:地域情勢別
第10章 促進要因・課題・機会・抑制要因
- 市場促進要因
- 市場の課題
- 促進要因と課題の影響
- 市場の機会・抑制要因
第11章 競合情勢
- 概要
- 競合情勢
- 混乱の状況
- 業界のリスク
第12章 競合分析
- 企業プロファイル
- 企業の市場ポジショニング
- Amkor Technology Inc.
- Amphenol Advanced Sensors
- Analog Devices Inc.
- Broadcom Inc.
- Hamamatsu Photonics KK
- Honeywell International Inc.
- Maxim Integrated Products Inc.
- Motion Solutions
- NXP Semiconductors NV
- Renesas Electronics Corp.
- Robert Bosch GmbH
- Rockwell Automation Inc.
- Siemens AG
- STMicroelectronics International N.V.
- TDK Corp.
第13章 付録
Exhibits:
- Exhibits1: Executive Summary - Chart on Market Overview
- Exhibits2: Executive Summary - Data Table on Market Overview
- Exhibits3: Executive Summary - Chart on Global Market Characteristics
- Exhibits4: Executive Summary - Chart on Market By Geographical Landscape
- Exhibits5: Executive Summary - Chart on Market Segmentation by End-user
- Exhibits6: Executive Summary - Chart on Market Segmentation by Product
- Exhibits7: Executive Summary - Chart on Incremental Growth
- Exhibits8: Executive Summary - Data Table on Incremental Growth
- Exhibits9: Executive Summary - Chart on Company Market Positioning
- Exhibits10: Parent Market
- Exhibits11: Data Table on - Parent Market
- Exhibits12: Market characteristics analysis
- Exhibits13: Value Chain Analysis
- Exhibits14: Offerings of companies included in the market definition
- Exhibits15: Market segments
- Exhibits16: Chart on Global - Market size and forecast 2023-2028 ($ billion)
- Exhibits17: Data Table on Global - Market size and forecast 2023-2028 ($ billion)
- Exhibits18: Chart on Global Market: Year-over-year growth 2023-2028 (%)
- Exhibits19: Data Table on Global Market: Year-over-year growth 2023-2028 (%)
- Exhibits20: Historic Market Size - Data Table on Global Industrial Sensors Market 2018 - 2022 ($ billion)
- Exhibits21: Historic Market Size - End-user Segment 2018 - 2022 ($ billion)
- Exhibits22: Historic Market Size - Product Segment 2018 - 2022 ($ billion)
- Exhibits23: Historic Market Size - Geography Segment 2018 - 2022 ($ billion)
- Exhibits24: Historic Market Size - Country Segment 2018 - 2022 ($ billion)
- Exhibits25: Five forces analysis - Comparison between 2023 and 2028
- Exhibits26: Bargaining power of buyers - Impact of key factors 2023 and 2028
- Exhibits27: Bargaining power of suppliers - Impact of key factors in 2023 and 2028
- Exhibits28: Threat of new entrants - Impact of key factors in 2023 and 2028
- Exhibits29: Threat of substitutes - Impact of key factors in 2023 and 2028
- Exhibits30: Threat of rivalry - Impact of key factors in 2023 and 2028
- Exhibits31: Chart on Market condition - Five forces 2023 and 2028
- Exhibits32: Chart on End-user - Market share 2023-2028 (%)
- Exhibits33: Data Table on End-user - Market share 2023-2028 (%)
- Exhibits34: Chart on Comparison by End-user
- Exhibits35: Data Table on Comparison by End-user
- Exhibits36: Chart on Process industries - Market size and forecast 2023-2028 ($ billion)
- Exhibits37: Data Table on Process industries - Market size and forecast 2023-2028 ($ billion)
- Exhibits38: Chart on Process industries - Year-over-year growth 2023-2028 (%)
- Exhibits39: Data Table on Process industries - Year-over-year growth 2023-2028 (%)
- Exhibits40: Chart on Discrete industries - Market size and forecast 2023-2028 ($ billion)
- Exhibits41: Data Table on Discrete industries - Market size and forecast 2023-2028 ($ billion)
- Exhibits42: Chart on Discrete industries - Year-over-year growth 2023-2028 (%)
- Exhibits43: Data Table on Discrete industries - Year-over-year growth 2023-2028 (%)
- Exhibits44: Market opportunity by End-user ($ billion)
- Exhibits45: Data Table on Market opportunity by End-user ($ billion)
- Exhibits46: Chart on Product - Market share 2023-2028 (%)
- Exhibits47: Data Table on Product - Market share 2023-2028 (%)
- Exhibits48: Chart on Comparison by Product
- Exhibits49: Data Table on Comparison by Product
- Exhibits50: Chart on Pressure - Market size and forecast 2023-2028 ($ billion)
- Exhibits51: Data Table on Pressure - Market size and forecast 2023-2028 ($ billion)
- Exhibits52: Chart on Pressure - Year-over-year growth 2023-2028 (%)
- Exhibits53: Data Table on Pressure - Year-over-year growth 2023-2028 (%)
- Exhibits54: Chart on Temperature - Market size and forecast 2023-2028 ($ billion)
- Exhibits55: Data Table on Temperature - Market size and forecast 2023-2028 ($ billion)
- Exhibits56: Chart on Temperature - Year-over-year growth 2023-2028 (%)
- Exhibits57: Data Table on Temperature - Year-over-year growth 2023-2028 (%)
- Exhibits58: Chart on Proximity - Market size and forecast 2023-2028 ($ billion)
- Exhibits59: Data Table on Proximity - Market size and forecast 2023-2028 ($ billion)
- Exhibits60: Chart on Proximity - Year-over-year growth 2023-2028 (%)
- Exhibits61: Data Table on Proximity - Year-over-year growth 2023-2028 (%)
- Exhibits62: Chart on Flow - Market size and forecast 2023-2028 ($ billion)
- Exhibits63: Data Table on Flow - Market size and forecast 2023-2028 ($ billion)
- Exhibits64: Chart on Flow - Year-over-year growth 2023-2028 (%)
- Exhibits65: Data Table on Flow - Year-over-year growth 2023-2028 (%)
- Exhibits66: Chart on Others - Market size and forecast 2023-2028 ($ billion)
- Exhibits67: Data Table on Others - Market size and forecast 2023-2028 ($ billion)
- Exhibits68: Chart on Others - Year-over-year growth 2023-2028 (%)
- Exhibits69: Data Table on Others - Year-over-year growth 2023-2028 (%)
- Exhibits70: Market opportunity by Product ($ billion)
- Exhibits71: Data Table on Market opportunity by Product ($ billion)
- Exhibits72: Analysis of price sensitivity, lifecycle, customer purchase basket, adoption rates, and purchase criteria
- Exhibits73: Chart on Market share By Geographical Landscape 2023-2028 (%)
- Exhibits74: Data Table on Market share By Geographical Landscape 2023-2028 (%)
- Exhibits75: Chart on Geographic comparison
- Exhibits76: Data Table on Geographic comparison
- Exhibits77: Chart on APAC - Market size and forecast 2023-2028 ($ billion)
- Exhibits78: Data Table on APAC - Market size and forecast 2023-2028 ($ billion)
- Exhibits79: Chart on APAC - Year-over-year growth 2023-2028 (%)
- Exhibits80: Data Table on APAC - Year-over-year growth 2023-2028 (%)
- Exhibits81: Chart on Europe - Market size and forecast 2023-2028 ($ billion)
- Exhibits82: Data Table on Europe - Market size and forecast 2023-2028 ($ billion)
- Exhibits83: Chart on Europe - Year-over-year growth 2023-2028 (%)
- Exhibits84: Data Table on Europe - Year-over-year growth 2023-2028 (%)
- Exhibits85: Chart on North America - Market size and forecast 2023-2028 ($ billion)
- Exhibits86: Data Table on North America - Market size and forecast 2023-2028 ($ billion)
- Exhibits87: Chart on North America - Year-over-year growth 2023-2028 (%)
- Exhibits88: Data Table on North America - Year-over-year growth 2023-2028 (%)
- Exhibits89: Chart on Middle East and Africa - Market size and forecast 2023-2028 ($ billion)
- Exhibits90: Data Table on Middle East and Africa - Market size and forecast 2023-2028 ($ billion)
- Exhibits91: Chart on Middle East and Africa - Year-over-year growth 2023-2028 (%)
- Exhibits92: Data Table on Middle East and Africa - Year-over-year growth 2023-2028 (%)
- Exhibits93: Chart on South America - Market size and forecast 2023-2028 ($ billion)
- Exhibits94: Data Table on South America - Market size and forecast 2023-2028 ($ billion)
- Exhibits95: Chart on South America - Year-over-year growth 2023-2028 (%)
- Exhibits96: Data Table on South America - Year-over-year growth 2023-2028 (%)
- Exhibits97: Chart on US - Market size and forecast 2023-2028 ($ billion)
- Exhibits98: Data Table on US - Market size and forecast 2023-2028 ($ billion)
- Exhibits99: Chart on US - Year-over-year growth 2023-2028 (%)
- Exhibits100: Data Table on US - Year-over-year growth 2023-2028 (%)
- Exhibits101: Chart on China - Market size and forecast 2023-2028 ($ billion)
- Exhibits102: Data Table on China - Market size and forecast 2023-2028 ($ billion)
- Exhibits103: Chart on China - Year-over-year growth 2023-2028 (%)
- Exhibits104: Data Table on China - Year-over-year growth 2023-2028 (%)
- Exhibits105: Chart on Japan - Market size and forecast 2023-2028 ($ billion)
- Exhibits106: Data Table on Japan - Market size and forecast 2023-2028 ($ billion)
- Exhibits107: Chart on Japan - Year-over-year growth 2023-2028 (%)
- Exhibits108: Data Table on Japan - Year-over-year growth 2023-2028 (%)
- Exhibits109: Chart on Germany - Market size and forecast 2023-2028 ($ billion)
- Exhibits110: Data Table on Germany - Market size and forecast 2023-2028 ($ billion)
- Exhibits111: Chart on Germany - Year-over-year growth 2023-2028 (%)
- Exhibits112: Data Table on Germany - Year-over-year growth 2023-2028 (%)
- Exhibits113: Chart on France - Market size and forecast 2023-2028 ($ billion)
- Exhibits114: Data Table on France - Market size and forecast 2023-2028 ($ billion)
- Exhibits115: Chart on France - Year-over-year growth 2023-2028 (%)
- Exhibits116: Data Table on France - Year-over-year growth 2023-2028 (%)
- Exhibits117: Market opportunity By Geographical Landscape ($ billion)
- Exhibits118: Data Tables on Market opportunity By Geographical Landscape ($ billion)
- Exhibits119: Impact of drivers and challenges in 2023 and 2028
- Exhibits120: Overview on criticality of inputs and factors of differentiation
- Exhibits121: Overview on factors of disruption
- Exhibits122: Impact of key risks on business
- Exhibits123: Companies covered
- Exhibits124: Matrix on companies position and classification
- Exhibits125: Amkor Technology Inc. - Overview
- Exhibits126: Amkor Technology Inc. - Business segments
- Exhibits127: Amkor Technology Inc. - Key news
- Exhibits128: Amkor Technology Inc. - Key offerings
- Exhibits129: Amkor Technology Inc. - Segment focus
- Exhibits130: Amphenol Advanced Sensors - Overview
- Exhibits131: Amphenol Advanced Sensors - Product / Service
- Exhibits132: Amphenol Advanced Sensors - Key offerings
- Exhibits133: Analog Devices Inc. - Overview
- Exhibits134: Analog Devices Inc. - Business segments
- Exhibits135: Analog Devices Inc. - Key news
- Exhibits136: Analog Devices Inc. - Key offerings
- Exhibits137: Analog Devices Inc. - Segment focus
- Exhibits138: Broadcom Inc. - Overview
- Exhibits139: Broadcom Inc. - Business segments
- Exhibits140: Broadcom Inc. - Key news
- Exhibits141: Broadcom Inc. - Key offerings
- Exhibits142: Broadcom Inc. - Segment focus
- Exhibits143: Hamamatsu Photonics KK - Overview
- Exhibits144: Hamamatsu Photonics KK - Business segments
- Exhibits145: Hamamatsu Photonics KK - Key news
- Exhibits146: Hamamatsu Photonics KK - Key offerings
- Exhibits147: Hamamatsu Photonics KK - Segment focus
- Exhibits148: Honeywell International Inc. - Overview
- Exhibits149: Honeywell International Inc. - Business segments
- Exhibits150: Honeywell International Inc. - Key news
- Exhibits151: Honeywell International Inc. - Key offerings
- Exhibits152: Honeywell International Inc. - Segment focus
- Exhibits153: Maxim Integrated Products Inc. - Overview
- Exhibits154: Maxim Integrated Products Inc. - Key offerings
- Exhibits155: Motion Solutions - Overview
- Exhibits156: Motion Solutions - Product / Service
- Exhibits157: Motion Solutions - Key offerings
- Exhibits158: NXP Semiconductors NV - Overview
- Exhibits159: NXP Semiconductors NV - Product / Service
- Exhibits160: NXP Semiconductors NV - Key news
- Exhibits161: NXP Semiconductors NV - Key offerings
- Exhibits162: Renesas Electronics Corp. - Overview
- Exhibits163: Renesas Electronics Corp. - Business segments
- Exhibits164: Renesas Electronics Corp. - Key news
- Exhibits165: Renesas Electronics Corp. - Key offerings
- Exhibits166: Renesas Electronics Corp. - Segment focus
- Exhibits167: Robert Bosch GmbH - Overview
- Exhibits168: Robert Bosch GmbH - Product / Service
- Exhibits169: Robert Bosch GmbH - Key news
- Exhibits170: Robert Bosch GmbH - Key offerings
- Exhibits171: Rockwell Automation Inc. - Overview
- Exhibits172: Rockwell Automation Inc. - Business segments
- Exhibits173: Rockwell Automation Inc. - Key news
- Exhibits174: Rockwell Automation Inc. - Key offerings
- Exhibits175: Rockwell Automation Inc. - Segment focus
- Exhibits176: Siemens AG - Overview
- Exhibits177: Siemens AG - Business segments
- Exhibits178: Siemens AG - Key news
- Exhibits179: Siemens AG - Key offerings
- Exhibits180: Siemens AG - Segment focus
- Exhibits181: STMicroelectronics International N.V. - Overview
- Exhibits182: STMicroelectronics International N.V. - Business segments
- Exhibits183: STMicroelectronics International N.V. - Key news
- Exhibits184: STMicroelectronics International N.V. - Key offerings
- Exhibits185: STMicroelectronics International N.V. - Segment focus
- Exhibits186: TDK Corp. - Overview
- Exhibits187: TDK Corp. - Business segments
- Exhibits188: TDK Corp. - Key news
- Exhibits189: TDK Corp. - Key offerings
- Exhibits190: TDK Corp. - Segment focus
- Exhibits191: Inclusions checklist
- Exhibits192: Exclusions checklist
- Exhibits193: Currency conversion rates for US$
- Exhibits194: Research methodology
- Exhibits195: Information sources
- Exhibits196: Data validation
- Exhibits197: Validation techniques employed for market sizing
- Exhibits198: Data synthesis
- Exhibits199: 360 degree market analysis
- Exhibits200: List of abbreviations
The industrial sensors market is forecasted to grow by USD 14.3 bn during 2023-2028, accelerating at a CAGR of 9.44% during the forecast period. The report on the industrial sensors market provides a holistic analysis, market size and forecast, trends, growth drivers, and challenges, as well as vendor analysis covering around 25 vendors.
The report offers an up-to-date analysis regarding the current market scenario, the latest trends and drivers, and the overall market environment. The market is driven by rise in demand for smart factories and iiot, miniaturization of industrial sensors, and increase in demand for wireless sensors by process industries.
Technavio's industrial sensors market is segmented as below:
| Market Scope | |
|---|---|
| Base Year | 2024 |
| End Year | 2028 |
| Series Year | 2024-2028 |
| Growth Momentum | Accelerate |
| YOY 2024 | 8.37% |
| CAGR | 9.44% |
| Incremental Value | $14.3 bn |
By End-user
- Process industries
- Discrete industries
By Product
- Pressure
- Temperature
- Proximity
- Flow
- Others
By Geographical Landscape
- APAC
- Europe
- North America
- Middle East and Africa
- South America
This study identifies the increasing demand for sensors for remote monitoring as one of the prime reasons driving the industrial sensors market growth during the next few years. Also, increase in real-time data monitoring for predictive analytics in industries and adoption of data-guided decision-making will lead to sizable demand in the market.
The report on the industrial sensors market covers the following areas:
- Industrial sensors market sizing
- Industrial sensors market forecast
- Industrial sensors market industry analysis
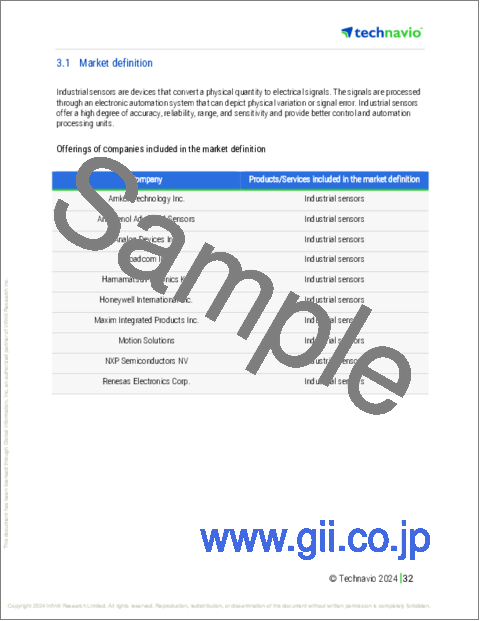
The robust vendor analysis is designed to help clients improve their market position, and in line with this, this report provides a detailed analysis of several leading industrial sensors market vendors that include Amkor Technology Inc., Amphenol Advanced Sensors, Analog Devices Inc., Broadcom Inc., Excelitas Technologies Corp., Hamamatsu Photonics KK, Honeywell International Inc., Itron Inc., Maxim Integrated Products Inc., Motion Solutions, Murata Manufacturing Co. Ltd., NXP Semiconductors NV, Renesas Electronics Corp., Robert Bosch GmbH, Rockwell Automation Inc., ROHM Co. Ltd., Sensata Technologies Inc., Siemens AG, STMicroelectronics International N.V., TDK Corp., TE Connectivity Ltd., and Texas Instruments Inc.. Also, the industrial sensors market analysis report includes information on upcoming trends and challenges that will influence market growth. This is to help companies strategize and leverage all forthcoming growth opportunities.
The study was conducted using an objective combination of primary and secondary information including inputs from key participants in the industry. The report contains a comprehensive market and vendor landscape in addition to an analysis of the key vendors.
The publisher presents a detailed picture of the market by the way of study, synthesis, and summation of data from multiple sources by an analysis of key parameters such as profit, pricing, competition, and promotions. It presents various market facets by identifying the key industry influencers. The data presented is comprehensive, reliable, and a result of extensive research - both primary and secondary. The market research reports provide a complete competitive landscape and an in-depth vendor selection methodology and analysis using qualitative and quantitative research to forecast the accurate market growth.
Table of Contents
1 Executive Summary
- 1.1 Market overview
- Executive Summary - Chart on Market Overview
- Executive Summary - Data Table on Market Overview
- Executive Summary - Chart on Global Market Characteristics
- Executive Summary - Chart on Market By Geographical Landscape
- Executive Summary - Chart on Market Segmentation by End-user
- Executive Summary - Chart on Market Segmentation by Product
- Executive Summary - Chart on Incremental Growth
- Executive Summary - Data Table on Incremental Growth
- Executive Summary - Chart on Company Market Positioning
2 Market Landscape
- 2.1 Market ecosystem
- Parent Market
- Data Table on - Parent Market
- 2.2 Market characteristics
- Market characteristics analysis
- 2.3 Value chain analysis
- Value Chain Analysis
3 Market Sizing
- 3.1 Market definition
- Offerings of companies included in the market definition
- 3.2 Market segment analysis
- Market segments
- 3.3 Market size 2023
- 3.4 Market outlook: Forecast for 2023-2028
- Chart on Global - Market size and forecast 2023-2028 ($ billion)
- Data Table on Global - Market size and forecast 2023-2028 ($ billion)
- Chart on Global Market: Year-over-year growth 2023-2028 (%)
- Data Table on Global Market: Year-over-year growth 2023-2028 (%)
4 Historic Market Size
- 4.1 Global Industrial Sensors Market 2018 - 2022
- Historic Market Size - Data Table on Global Industrial Sensors Market 2018 - 2022 ($ billion)
- 4.2 End-user segment analysis 2018 - 2022
- Historic Market Size - End-user Segment 2018 - 2022 ($ billion)
- 4.3 Product segment analysis 2018 - 2022
- Historic Market Size - Product Segment 2018 - 2022 ($ billion)
- 4.4 Geography segment analysis 2018 - 2022
- Historic Market Size - Geography Segment 2018 - 2022 ($ billion)
- 4.5 Country segment analysis 2018 - 2022
- Historic Market Size - Country Segment 2018 - 2022 ($ billion)
5 Five Forces Analysis
- 5.1 Five forces summary
- Five forces analysis - Comparison between 2023 and 2028
- 5.2 Bargaining power of buyers
- Bargaining power of buyers - Impact of key factors 2023 and 2028
- 5.3 Bargaining power of suppliers
- Bargaining power of suppliers - Impact of key factors in 2023 and 2028
- 5.4 Threat of new entrants
- Threat of new entrants - Impact of key factors in 2023 and 2028
- 5.5 Threat of substitutes
- Threat of substitutes - Impact of key factors in 2023 and 2028
- 5.6 Threat of rivalry
- Threat of rivalry - Impact of key factors in 2023 and 2028
- 5.7 Market condition
- Chart on Market condition - Five forces 2023 and 2028
6 Market Segmentation by End-user
- 6.1 Market segments
- Chart on End-user - Market share 2023-2028 (%)
- Data Table on End-user - Market share 2023-2028 (%)
- 6.2 Comparison by End-user
- Chart on Comparison by End-user
- Data Table on Comparison by End-user
- 6.3 Process industries - Market size and forecast 2023-2028
- Chart on Process industries - Market size and forecast 2023-2028 ($ billion)
- Data Table on Process industries - Market size and forecast 2023-2028 ($ billion)
- Chart on Process industries - Year-over-year growth 2023-2028 (%)
- Data Table on Process industries - Year-over-year growth 2023-2028 (%)
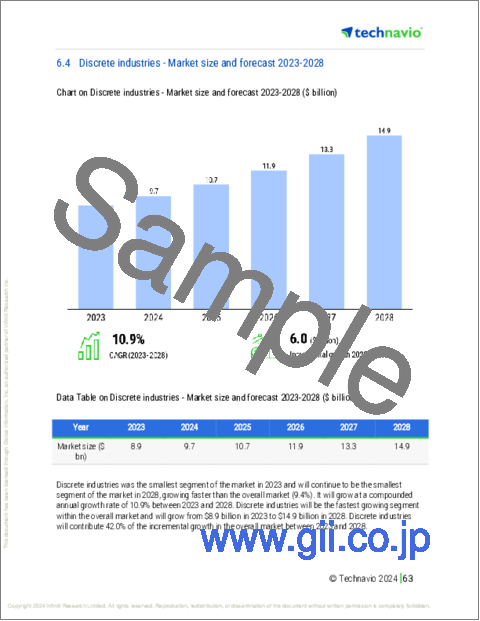
- 6.4 Discrete industries - Market size and forecast 2023-2028
- Chart on Discrete industries - Market size and forecast 2023-2028 ($ billion)
- Data Table on Discrete industries - Market size and forecast 2023-2028 ($ billion)
- Chart on Discrete industries - Year-over-year growth 2023-2028 (%)
- Data Table on Discrete industries - Year-over-year growth 2023-2028 (%)
- 6.5 Market opportunity by End-user
- Market opportunity by End-user ($ billion)
- Data Table on Market opportunity by End-user ($ billion)
7 Market Segmentation by Product
- 7.1 Market segments
- Chart on Product - Market share 2023-2028 (%)
- Data Table on Product - Market share 2023-2028 (%)
- 7.2 Comparison by Product
- Chart on Comparison by Product
- Data Table on Comparison by Product
- 7.3 Pressure - Market size and forecast 2023-2028
- Chart on Pressure - Market size and forecast 2023-2028 ($ billion)
- Data Table on Pressure - Market size and forecast 2023-2028 ($ billion)
- Chart on Pressure - Year-over-year growth 2023-2028 (%)
- Data Table on Pressure - Year-over-year growth 2023-2028 (%)
- 7.4 Temperature - Market size and forecast 2023-2028
- Chart on Temperature - Market size and forecast 2023-2028 ($ billion)
- Data Table on Temperature - Market size and forecast 2023-2028 ($ billion)
- Chart on Temperature - Year-over-year growth 2023-2028 (%)
- Data Table on Temperature - Year-over-year growth 2023-2028 (%)
- 7.5 Proximity - Market size and forecast 2023-2028
- Chart on Proximity - Market size and forecast 2023-2028 ($ billion)
- Data Table on Proximity - Market size and forecast 2023-2028 ($ billion)
- Chart on Proximity - Year-over-year growth 2023-2028 (%)
- Data Table on Proximity - Year-over-year growth 2023-2028 (%)
- 7.6 Flow - Market size and forecast 2023-2028
- Chart on Flow - Market size and forecast 2023-2028 ($ billion)
- Data Table on Flow - Market size and forecast 2023-2028 ($ billion)
- Chart on Flow - Year-over-year growth 2023-2028 (%)
- Data Table on Flow - Year-over-year growth 2023-2028 (%)
- 7.7 Others - Market size and forecast 2023-2028
- Chart on Others - Market size and forecast 2023-2028 ($ billion)
- Data Table on Others - Market size and forecast 2023-2028 ($ billion)
- Chart on Others - Year-over-year growth 2023-2028 (%)
- Data Table on Others - Year-over-year growth 2023-2028 (%)
- 7.8 Market opportunity by Product
- Market opportunity by Product ($ billion)
- Data Table on Market opportunity by Product ($ billion)
8 Customer Landscape
- 8.1 Customer landscape overview
- Analysis of price sensitivity, lifecycle, customer purchase basket, adoption rates, and purchase criteria
9 Geographic Landscape
- 9.1 Geographic segmentation
- Chart on Market share By Geographical Landscape 2023-2028 (%)
- Data Table on Market share By Geographical Landscape 2023-2028 (%)
- 9.2 Geographic comparison
- Chart on Geographic comparison
- Data Table on Geographic comparison
- 9.3 APAC - Market size and forecast 2023-2028
- Chart on APAC - Market size and forecast 2023-2028 ($ billion)
- Data Table on APAC - Market size and forecast 2023-2028 ($ billion)
- Chart on APAC - Year-over-year growth 2023-2028 (%)
- Data Table on APAC - Year-over-year growth 2023-2028 (%)
- 9.4 Europe - Market size and forecast 2023-2028
- Chart on Europe - Market size and forecast 2023-2028 ($ billion)
- Data Table on Europe - Market size and forecast 2023-2028 ($ billion)
- Chart on Europe - Year-over-year growth 2023-2028 (%)
- Data Table on Europe - Year-over-year growth 2023-2028 (%)
- 9.5 North America - Market size and forecast 2023-2028
- Chart on North America - Market size and forecast 2023-2028 ($ billion)
- Data Table on North America - Market size and forecast 2023-2028 ($ billion)
- Chart on North America - Year-over-year growth 2023-2028 (%)
- Data Table on North America - Year-over-year growth 2023-2028 (%)
- 9.6 Middle East and Africa - Market size and forecast 2023-2028
- Chart on Middle East and Africa - Market size and forecast 2023-2028 ($ billion)
- Data Table on Middle East and Africa - Market size and forecast 2023-2028 ($ billion)
- Chart on Middle East and Africa - Year-over-year growth 2023-2028 (%)
- Data Table on Middle East and Africa - Year-over-year growth 2023-2028 (%)
- 9.7 South America - Market size and forecast 2023-2028
- Chart on South America - Market size and forecast 2023-2028 ($ billion)
- Data Table on South America - Market size and forecast 2023-2028 ($ billion)
- Chart on South America - Year-over-year growth 2023-2028 (%)
- Data Table on South America - Year-over-year growth 2023-2028 (%)
- 9.8 US - Market size and forecast 2023-2028
- Chart on US - Market size and forecast 2023-2028 ($ billion)
- Data Table on US - Market size and forecast 2023-2028 ($ billion)
- Chart on US - Year-over-year growth 2023-2028 (%)
- Data Table on US - Year-over-year growth 2023-2028 (%)
- 9.9 China - Market size and forecast 2023-2028
- Chart on China - Market size and forecast 2023-2028 ($ billion)
- Data Table on China - Market size and forecast 2023-2028 ($ billion)
- Chart on China - Year-over-year growth 2023-2028 (%)
- Data Table on China - Year-over-year growth 2023-2028 (%)
- 9.10 Japan - Market size and forecast 2023-2028
- Chart on Japan - Market size and forecast 2023-2028 ($ billion)
- Data Table on Japan - Market size and forecast 2023-2028 ($ billion)
- Chart on Japan - Year-over-year growth 2023-2028 (%)
- Data Table on Japan - Year-over-year growth 2023-2028 (%)
- 9.11 Germany - Market size and forecast 2023-2028
- Chart on Germany - Market size and forecast 2023-2028 ($ billion)
- Data Table on Germany - Market size and forecast 2023-2028 ($ billion)
- Chart on Germany - Year-over-year growth 2023-2028 (%)
- Data Table on Germany - Year-over-year growth 2023-2028 (%)
- 9.12 France - Market size and forecast 2023-2028
- Chart on France - Market size and forecast 2023-2028 ($ billion)
- Data Table on France - Market size and forecast 2023-2028 ($ billion)
- Chart on France - Year-over-year growth 2023-2028 (%)
- Data Table on France - Year-over-year growth 2023-2028 (%)
- 9.13 Market opportunity By Geographical Landscape
- Market opportunity By Geographical Landscape ($ billion)
- Data Tables on Market opportunity By Geographical Landscape ($ billion)
10 Drivers, Challenges, and Opportunity/Restraints
- 10.1 Market drivers
- 10.2 Market challenges
- 10.3 Impact of drivers and challenges
- Impact of drivers and challenges in 2023 and 2028
- 10.4 Market opportunities/restraints
11 Competitive Landscape
- 11.1 Overview
- 11.2 Competitive Landscape
- Overview on criticality of inputs and factors of differentiation
- 11.3 Landscape disruption
- Overview on factors of disruption
- 11.4 Industry risks
- Impact of key risks on business
12 Competitive Analysis
- 12.1 Companies profiled
- Companies covered
- 12.2 Market positioning of companies
- Matrix on companies position and classification
- 12.3 Amkor Technology Inc.
- Amkor Technology Inc. - Overview
- Amkor Technology Inc. - Business segments
- Amkor Technology Inc. - Key news
- Amkor Technology Inc. - Key offerings
- Amkor Technology Inc. - Segment focus
- 12.4 Amphenol Advanced Sensors
- Amphenol Advanced Sensors - Overview
- Amphenol Advanced Sensors - Product / Service
- Amphenol Advanced Sensors - Key offerings
- 12.5 Analog Devices Inc.
- Analog Devices Inc. - Overview
- Analog Devices Inc. - Business segments
- Analog Devices Inc. - Key news
- Analog Devices Inc. - Key offerings
- Analog Devices Inc. - Segment focus
- 12.6 Broadcom Inc.
- Broadcom Inc. - Overview
- Broadcom Inc. - Business segments
- Broadcom Inc. - Key news
- Broadcom Inc. - Key offerings
- Broadcom Inc. - Segment focus
- 12.7 Hamamatsu Photonics KK
- Hamamatsu Photonics KK - Overview
- Hamamatsu Photonics KK - Business segments
- Hamamatsu Photonics KK - Key news
- Hamamatsu Photonics KK - Key offerings
- Hamamatsu Photonics KK - Segment focus
- 12.8 Honeywell International Inc.
- Honeywell International Inc. - Overview
- Honeywell International Inc. - Business segments
- Honeywell International Inc. - Key news
- Honeywell International Inc. - Key offerings
- Honeywell International Inc. - Segment focus
- 12.9 Maxim Integrated Products Inc.
- Maxim Integrated Products Inc. - Overview
- Maxim Integrated Products Inc. - Key offerings
- 12.10 Motion Solutions
- Motion Solutions - Overview
- Motion Solutions - Product / Service
- Motion Solutions - Key offerings
- 12.11 NXP Semiconductors NV
- NXP Semiconductors NV - Overview
- NXP Semiconductors NV - Product / Service
- NXP Semiconductors NV - Key news
- NXP Semiconductors NV - Key offerings
- 12.12 Renesas Electronics Corp.
- Renesas Electronics Corp. - Overview
- Renesas Electronics Corp. - Business segments
- Renesas Electronics Corp. - Key news
- Renesas Electronics Corp. - Key offerings
- Renesas Electronics Corp. - Segment focus
- 12.13 Robert Bosch GmbH
- Robert Bosch GmbH - Overview
- Robert Bosch GmbH - Product / Service
- Robert Bosch GmbH - Key news
- Robert Bosch GmbH - Key offerings
- 12.14 Rockwell Automation Inc.
- Rockwell Automation Inc. - Overview
- Rockwell Automation Inc. - Business segments
- Rockwell Automation Inc. - Key news
- Rockwell Automation Inc. - Key offerings
- Rockwell Automation Inc. - Segment focus
- 12.15 Siemens AG
- Siemens AG - Overview
- Siemens AG - Business segments
- Siemens AG - Key news
- Siemens AG - Key offerings
- Siemens AG - Segment focus
- 12.16 STMicroelectronics International N.V.
- STMicroelectronics International N.V. - Overview
- STMicroelectronics International N.V. - Business segments
- STMicroelectronics International N.V. - Key news
- STMicroelectronics International N.V. - Key offerings
- STMicroelectronics International N.V. - Segment focus
- 12.17 TDK Corp.
- TDK Corp. - Overview
- TDK Corp. - Business segments
- TDK Corp. - Key news
- TDK Corp. - Key offerings
- TDK Corp. - Segment focus
13 Appendix
- 13.1 Scope of the report
- 13.2 Inclusions and exclusions checklist
- Inclusions checklist
- Exclusions checklist
- 13.3 Currency conversion rates for US$
- Currency conversion rates for US$
- 13.4 Research methodology
- Research methodology
- 13.5 Data procurement
- Information sources
- 13.6 Data validation
- Data validation
- 13.7 Validation techniques employed for market sizing
- Validation techniques employed for market sizing
- 13.8 Data synthesis
- Data synthesis
- 360 degree market analysis
- 360 degree market analysis
- 13.10 List of abbreviations
- List of abbreviations

