|
|
市場調査レポート
商品コード
1234251
オンライン食料品市場 2023-2027Online Grocery Market 2023-2027 |
||||||
|
|
|||||||
|
● お客様のご希望に応じて、既存データの加工や未掲載情報(例:国別セグメント)の追加などの対応が可能です。 詳細はお問い合わせください。 |
|||||||


| オンライン食料品市場 2023-2027 |
|
出版日: 2023年03月02日
発行: TechNavio
ページ情報: 英文 122 Pages
納期: 即納可能
|
- 全表示
- 概要
- 図表
- 目次
インドのオンライン食料品市場 2023-2027
当レポートでは、インドのオンライン食料品市場をモニターしており、2022年から2027年の間に74億1,746万米ドルの増加となる見通しで、予測期間中のCAGRは20.33%で成長すると予測しています。当レポートでは、インドのオンライン食料品市場について、全体的な分析、市場規模と予測、動向、成長促進要因・課題、約25のベンダーをカバーするベンダー分析などを掲載しています。
現在の市場シナリオ、最新動向と促進要因、市場全体の環境に関する最新の分析を提供しています。市場は、eコマースプラットフォームの普及と増加、インドの消費者の可処分所得の増加、mコマースの急成長によって牽引されています。
本調査では、今後数年間のオンライン食料品市場の成長を促進する主要な理由の一つとして、機能性食品や飲食品に対する需要の伸びを挙げています。また、オンラインサービスを提供する食料品店の増加や、柔軟な決済・配送サービスの利用が増加していることも、同市場の大きな需要につながると考えられます。
目次
第1章 エグゼクティブサマリー
- 市場概要
第2章 市場情勢
- 市場エコシステム
第3章 市場規模
- 市場の定義
- 市場セグメント分析
- 市場規模 2022
- 市場の見通し:2022-2027年の予測
第4章 市場規模実績
- インドのオンライン食料品市場2017-2021
- 製品セグメント分析2017-2021
- タイプセグメント分析2017-2021
第5章 ファイブフォース分析
- ファイブフォースの要約
- 買い手の交渉力
- 供給企業の交渉力
- 新規参入業者の脅威
- 代替品の脅威
- 競争の脅威
- 市況
第6章 製品別の市場セグメンテーション
- 市場セグメント
- 製品別比較
- 食品 - 市場規模と予測 2022-2027
- 非食品 - 市場規模と予測 2022-2027
- 製品別の市場機会
第7章 タイプ別の市場セグメンテーション
- 市場セグメント
- タイプ別比較
- オンライン - 市場規模と予測 2022-2027
- 代金引換 - 市場規模と予測 2022-2027
- タイプ別の市場機会
第8章 顧客情勢
- 顧客情勢の概要
第9章 促進要因、課題、および動向
- 市場促進要因
- 市場の課題
- 促進要因と課題の影響
- 市場動向
第10章 ベンダー情勢
- 概要
- ベンダー情勢
- 混乱の状況
- 業界のリスク
第11章 ベンダー分析
- 対象ベンダー
- ベンダーの市場ポジショニング
- Amazon.com Inc.
- Avenue Ecommerce Ltd.
- Blink Commerce Pvt. Ltd.
- Dookan Technologies sro
- Dunzo Digital Pvt. Ltd.
- Flipkart Internet Pvt. Ltd.
- Fresh to Home
- GFOI retail Pvt. Ltd.
- Innovative Retail Concepts Pvt. Ltd.
- One97 Communications Ltd.
- Reliance Industries Ltd.
- RP Sanjiv Goenka Group
- SPAR Group Inc.
- Tata Sons Pvt. Ltd.
- Zepto
第12章 付録
Exhibits:
- Exhibits1: Executive Summary - Chart on Market Overview
- Exhibits2: Executive Summary - Data Table on Market Overview
- Exhibits3: Executive Summary - Chart on Country Market Characteristics
- Exhibits4: Executive Summary - Chart on Market Segmentation by Product
- Exhibits5: Executive Summary - Chart on Market Segmentation by Type
- Exhibits6: Executive Summary - Chart on Vendor Market Positioning
- Exhibits7: Parent market
- Exhibits8: Market Characteristics
- Exhibits9: Offerings of vendors included in the market definition
- Exhibits10: Market segments
- Exhibits11: Chart on India - Market size and forecast 2022-2027 ($ million)
- Exhibits12: Data Table on India - Market size and forecast 2022-2027 ($ million)
- Exhibits13: Chart on India: Year-over-year growth 2022-2027 (%)
- Exhibits14: Data Table on India: Year-over-year growth 2022-2027 (%)
- Exhibits15: Historic Market Size - Data Table on Online grocery market in India 2017 - 2021 ($ million)
- Exhibits16: Historic Market Size - Product Segment 2017 - 2021 ($ million)
- Exhibits17: Historic Market Size - Type Segment 2017 - 2021 ($ million)
- Exhibits18: Five forces analysis - Comparison between 2022 and 2027
- Exhibits19: Chart on Bargaining power of buyers - Impact of key factors 2022 and 2027
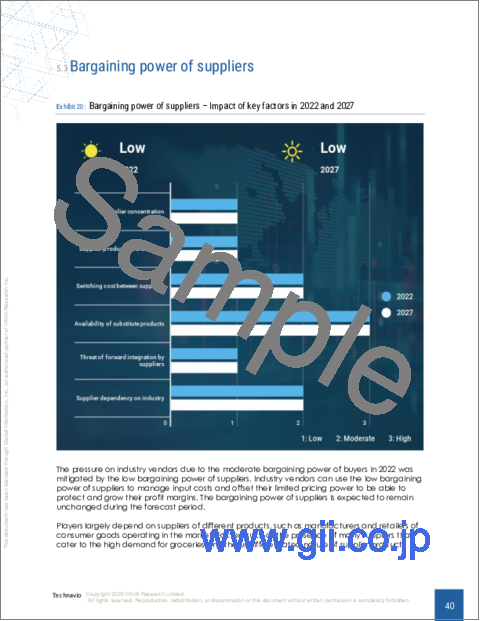
- Exhibits20: Bargaining power of suppliers - Impact of key factors in 2022 and 2027
- Exhibits21: Threat of new entrants - Impact of key factors in 2022 and 2027
- Exhibits22: Threat of substitutes - Impact of key factors in 2022 and 2027
- Exhibits23: Threat of rivalry - Impact of key factors in 2022 and 2027
- Exhibits24: Chart on Market condition - Five forces 2022 and 2027
- Exhibits25: Chart on Product - Market share 2022-2027 (%)
- Exhibits26: Data Table on Product - Market share 2022-2027 (%)
- Exhibits27: Chart on Comparison by Product
- Exhibits28: Data Table on Comparison by Product
- Exhibits29: Chart on Food products - Market size and forecast 2022-2027 ($ million)
- Exhibits30: Data Table on Food products - Market size and forecast 2022-2027 ($ million)
- Exhibits31: Chart on Food products - Year-over-year growth 2022-2027 (%)
- Exhibits32: Data Table on Food products - Year-over-year growth 2022-2027 (%)
- Exhibits33: Chart on Non-food products - Market size and forecast 2022-2027 ($ million)
- Exhibits34: Data Table on Non-food products - Market size and forecast 2022-2027 ($ million)
- Exhibits35: Chart on Non-food products - Year-over-year growth 2022-2027 (%)
- Exhibits36: Data Table on Non-food products - Year-over-year growth 2022-2027 (%)
- Exhibits37: Market opportunity by Product ($ million)
- Exhibits38: Data Table on Market opportunity by Product ($ million)
- Exhibits39: Chart on Type - Market share 2022-2027 (%)
- Exhibits40: Data Table on Type - Market share 2022-2027 (%)
- Exhibits41: Chart on Comparison by Type
- Exhibits42: Data Table on Comparison by Type
- Exhibits43: Chart on Online - Market size and forecast 2022-2027 ($ million)
- Exhibits44: Data Table on Online - Market size and forecast 2022-2027 ($ million)
- Exhibits45: Chart on Online - Year-over-year growth 2022-2027 (%)
- Exhibits46: Data Table on Online - Year-over-year growth 2022-2027 (%)
- Exhibits47: Chart on Cash on delivery - Market size and forecast 2022-2027 ($ million)
- Exhibits48: Data Table on Cash on delivery - Market size and forecast 2022-2027 ($ million)
- Exhibits49: Chart on Cash on delivery - Year-over-year growth 2022-2027 (%)
- Exhibits50: Data Table on Cash on delivery - Year-over-year growth 2022-2027 (%)
- Exhibits51: Market opportunity by Type ($ million)
- Exhibits52: Data Table on Market opportunity by Type ($ million)
- Exhibits53: Analysis of price sensitivity, lifecycle, customer purchase basket, adoption rates, and purchase criteria
- Exhibits54: Impact of drivers and challenges in 2022 and 2027
- Exhibits55: Overview on Criticality of inputs and Factors of differentiation
- Exhibits56: Overview on factors of disruption
- Exhibits57: Impact of key risks on business
- Exhibits58: Vendors covered
- Exhibits59: Matrix on vendor position and classification
- Exhibits60: Amazon.com Inc. - Overview
- Exhibits61: Amazon.com Inc. - Business segments
- Exhibits62: Amazon.com Inc. - Key news
- Exhibits63: Amazon.com Inc. - Key offerings
- Exhibits64: Amazon.com Inc. - Segment focus
- Exhibits65: Avenue Ecommerce Ltd. - Overview
- Exhibits66: Avenue Ecommerce Ltd. - Product / Service
- Exhibits67: Avenue Ecommerce Ltd. - Key offerings
- Exhibits68: Blink Commerce Pvt. Ltd. - Overview
- Exhibits69: Blink Commerce Pvt. Ltd. - Product / Service
- Exhibits70: Blink Commerce Pvt. Ltd. - Key offerings
- Exhibits71: Dookan Technologies s.r.o - Overview
- Exhibits72: Dookan Technologies s.r.o - Product / Service
- Exhibits73: Dookan Technologies s.r.o - Key offerings
- Exhibits74: Dunzo Digital Pvt. Ltd. - Overview
- Exhibits75: Dunzo Digital Pvt. Ltd. - Product / Service
- Exhibits76: Dunzo Digital Pvt. Ltd. - Key offerings
- Exhibits77: Flipkart Internet Pvt. Ltd. - Overview
- Exhibits78: Flipkart Internet Pvt. Ltd. - Product / Service
- Exhibits79: Flipkart Internet Pvt. Ltd. - Key offerings
- Exhibits80: Fresh to Home - Overview
- Exhibits81: Fresh to Home - Product / Service
- Exhibits82: Fresh to Home - Key offerings
- Exhibits83: GFOI retail Pvt. Ltd. - Overview
- Exhibits84: GFOI retail Pvt. Ltd. - Product / Service
- Exhibits85: GFOI retail Pvt. Ltd. - Key offerings
- Exhibits86: Innovative Retail Concepts Pvt. Ltd. - Overview
- Exhibits87: Innovative Retail Concepts Pvt. Ltd. - Product / Service
- Exhibits88: Innovative Retail Concepts Pvt. Ltd. - Key offerings
- Exhibits89: One97 Communications Ltd. - Overview
- Exhibits90: One97 Communications Ltd. - Product / Service
- Exhibits91: One97 Communications Ltd. - Key offerings
- Exhibits92: Reliance Industries Ltd. - Overview
- Exhibits93: Reliance Industries Ltd. - Business segments
- Exhibits94: Reliance Industries Ltd. - Key news
- Exhibits95: Reliance Industries Ltd. - Key offerings
- Exhibits96: Reliance Industries Ltd. - Segment focus
- Exhibits97: RP Sanjiv Goenka Group - Overview
- Exhibits98: RP Sanjiv Goenka Group - Product / Service
- Exhibits99: RP Sanjiv Goenka Group - Key news
- Exhibits100: RP Sanjiv Goenka Group - Key offerings
- Exhibits101: SPAR Group Inc. - Overview
- Exhibits102: SPAR Group Inc. - Business segments
- Exhibits103: SPAR Group Inc. - Key offerings
- Exhibits104: SPAR Group Inc. - Segment focus
- Exhibits105: Tata Sons Pvt. Ltd. - Overview
- Exhibits106: Tata Sons Pvt. Ltd. - Business segments
- Exhibits107: Tata Sons Pvt. Ltd. - Key offerings
- Exhibits108: Tata Sons Pvt. Ltd. - Segment focus
- Exhibits109: Zepto - Overview
- Exhibits110: Zepto - Product / Service
- Exhibits111: Zepto - Key offerings
- Exhibits112: Inclusions checklist
- Exhibits113: Exclusions checklist
- Exhibits114: Currency conversion rates for US$
- Exhibits115: Research methodology
- Exhibits116: Validation techniques employed for market sizing
- Exhibits117: Information sources
- Exhibits118: List of abbreviations
Online Grocery Market in India 2023-2027
Technavio has been monitoring the online grocery market in India and is forecast to grow by $7417.46 mn during 2022-2027, accelerating at a CAGR of 20.33% during the forecast period. Our report on the online grocery market in India provides a holistic analysis, market size and forecast, trends, growth drivers, and challenges, as well as vendor analysis covering around 25 vendors.
The report offers an up-to-date analysis regarding the current market scenario, the latest trends and drivers, and the overall market environment. The market is driven by increased popularity and rise in e-commerce platforms, rise in disposable income among consumers in India, and rapid growth in m-commerce.
Technavio's online grocery market in India is segmented as below:
By Product
- Food products
- Non-food products
By Type
- Online
- Cash on delivery
This study identifies the growth in demand for functional foods and beverages as one of the prime reasons driving the online grocery market growth during the next few years. Also, increasing number of grocery stores with online services and increase in usage of flexible payment and delivery services will lead to sizable demand in the market.
Technavio presents a detailed picture of the market by the way of study, synthesis, and summation of data from multiple sources by an analysis of key parameters. Our report on the online grocery market in India covers the following areas:
- Online grocery market sizing
- Online grocery market forecast
- Online grocery market industry analysis
Technavio's robust vendor analysis is designed to help clients improve their market position, and in line with this, this report provides a detailed analysis of several leading online grocery market vendors that include Amazon.com Inc., Avenue Ecommerce Ltd., B.L. Agro Industries Ltd., Blink Commerce Pvt. Ltd., Brisam Retail Pvt. Ltd., Dookan Technologies s.r.o, Dunzo Digital Pvt. Ltd., Flipkart Internet Pvt. Ltd., Flora foods, Fresh to Home, GFOI retail Pvt. Ltd., Heritage Foods Ltd., Innovative Retail Concepts Pvt. Ltd., One97 Communications Ltd., Reliance Industries Ltd., RP Sanjiv Goenka Group, Satvika Bio Foods India Pvt. Ltd., SPAR Group Inc., Tata Sons Pvt. Ltd., and Zepto. Also, the online grocery market in India analysis report includes information on upcoming trends and challenges that will influence market growth. This is to help companies strategize and leverage all forthcoming growth opportunities.
The study was conducted using an objective combination of primary and secondary information including inputs from key participants in the industry. The report contains a comprehensive market and vendor landscape in addition to an analysis of the key vendors.
Technavio presents a detailed picture of the market by the way of study, synthesis, and summation of data from multiple sources by an analysis of key parameters such as profit, pricing, competition, and promotions. It presents various market facets by identifying the key industry influencers. The data presented is comprehensive, reliable, and a result of extensive research - both primary and secondary. Technavio's market research reports provide a complete competitive landscape and an in-depth vendor selection methodology and analysis using qualitative and quantitative research to forecast accurate market growth.
Table of Contents
1 Executive Summary
- 1.1 Market overview
- Exhibit 01: Executive Summary - Chart on Market Overview
- Exhibit 02: Executive Summary - Data Table on Market Overview
- Exhibit 03: Executive Summary - Chart on Country Market Characteristics
- Exhibit 04: Executive Summary - Chart on Market Segmentation by Product
- Exhibit 05: Executive Summary - Chart on Market Segmentation by Type
- Exhibit 06: Executive Summary - Chart on Vendor Market Positioning
2 Market Landscape
- 2.1 Market ecosystem
- Exhibit 07: Parent market
- Exhibit 08: Market Characteristics
3 Market Sizing
- 3.1 Market definition
- Exhibit 09: Offerings of vendors included in the market definition
- 3.2 Market segment analysis
- Exhibit 10: Market segments
- 3.3 Market size 2022
- 3.4 Market outlook: Forecast for 2022-2027
- Exhibit 11: Chart on India - Market size and forecast 2022-2027 ($ million)
- Exhibit 12: Data Table on India - Market size and forecast 2022-2027 ($ million)
- Exhibit 13: Chart on India: Year-over-year growth 2022-2027 (%)
- Exhibit 14: Data Table on India: Year-over-year growth 2022-2027 (%)
4 Historic Market Size
- 4.1 Online grocery market in India 2017 - 2021
- Exhibit 15: Historic Market Size - Data Table on Online grocery market in India 2017 - 2021 ($ million)
- 4.2 Product Segment Analysis 2017 - 2021
- Exhibit 16: Historic Market Size - Product Segment 2017 - 2021 ($ million)
- 4.3 Type Segment Analysis 2017 - 2021
- Exhibit 17: Historic Market Size - Type Segment 2017 - 2021 ($ million)
5 Five Forces Analysis
- 5.1 Five forces summary
- Exhibit 18: Five forces analysis - Comparison between 2022 and 2027
- 5.2 Bargaining power of buyers
- Exhibit 19: Chart on Bargaining power of buyers - Impact of key factors 2022 and 2027
- 5.3 Bargaining power of suppliers
- Exhibit 20: Bargaining power of suppliers - Impact of key factors in 2022 and 2027
- 5.4 Threat of new entrants
- Exhibit 21: Threat of new entrants - Impact of key factors in 2022 and 2027
- 5.5 Threat of substitutes
- Exhibit 22: Threat of substitutes - Impact of key factors in 2022 and 2027
- 5.6 Threat of rivalry
- Exhibit 23: Threat of rivalry - Impact of key factors in 2022 and 2027
- 5.7 Market condition
- Exhibit 24: Chart on Market condition - Five forces 2022 and 2027
6 Market Segmentation by Product
- 6.1 Market segments
- Exhibit 25: Chart on Product - Market share 2022-2027 (%)
- Exhibit 26: Data Table on Product - Market share 2022-2027 (%)
- 6.2 Comparison by Product
- Exhibit 27: Chart on Comparison by Product
- Exhibit 28: Data Table on Comparison by Product
- 6.3 Food products - Market size and forecast 2022-2027
- Exhibit 29: Chart on Food products - Market size and forecast 2022-2027 ($ million)
- Exhibit 30: Data Table on Food products - Market size and forecast 2022-2027 ($ million)
- Exhibit 31: Chart on Food products - Year-over-year growth 2022-2027 (%)
- Exhibit 32: Data Table on Food products - Year-over-year growth 2022-2027 (%)
- 6.4 Non-food products - Market size and forecast 2022-2027
- Exhibit 33: Chart on Non-food products - Market size and forecast 2022-2027 ($ million)
- Exhibit 34: Data Table on Non-food products - Market size and forecast 2022-2027 ($ million)
- Exhibit 35: Chart on Non-food products - Year-over-year growth 2022-2027 (%)
- Exhibit 36: Data Table on Non-food products - Year-over-year growth 2022-2027 (%)
- 6.5 Market opportunity by Product
- Exhibit 37: Market opportunity by Product ($ million)
- Exhibit 38: Data Table on Market opportunity by Product ($ million)
7 Market Segmentation by Type
- 7.1 Market segments
- Exhibit 39: Chart on Type - Market share 2022-2027 (%)
- Exhibit 40: Data Table on Type - Market share 2022-2027 (%)
- 7.2 Comparison by Type
- Exhibit 41: Chart on Comparison by Type
- Exhibit 42: Data Table on Comparison by Type
- 7.3 Online - Market size and forecast 2022-2027
- Exhibit 43: Chart on Online - Market size and forecast 2022-2027 ($ million)
- Exhibit 44: Data Table on Online - Market size and forecast 2022-2027 ($ million)
- Exhibit 45: Chart on Online - Year-over-year growth 2022-2027 (%)
- Exhibit 46: Data Table on Online - Year-over-year growth 2022-2027 (%)
- 7.4 Cash on delivery - Market size and forecast 2022-2027
- Exhibit 47: Chart on Cash on delivery - Market size and forecast 2022-2027 ($ million)
- Exhibit 48: Data Table on Cash on delivery - Market size and forecast 2022-2027 ($ million)
- Exhibit 49: Chart on Cash on delivery - Year-over-year growth 2022-2027 (%)
- Exhibit 50: Data Table on Cash on delivery - Year-over-year growth 2022-2027 (%)
- 7.5 Market opportunity by Type
- Exhibit 51: Market opportunity by Type ($ million)
- Exhibit 52: Data Table on Market opportunity by Type ($ million)
8 Customer Landscape
- 8.1 Customer landscape overview
- Exhibit 53: Analysis of price sensitivity, lifecycle, customer purchase basket, adoption rates, and purchase criteria
9 Drivers, Challenges, and Trends
- 9.1 Market drivers
- 9.2 Market challenges
- 9.3 Impact of drivers and challenges
- Exhibit 54: Impact of drivers and challenges in 2022 and 2027
- 9.4 Market trends
10 Vendor Landscape
- 10.1 Overview
- 10.2 Vendor landscape
- Exhibit 55: Overview on Criticality of inputs and Factors of differentiation
- 10.3 Landscape disruption
- Exhibit 56: Overview on factors of disruption
- 10.4 Industry risks
- Exhibit 57: Impact of key risks on business
11 Vendor Analysis
- 11.1 Vendors covered
- Exhibit 58: Vendors covered
- 11.2 Market positioning of vendors
- Exhibit 59: Matrix on vendor position and classification
- 11.3 Amazon.com Inc.
- Exhibit 60: Amazon.com Inc. - Overview
- Exhibit 61: Amazon.com Inc. - Business segments
- Exhibit 62: Amazon.com Inc. - Key news
- Exhibit 63: Amazon.com Inc. - Key offerings
- Exhibit 64: Amazon.com Inc. - Segment focus
- 11.4 Avenue Ecommerce Ltd.
- Exhibit 65: Avenue Ecommerce Ltd. - Overview
- Exhibit 66: Avenue Ecommerce Ltd. - Product / Service
- Exhibit 67: Avenue Ecommerce Ltd. - Key offerings
- 11.5 Blink Commerce Pvt. Ltd.
- Exhibit 68: Blink Commerce Pvt. Ltd. - Overview
- Exhibit 69: Blink Commerce Pvt. Ltd. - Product / Service
- Exhibit 70: Blink Commerce Pvt. Ltd. - Key offerings
- 11.6 Dookan Technologies s.r.o
- Exhibit 71: Dookan Technologies s.r.o - Overview
- Exhibit 72: Dookan Technologies s.r.o - Product / Service
- Exhibit 73: Dookan Technologies s.r.o - Key offerings
- 11.7 Dunzo Digital Pvt. Ltd.
- Exhibit 74: Dunzo Digital Pvt. Ltd. - Overview
- Exhibit 75: Dunzo Digital Pvt. Ltd. - Product / Service
- Exhibit 76: Dunzo Digital Pvt. Ltd. - Key offerings
- 11.8 Flipkart Internet Pvt. Ltd.
- Exhibit 77: Flipkart Internet Pvt. Ltd. - Overview
- Exhibit 78: Flipkart Internet Pvt. Ltd. - Product / Service
- Exhibit 79: Flipkart Internet Pvt. Ltd. - Key offerings
- 11.9 Fresh to Home
- Exhibit 80: Fresh to Home - Overview
- Exhibit 81: Fresh to Home - Product / Service
- Exhibit 82: Fresh to Home - Key offerings
- 11.10 GFOI retail Pvt. Ltd.
- Exhibit 83: GFOI retail Pvt. Ltd. - Overview
- Exhibit 84: GFOI retail Pvt. Ltd. - Product / Service
- Exhibit 85: GFOI retail Pvt. Ltd. - Key offerings
- 11.11 Innovative Retail Concepts Pvt. Ltd.
- Exhibit 86: Innovative Retail Concepts Pvt. Ltd. - Overview
- Exhibit 87: Innovative Retail Concepts Pvt. Ltd. - Product / Service
- Exhibit 88: Innovative Retail Concepts Pvt. Ltd. - Key offerings
- 11.12 One97 Communications Ltd.
- Exhibit 89: One97 Communications Ltd. - Overview
- Exhibit 90: One97 Communications Ltd. - Product / Service
- Exhibit 91: One97 Communications Ltd. - Key offerings
- 11.13 Reliance Industries Ltd.
- Exhibit 92: Reliance Industries Ltd. - Overview
- Exhibit 93: Reliance Industries Ltd. - Business segments
- Exhibit 94: Reliance Industries Ltd. - Key news
- Exhibit 95: Reliance Industries Ltd. - Key offerings
- Exhibit 96: Reliance Industries Ltd. - Segment focus
- 11.14 RP Sanjiv Goenka Group
- Exhibit 97: RP Sanjiv Goenka Group - Overview
- Exhibit 98: RP Sanjiv Goenka Group - Product / Service
- Exhibit 99: RP Sanjiv Goenka Group - Key news
- Exhibit 100: RP Sanjiv Goenka Group - Key offerings
- 11.15 SPAR Group Inc.
- Exhibit 101: SPAR Group Inc. - Overview
- Exhibit 102: SPAR Group Inc. - Business segments
- Exhibit 103: SPAR Group Inc. - Key offerings
- Exhibit 104: SPAR Group Inc. - Segment focus
- 11.16 Tata Sons Pvt. Ltd.
- Exhibit 105: Tata Sons Pvt. Ltd. - Overview
- Exhibit 106: Tata Sons Pvt. Ltd. - Business segments
- Exhibit 107: Tata Sons Pvt. Ltd. - Key offerings
- Exhibit 108: Tata Sons Pvt. Ltd. - Segment focus
- 11.17 Zepto
- Exhibit 109: Zepto - Overview
- Exhibit 110: Zepto - Product / Service
- Exhibit 111: Zepto - Key offerings
12 Appendix
- 12.1 Scope of the report
- 12.2 Inclusions and exclusions checklist
- Exhibit 112: Inclusions checklist
- Exhibit 113: Exclusions checklist
- 12.3 Currency conversion rates for US$
- Exhibit 114: Currency conversion rates for US$
- 12.4 Research methodology
- Exhibit 115: Research methodology
- Exhibit 116: Validation techniques employed for market sizing
- Exhibit 117: Information sources
- 12.5 List of abbreviations
- Exhibit 118: List of abbreviations