|
|
市場調査レポート
商品コード
1915281
世界のテキスト分析市場2026-2030年Global Text Analytics Market 2026-2030 |
||||||
|
|||||||
カスタマイズ可能
|
|||||||

| 世界のテキスト分析市場2026-2030年 |
|
出版日: 2026年01月19日
発行: TechNavio
ページ情報: 英文 296 Pages
納期: 即納可能
|

概要
世界のテキスト分析市場は、2025年から2030年にかけて274億8,090万米ドル規模に成長し、予測期間中のCAGRは23.5%に達すると予測されています。
本レポートでは、世界のテキスト分析市場に関する包括的な分析、市場規模と予測、動向、成長要因、課題に加え、約25社のベンダー分析を提供しております。
本レポートは、現在の市場状況、最新の動向と促進要因、市場環境全般に関する最新の分析を提供します。市場は、デジタルチャネルにおける非構造化テキストデータの急激な増加、顧客体験管理と感情分析への需要の高まり、自然言語処理(NLP)およびAI技術の進歩によって牽引されています。
本調査は、業界の主要関係者からの情報を含む一次情報と二次情報を客観的に組み合わせて実施されました。本レポートには、主要企業の分析に加え、包括的な市場規模データ、地域別分析を伴うセグメント、ベンダー情勢が含まれています。レポートには過去データと予測データが掲載されています。
| 市場範囲 | |
|---|---|
| 基準年 | 2026年 |
| 終了年 | 2030年 |
| 予測期間 | 2026-2030 |
| 成長モメンタム | 加速 |
| 前年比2026年 | 21.5% |
| CAGR | 23.5% |
| 増分額 | 274億8,090万米ドル |
本調査では、今後数年間における世界のテキスト分析市場成長を牽引する主要要因の一つとして、リアルタイムおよびストリーミングテキスト分析の採用拡大を挙げております。また、リスク管理やコンプライアンス監視におけるテキスト分析の利用拡大、ならびに業界特化型およびドメイン特化型テキスト分析ソリューションの拡充が、市場における相当な需要創出につながると見込まれます。
目次
第1章 エグゼクティブサマリー
第2章 Technavio分析
- 価格・ライフサイクル・顧客購入バスケット・採用率・購入基準の分析
- インプットの重要性と差別化の要因
- 混乱の要因
- 促進要因と課題の影響
第3章 市場情勢
- 市場エコシステム
- 市場の特徴
- バリューチェーン分析
第4章 市場規模
- 市場の定義
- 市場セグメント分析
- 市場規模 2025
- 市場の見通し 2025-2030
第5章 市場規模実績
- 世界のテキスト分析市場 2020-2024
- 展開セグメント分析 2020-2024
- 部品セグメント分析 2020-2024
- エンドユーザーセグメント分析 2020-2024
- 地域別セグメント分析 2020-2024
- 国別セグメント分析 2020-2024
第6章 定性分析
- AIが世界のテキスト分析市場
第7章 ファイブフォース分析
- ファイブフォースの要約
- 買い手の交渉力
- 供給企業の交渉力
- 新規参入業者の脅威
- 代替品の脅威
- 競争の脅威
- 市況
第8章 市場セグメンテーション:展開別
- 比較:展開別
- クラウド
- オンプレミス
- 市場機会:展開別
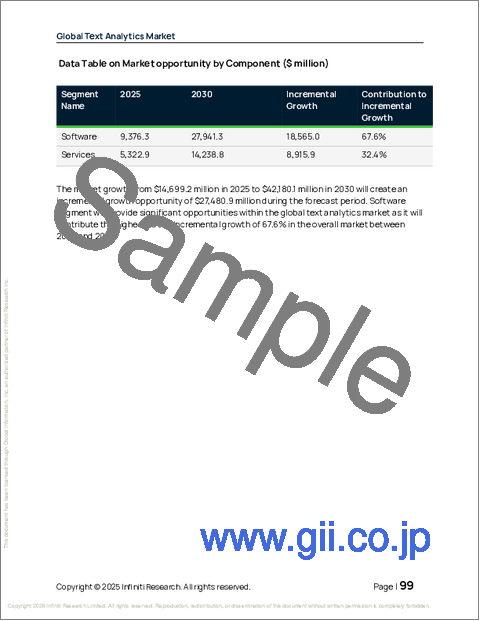
第9章 市場セグメンテーション:コンポーネント別
- 比較:コンポーネント別
- ソフトウェア
- サービス
- 市場機会:コンポーネント別
第10章 市場セグメンテーション:エンドユーザー別
- 比較:エンドユーザー別
- BFSI
- ヘルスケア
- エネルギー・公益事業
- その他
- 市場機会:エンドユーザー別
第11章 顧客情勢
第12章 地域別情勢
- 地域別セグメンテーション
- 地域別比較
- 欧州
- 英国
- ドイツ
- フランス
- イタリア
- スペイン
- オランダ
- アジア太平洋
- 中国
- 日本
- インド
- 韓国
- オーストラリア
- インドネシア
- 北米
- 米国
- カナダ
- メキシコ
- 中東・アフリカ
- アラブ首長国連邦
- サウジアラビア
- 南アフリカ
- イスラエル
- トルコ
- 南米
- ブラジル
- アルゼンチン
- コロンビア
- 市場機会:地域別
第13章 促進要因・課題・機会
- 市場促進要因
- 市場の課題
- 促進要因と課題の影響
- 市場機会
第14章 競合情勢
- 概要
- 競合情勢
- 混乱の状況
- 業界のリスク
第15章 競合分析
- 企業プロファイル
- 企業ランキング指標
- 企業の市場ポジショニング
- Google LLC
- IBM Corp.
- Infegy
- InMoment Inc.
- KNIME AG
- Luminoso Technologies Inc.
- Megaputer Intelligence Inc.
- Microsoft Corp.
- NICE Ltd.
- Open Text Corp.
- Oracle Corp.
- Qualtrics LLC
- SAP SE
- SAS Institute Inc.
- TIBCO Software Inc.

