|
|
市場調査レポート
商品コード
1501969
セットトップボックスの世界市場 2024-2028Global set-top box market 2024-2028 |
||||||
|
|||||||
カスタマイズ可能
|
|||||||


| セットトップボックスの世界市場 2024-2028 |
|
出版日: 2024年05月17日
発行: TechNavio
ページ情報: 英文 174 Pages
納期: 即納可能
|

全表示
- 概要
- 図表
- 目次
セットトップボックス市場は2023-2028年に81億6,200万米ドル、予測期間中のCAGRは5.79%で成長すると予測されます。
当レポートでは、セットトップボックス市場の全体的な分析、市場規模・予測、動向、成長促進要因、課題、約25のベンダーを網羅したベンダー分析などを掲載しています。
現在の市場シナリオ、最新動向と促進要因、市場環境全体に関する最新分析を提供しています。セットトップボックスへの音声制御の統合、製品発売の増加、M&Aの増加などが市場を牽引しています。
| 市場範囲 | |
|---|---|
| 基準年 | 2024 |
| 終了年 | 2028 |
| 予測期間 | 2024-2028 |
| 成長モメンタム | 加速 |
| 前年比2024年 | 5.39% |
| CAGR | 5.79% |
| 増分額 | 81億6,200万米ドル |
本調査では、今後数年間のセットトップボックス市場成長を牽引する主な要因として、ドラマチップの価格下落を挙げています。また、テレビにアクセスできる世帯数の増加とセットトップボックスへの新技術の統合が市場の大きな需要につながります。
目次
第1章 エグゼクティブサマリー
- 市場概要
第2章 市場情勢
- 市場エコシステム
- 市場の特徴
- バリューチェーン分析
第3章 市場規模の評価
- 市場の定義
- 市場セグメント分析
- 市場規模 2023
- 市場の見通し 2023-2028
第4章 市場規模実績
- 世界のセットトップボックス市場 2018-2022
- タイプ別セグメント分析 2018-2022
- ストリーミングタイプ別セグメント分析 2018-2022
- 地域別セグメント分析 2018-2022
- 国別セグメント分析 2018-2022
第5章 ファイブフォース分析
- ファイブフォースの要約
- 買い手の交渉力
- 供給企業の交渉力
- 新規参入業者の脅威
- 代替品の脅威
- 競争の脅威
- 市況
第6章 市場セグメンテーション:タイプ別
- 市場セグメンテーション
- 比較:タイプ別
- 衛星セットトップボックス:市場規模と予測 2023-2028
- DTTセットトップボックス:市場規模と予測 2023-2028
- IPTVセットトップボックス:市場規模と予測 2023-2028
- OTTセットトップボックス:市場規模と予測 2023-2028
- ケーブルセットトップボックス:市場規模と予測 2023-2028
- 市場機会:タイプ別
第7章 市場セグメンテーション:ストリーミングタイプ別
- 市場セグメンテーション
- 比較:ストリーミングタイプ別
- HDセットトップボックス:市場規模と予測 2023-2028
- SDセットトップボックス:市場規模と予測 2023-2028
- 市場機会:ストリーミングタイプ別
第8章 顧客情勢
- 顧客情勢の概要
第9章 地域別情勢
- 地域別セグメンテーション
- 地域別比較
- アジア太平洋:市場規模と予測 2023-2028
- 欧州:市場規模と予測 2023-2028
- 北米:市場規模と予測 2023-2028
- 南米:市場規模と予測 2023-2028
- 中東・アフリカ:市場規模と予測 2023-2028
- 米国:市場規模と予測 2023-2028
- 中国:市場規模と予測 2023-2028
- 日本:市場規模と予測 2023-2028
- インド:市場規模と予測 2023-2028
- ドイツ:市場規模と予測 2023-2028
- 市場機会:地域別
第10章 促進要因・課題・機会・抑制要因
- 市場促進要因
- 市場の課題
- 促進要因と課題の影響
- 市場の機会・抑制要因
第11章 競合情勢
- 概要
- 競合情勢
- 混乱の状況
- 業界のリスク
第12章 競合分析
- 企業プロファイル
- 企業の市場ポジショニング
- ABOX42 GmbH
- Advanced Digital Broadcast SA
- Broadcom Inc.
- Catvision Ltd.
- Comcast Corp.
- CommScope Holding Co. Inc.
- DISH Network L.L.C.
- EchoStar Corp.
- Huawei Technologies Co. Ltd.
- HUMAX Electronics Co. Ltd.
- MyBox Technologies Pvt Ltd.
- Roku Inc.
- Sagemcom Broadband SAS
- Samsung Electronics Co. Ltd.
- Shenzhen SDMC Technology Co Ltd
第13章 付録
Exhibits:
- Exhibits1: Executive Summary - Chart on Market Overview
- Exhibits2: Executive Summary - Data Table on Market Overview
- Exhibits3: Executive Summary - Chart on Global Market Characteristics
- Exhibits4: Executive Summary - Chart on Market by Geography
- Exhibits5: Executive Summary - Chart on Market Segmentation by Type
- Exhibits6: Executive Summary - Chart on Market Segmentation by Streaming Type
- Exhibits7: Executive Summary - Chart on Incremental Growth
- Exhibits8: Executive Summary - Data Table on Incremental Growth
- Exhibits9: Executive Summary - Chart on Company Market Positioning
- Exhibits10: Parent Market
- Exhibits11: Data Table on - Parent Market
- Exhibits12: Market characteristics analysis
- Exhibits13: Value Chain Analysis
- Exhibits14: Offerings of companies included in the market definition
- Exhibits15: Market segments
- Exhibits16: Chart on Global - Market size and forecast 2023-2028 ($ million)
- Exhibits17: Data Table on Global - Market size and forecast 2023-2028 ($ million)
- Exhibits18: Chart on Global Market: Year-over-year growth 2023-2028 (%)
- Exhibits19: Data Table on Global Market: Year-over-year growth 2023-2028 (%)
- Exhibits20: Historic Market Size - Data Table on Global Set-Top Box Market 2018 - 2022 ($ million)
- Exhibits21: Historic Market Size - Type Segment 2018 - 2022 ($ million)
- Exhibits22: Historic Market Size - Streaming Type Segment 2018 - 2022 ($ million)
- Exhibits23: Historic Market Size - Geography Segment 2018 - 2022 ($ million)
- Exhibits24: Historic Market Size - Country Segment 2018 - 2022 ($ million)
- Exhibits25: Five forces analysis - Comparison between 2023 and 2028
- Exhibits26: Bargaining power of buyers - Impact of key factors 2023 and 2028
- Exhibits27: Bargaining power of suppliers - Impact of key factors in 2023 and 2028
- Exhibits28: Threat of new entrants - Impact of key factors in 2023 and 2028
- Exhibits29: Threat of substitutes - Impact of key factors in 2023 and 2028
- Exhibits30: Threat of rivalry - Impact of key factors in 2023 and 2028
- Exhibits31: Chart on Market condition - Five forces 2023 and 2028
- Exhibits32: Chart on Type - Market share 2023-2028 (%)
- Exhibits33: Data Table on Type - Market share 2023-2028 (%)
- Exhibits34: Chart on Comparison by Type
- Exhibits35: Data Table on Comparison by Type
- Exhibits36: Chart on Satellite set-top box - Market size and forecast 2023-2028 ($ million)
- Exhibits37: Data Table on Satellite set-top box - Market size and forecast 2023-2028 ($ million)
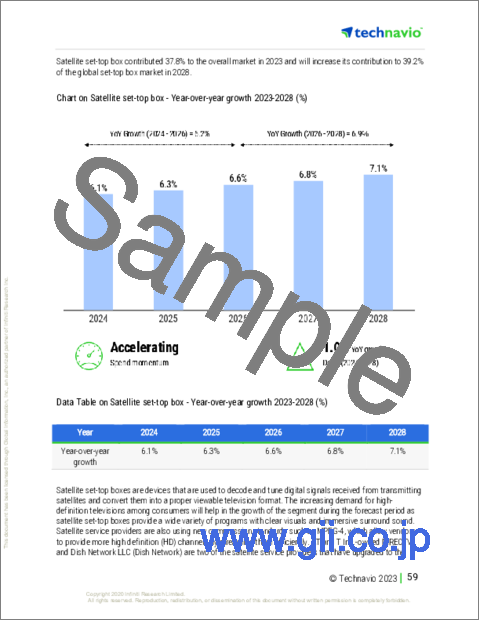
- Exhibits38: Chart on Satellite set-top box - Year-over-year growth 2023-2028 (%)
- Exhibits39: Data Table on Satellite set-top box - Year-over-year growth 2023-2028 (%)
- Exhibits40: Chart on DTT set-top box - Market size and forecast 2023-2028 ($ million)
- Exhibits41: Data Table on DTT set-top box - Market size and forecast 2023-2028 ($ million)
- Exhibits42: Chart on DTT set-top box - Year-over-year growth 2023-2028 (%)
- Exhibits43: Data Table on DTT set-top box - Year-over-year growth 2023-2028 (%)
- Exhibits44: Chart on IPTV set-top box - Market size and forecast 2023-2028 ($ million)
- Exhibits45: Data Table on IPTV set-top box - Market size and forecast 2023-2028 ($ million)
- Exhibits46: Chart on IPTV set-top box - Year-over-year growth 2023-2028 (%)
- Exhibits47: Data Table on IPTV set-top box - Year-over-year growth 2023-2028 (%)
- Exhibits48: Chart on OTT set-top box - Market size and forecast 2023-2028 ($ million)
- Exhibits49: Data Table on OTT set-top box - Market size and forecast 2023-2028 ($ million)
- Exhibits50: Chart on OTT set-top box - Year-over-year growth 2023-2028 (%)
- Exhibits51: Data Table on OTT set-top box - Year-over-year growth 2023-2028 (%)
- Exhibits52: Chart on Cable set-top box - Market size and forecast 2023-2028 ($ million)
- Exhibits53: Data Table on Cable set-top box - Market size and forecast 2023-2028 ($ million)
- Exhibits54: Chart on Cable set-top box - Year-over-year growth 2023-2028 (%)
- Exhibits55: Data Table on Cable set-top box - Year-over-year growth 2023-2028 (%)
- Exhibits56: Market opportunity by Type ($ million)
- Exhibits57: Data Table on Market opportunity by Type ($ million)
- Exhibits58: Chart on Streaming Type - Market share 2023-2028 (%)
- Exhibits59: Data Table on Streaming Type - Market share 2023-2028 (%)
- Exhibits60: Chart on Comparison by Streaming Type
- Exhibits61: Data Table on Comparison by Streaming Type
- Exhibits62: Chart on HD set-top box - Market size and forecast 2023-2028 ($ million)
- Exhibits63: Data Table on HD set-top box - Market size and forecast 2023-2028 ($ million)
- Exhibits64: Chart on HD set-top box - Year-over-year growth 2023-2028 (%)
- Exhibits65: Data Table on HD set-top box - Year-over-year growth 2023-2028 (%)
- Exhibits66: Chart on SD set-top box - Market size and forecast 2023-2028 ($ million)
- Exhibits67: Data Table on SD set-top box - Market size and forecast 2023-2028 ($ million)
- Exhibits68: Chart on SD set-top box - Year-over-year growth 2023-2028 (%)
- Exhibits69: Data Table on SD set-top box - Year-over-year growth 2023-2028 (%)
- Exhibits70: Chart on 4K set-top box - Market size and forecast 2023-2028 ($ million)
- Exhibits71: Data Table on 4K set-top box - Market size and forecast 2023-2028 ($ million)
- Exhibits72: Chart on 4K set-top box - Year-over-year growth 2023-2028 (%)
- Exhibits73: Data Table on 4K set-top box - Year-over-year growth 2023-2028 (%)
- Exhibits74: Market opportunity by Streaming Type ($ million)
- Exhibits75: Data Table on Market opportunity by Streaming Type ($ million)
- Exhibits76: Analysis of price sensitivity, lifecycle, customer purchase basket, adoption rates, and purchase criteria
- Exhibits77: Chart on Market share By Geographical Landscape2023-2028 (%)
- Exhibits78: Data Table on Market share By Geographical Landscape2023-2028 (%)
- Exhibits79: Chart on Geographic comparison
- Exhibits80: Data Table on Geographic comparison
- Exhibits81: Chart on APAC - Market size and forecast 2023-2028 ($ million)
- Exhibits82: Data Table on APAC - Market size and forecast 2023-2028 ($ million)
- Exhibits83: Chart on APAC - Year-over-year growth 2023-2028 (%)
- Exhibits84: Data Table on APAC - Year-over-year growth 2023-2028 (%)
- Exhibits85: Chart on Europe - Market size and forecast 2023-2028 ($ million)
- Exhibits86: Data Table on Europe - Market size and forecast 2023-2028 ($ million)
- Exhibits87: Chart on Europe - Year-over-year growth 2023-2028 (%)
- Exhibits88: Data Table on Europe - Year-over-year growth 2023-2028 (%)
- Exhibits89: Chart on North America - Market size and forecast 2023-2028 ($ million)
- Exhibits90: Data Table on North America - Market size and forecast 2023-2028 ($ million)
- Exhibits91: Chart on North America - Year-over-year growth 2023-2028 (%)
- Exhibits92: Data Table on North America - Year-over-year growth 2023-2028 (%)
- Exhibits93: Chart on South America - Market size and forecast 2023-2028 ($ million)
- Exhibits94: Data Table on South America - Market size and forecast 2023-2028 ($ million)
- Exhibits95: Chart on South America - Year-over-year growth 2023-2028 (%)
- Exhibits96: Data Table on South America - Year-over-year growth 2023-2028 (%)
- Exhibits97: Chart on Middle East and Africa - Market size and forecast 2023-2028 ($ million)
- Exhibits98: Data Table on Middle East and Africa - Market size and forecast 2023-2028 ($ million)
- Exhibits99: Chart on Middle East and Africa - Year-over-year growth 2023-2028 (%)
- Exhibits100: Data Table on Middle East and Africa - Year-over-year growth 2023-2028 (%)
- Exhibits101: Chart on US - Market size and forecast 2023-2028 ($ million)
- Exhibits102: Data Table on US - Market size and forecast 2023-2028 ($ million)
- Exhibits103: Chart on US - Year-over-year growth 2023-2028 (%)
- Exhibits104: Data Table on US - Year-over-year growth 2023-2028 (%)
- Exhibits105: Chart on China - Market size and forecast 2023-2028 ($ million)
- Exhibits106: Data Table on China - Market size and forecast 2023-2028 ($ million)
- Exhibits107: Chart on China - Year-over-year growth 2023-2028 (%)
- Exhibits108: Data Table on China - Year-over-year growth 2023-2028 (%)
- Exhibits109: Chart on Japan - Market size and forecast 2023-2028 ($ million)
- Exhibits110: Data Table on Japan - Market size and forecast 2023-2028 ($ million)
- Exhibits111: Chart on Japan - Year-over-year growth 2023-2028 (%)
- Exhibits112: Data Table on Japan - Year-over-year growth 2023-2028 (%)
- Exhibits113: Chart on India - Market size and forecast 2023-2028 ($ million)
- Exhibits114: Data Table on India - Market size and forecast 2023-2028 ($ million)
- Exhibits115: Chart on India - Year-over-year growth 2023-2028 (%)
- Exhibits116: Data Table on India - Year-over-year growth 2023-2028 (%)
- Exhibits117: Chart on Germany - Market size and forecast 2023-2028 ($ million)
- Exhibits118: Data Table on Germany - Market size and forecast 2023-2028 ($ million)
- Exhibits119: Chart on Germany - Year-over-year growth 2023-2028 (%)
- Exhibits120: Data Table on Germany - Year-over-year growth 2023-2028 (%)
- Exhibits121: Market opportunity By Geographical Landscape($ million)
- Exhibits122: Data Tables on Market opportunity By Geographical Landscape($ million)
- Exhibits123: Impact of drivers and challenges in 2023 and 2028
- Exhibits124: Overview on criticality of inputs and factors of differentiation
- Exhibits125: Overview on factors of disruption
- Exhibits126: Impact of key risks on business
- Exhibits127: Companies covered
- Exhibits128: Matrix on companies position and classification
- Exhibits129: ABOX42 GmbH - Overview
- Exhibits130: ABOX42 GmbH - Product / Service
- Exhibits131: ABOX42 GmbH - Key offerings
- Exhibits132: Advanced Digital Broadcast SA - Overview
- Exhibits133: Advanced Digital Broadcast SA - Product / Service
- Exhibits134: Advanced Digital Broadcast SA - Key offerings
- Exhibits135: Broadcom Inc. - Overview
- Exhibits136: Broadcom Inc. - Business segments
- Exhibits137: Broadcom Inc. - Key news
- Exhibits138: Broadcom Inc. - Key offerings
- Exhibits139: Broadcom Inc. - Segment focus
- Exhibits140: Catvision Ltd. - Overview
- Exhibits141: Catvision Ltd. - Product / Service
- Exhibits142: Catvision Ltd. - Key offerings
- Exhibits143: Comcast Corp. - Overview
- Exhibits144: Comcast Corp. - Business segments
- Exhibits145: Comcast Corp. - Key offerings
- Exhibits146: Comcast Corp. - Segment focus
- Exhibits147: CommScope Holding Co. Inc. - Overview
- Exhibits148: CommScope Holding Co. Inc. - Business segments
- Exhibits149: CommScope Holding Co. Inc. - Key offerings
- Exhibits150: CommScope Holding Co. Inc. - Segment focus
- Exhibits151: DISH Network L.L.C. - Overview
- Exhibits152: DISH Network L.L.C. - Business segments
- Exhibits153: DISH Network L.L.C. - Key offerings
- Exhibits154: DISH Network L.L.C. - Segment focus
- Exhibits155: EchoStar Corp. - Overview
- Exhibits156: EchoStar Corp. - Business segments
- Exhibits157: EchoStar Corp. - Key offerings
- Exhibits158: EchoStar Corp. - Segment focus
- Exhibits159: Huawei Technologies Co. Ltd. - Overview
- Exhibits160: Huawei Technologies Co. Ltd. - Product / Service
- Exhibits161: Huawei Technologies Co. Ltd. - Key offerings
- Exhibits162: HUMAX Electronics Co. Ltd. - Overview
- Exhibits163: HUMAX Electronics Co. Ltd. - Product / Service
- Exhibits164: HUMAX Electronics Co. Ltd. - Key offerings
- Exhibits165: MyBox Technologies Pvt Ltd. - Overview
- Exhibits166: MyBox Technologies Pvt Ltd. - Product / Service
- Exhibits167: MyBox Technologies Pvt Ltd. - Key offerings
- Exhibits168: Roku Inc. - Overview
- Exhibits169: Roku Inc. - Business segments
- Exhibits170: Roku Inc. - Key offerings
- Exhibits171: Roku Inc. - Segment focus
- Exhibits172: Sagemcom Broadband SAS - Overview
- Exhibits173: Sagemcom Broadband SAS - Product / Service
- Exhibits174: Sagemcom Broadband SAS - Key offerings
- Exhibits175: Samsung Electronics Co. Ltd. - Overview
- Exhibits176: Samsung Electronics Co. Ltd. - Business segments
- Exhibits177: Samsung Electronics Co. Ltd. - Key news
- Exhibits178: Samsung Electronics Co. Ltd. - Key offerings
- Exhibits179: Samsung Electronics Co. Ltd. - Segment focus
- Exhibits180: Shenzhen SDMC Technology Co Ltd - Overview
- Exhibits181: Shenzhen SDMC Technology Co Ltd - Product / Service
- Exhibits182: Shenzhen SDMC Technology Co Ltd - Key offerings
- Exhibits183: Inclusions checklist
- Exhibits184: Exclusions checklist
- Exhibits185: Currency conversion rates for US$
- Exhibits186: Research methodology
- Exhibits187: Information sources
- Exhibits188: Data validation
- Exhibits189: Validation techniques employed for market sizing
- Exhibits190: Data synthesis
- Exhibits191: 360 degree market analysis
- Exhibits192: List of abbreviations
The set-top box market is forecasted to grow by USD 8162 mn during 2023-2028, accelerating at a CAGR of 5.79% during the forecast period. The report on the set-top box market provides a holistic analysis, market size and forecast, trends, growth drivers, and challenges, as well as vendor analysis covering around 25 vendors.
The report offers an up-to-date analysis regarding the current market scenario, the latest trends and drivers, and the overall market environment. The market is driven by integration of voice control into set-top boxes, increasing number of product launches, and increasing number of mergers and acquisitions (M&A).
Technavio's set-top box market is segmented as below:
| Market Scope | |
|---|---|
| Base Year | 2024 |
| End Year | 2028 |
| Series Year | 2024-2028 |
| Growth Momentum | Accelerate |
| YOY 2024 | 5.39% |
| CAGR | 5.79% |
| Incremental Value | $8162mn |
By Type
- Satellite set-top box
- DTT set-top box
- IPTV set-top box
- OTT set-top box
- Cable set-top box
By Streaming Type
- HD set-top box
- SD set-top box
- 4K set-top box
By Geography
- APAC
- Europe
- North America
- South America
- Middle East and Africa
This study identifies the declining prices of dram chips as one of the prime reasons driving the set-top box market growth during the next few years. Also, increasing number of households with access to TV and integration of new technologies into set-top boxes will lead to sizable demand in the market.
The report on the set-top box market covers the following areas:
- Set-top box market sizing
- Set-top box market forecast
- Set-top box market industry analysis
The robust vendor analysis is designed to help clients improve their market position, and in line with this, this report provides a detailed analysis of several leading set-top box market vendors that include ABOX42 GmbH, Advanced Digital Broadcast SA, Broadcom Inc., Catvision Ltd., Comcast Corp., CommScope Holding Co. Inc., DISH Network L.L.C., EchoStar Corp., Huawei Technologies Co. Ltd., HUMAX Electronics Co. Ltd., MyBox Technologies Pvt Ltd., Roku Inc., Sagemcom Broadband SAS, Samsung Electronics Co. Ltd., Shenzhen SDMC Technology Co Ltd, Skyworth Group Ltd., Technicolor SA, TelergyHD, TiVo Corp., and ZTE Corp.. Also, the set-top box market analysis report includes information on upcoming trends and challenges that will influence market growth. This is to help companies strategize and leverage all forthcoming growth opportunities.
The study was conducted using an objective combination of primary and secondary information including inputs from key participants in the industry. The report contains a comprehensive market and vendor landscape in addition to an analysis of the key vendors.
The publisher presents a detailed picture of the market by the way of study, synthesis, and summation of data from multiple sources by an analysis of key parameters such as profit, pricing, competition, and promotions. It presents various market facets by identifying the key industry influencers. The data presented is comprehensive, reliable, and a result of extensive research - both primary and secondary. The market research reports provide a complete competitive landscape and an in-depth vendor selection methodology and analysis using qualitative and quantitative research to forecast the accurate market growth.
Table of Contents
1 Executive Summary
- 1.1 Market overview
- Executive Summary - Chart on Market Overview
- Executive Summary - Data Table on Market Overview
- Executive Summary - Chart on Global Market Characteristics
- Executive Summary - Chart on Market by Geography
- Executive Summary - Chart on Market Segmentation by Type
- Executive Summary - Chart on Market Segmentation by Streaming Type
- Executive Summary - Chart on Incremental Growth
- Executive Summary - Data Table on Incremental Growth
- Executive Summary - Chart on Company Market Positioning
2 Market Landscape
- 2.1 Market ecosystem
- Parent Market
- Data Table on - Parent Market
- 2.2 Market characteristics
- Market characteristics analysis
- 2.3 Value chain analysis
- Value Chain Analysis
3 Market Sizing
- 3.1 Market definition
- Offerings of companies included in the market definition
- 3.2 Market segment analysis
- Market segments
- 3.3 Market size 2023
- 3.4 Market outlook: Forecast for 2023-2028
- Chart on Global - Market size and forecast 2023-2028 ($ million)
- Data Table on Global - Market size and forecast 2023-2028 ($ million)
- Chart on Global Market: Year-over-year growth 2023-2028 (%)
- Data Table on Global Market: Year-over-year growth 2023-2028 (%)
4 Historic Market Size
- 4.1 Global Set-Top Box Market 2018 - 2022
- Historic Market Size - Data Table on Global Set-Top Box Market 2018 - 2022 ($ million)
- 4.2 Type segment analysis 2018 - 2022
- Historic Market Size - Type Segment 2018 - 2022 ($ million)
- 4.3 Streaming Type segment analysis 2018 - 2022
- Historic Market Size - Streaming Type Segment 2018 - 2022 ($ million)
- 4.4 Geography segment analysis 2018 - 2022
- Historic Market Size - Geography Segment 2018 - 2022 ($ million)
- 4.5 Country segment analysis 2018 - 2022
- Historic Market Size - Country Segment 2018 - 2022 ($ million)
5 Five Forces Analysis
- 5.1 Five forces summary
- Five forces analysis - Comparison between 2023 and 2028
- 5.2 Bargaining power of buyers
- Bargaining power of buyers - Impact of key factors 2023 and 2028
- 5.3 Bargaining power of suppliers
- Bargaining power of suppliers - Impact of key factors in 2023 and 2028
- 5.4 Threat of new entrants
- Threat of new entrants - Impact of key factors in 2023 and 2028
- 5.5 Threat of substitutes
- Threat of substitutes - Impact of key factors in 2023 and 2028
- 5.6 Threat of rivalry
- Threat of rivalry - Impact of key factors in 2023 and 2028
- 5.7 Market condition
- Chart on Market condition - Five forces 2023 and 2028
6 Market Segmentation by Type
- 6.1 Market segments
- Chart on Type - Market share 2023-2028 (%)
- Data Table on Type - Market share 2023-2028 (%)
- 6.2 Comparison by Type
- Chart on Comparison by Type
- Data Table on Comparison by Type
- 6.3 Satellite set-top box - Market size and forecast 2023-2028
- Chart on Satellite set-top box - Market size and forecast 2023-2028 ($ million)
- Data Table on Satellite set-top box - Market size and forecast 2023-2028 ($ million)
- Chart on Satellite set-top box - Year-over-year growth 2023-2028 (%)
- Data Table on Satellite set-top box - Year-over-year growth 2023-2028 (%)
- 6.4 DTT set-top box - Market size and forecast 2023-2028
- Chart on DTT set-top box - Market size and forecast 2023-2028 ($ million)
- Data Table on DTT set-top box - Market size and forecast 2023-2028 ($ million)
- Chart on DTT set-top box - Year-over-year growth 2023-2028 (%)
- Data Table on DTT set-top box - Year-over-year growth 2023-2028 (%)
- 6.5 IPTV set-top box - Market size and forecast 2023-2028
- Chart on IPTV set-top box - Market size and forecast 2023-2028 ($ million)
- Data Table on IPTV set-top box - Market size and forecast 2023-2028 ($ million)
- Chart on IPTV set-top box - Year-over-year growth 2023-2028 (%)
- Data Table on IPTV set-top box - Year-over-year growth 2023-2028 (%)
- 6.6 OTT set-top box - Market size and forecast 2023-2028
- Chart on OTT set-top box - Market size and forecast 2023-2028 ($ million)
- Data Table on OTT set-top box - Market size and forecast 2023-2028 ($ million)
- Chart on OTT set-top box - Year-over-year growth 2023-2028 (%)
- Data Table on OTT set-top box - Year-over-year growth 2023-2028 (%)
- 6.7 Cable set-top box - Market size and forecast 2023-2028
- Chart on Cable set-top box - Market size and forecast 2023-2028 ($ million)
- Data Table on Cable set-top box - Market size and forecast 2023-2028 ($ million)
- Chart on Cable set-top box - Year-over-year growth 2023-2028 (%)
- Data Table on Cable set-top box - Year-over-year growth 2023-2028 (%)
- 6.8 Market opportunity by Type
- Market opportunity by Type ($ million)
- Data Table on Market opportunity by Type ($ million)
7 Market Segmentation by Streaming Type
- 7.1 Market segments
- Chart on Streaming Type - Market share 2023-2028 (%)
- Data Table on Streaming Type - Market share 2023-2028 (%)
- 7.2 Comparison by Streaming Type
- Chart on Comparison by Streaming Type
- Data Table on Comparison by Streaming Type
- 7.3 HD set-top box - Market size and forecast 2023-2028
- Chart on HD set-top box - Market size and forecast 2023-2028 ($ million)
- Data Table on HD set-top box - Market size and forecast 2023-2028 ($ million)
- Chart on HD set-top box - Year-over-year growth 2023-2028 (%)
- Data Table on HD set-top box - Year-over-year growth 2023-2028 (%)
- 7.4 SD set-top box - Market size and forecast 2023-2028
- Chart on SD set-top box - Market size and forecast 2023-2028 ($ million)
- Data Table on SD set-top box - Market size and forecast 2023-2028 ($ million)
- Chart on SD set-top box - Year-over-year growth 2023-2028 (%)
- Data Table on SD set-top box - Year-over-year growth 2023-2028 (%)
- 4K set-top box - Market size and forecast 2023-2028
- Chart on 4K set-top box - Market size and forecast 2023-2028 ($ million)
- Data Table on 4K set-top box - Market size and forecast 2023-2028 ($ million)
- Chart on 4K set-top box - Year-over-year growth 2023-2028 (%)
- Data Table on 4K set-top box - Year-over-year growth 2023-2028 (%)
- 7.6 Market opportunity by Streaming Type
- Market opportunity by Streaming Type ($ million)
- Data Table on Market opportunity by Streaming Type ($ million)
8 Customer Landscape
- 8.1 Customer landscape overview
- Analysis of price sensitivity, lifecycle, customer purchase basket, adoption rates, and purchase criteria
9 Geographic Landscape
- 9.1 Geographic segmentation
- Chart on Market share By Geographical Landscape2023-2028 (%)
- Data Table on Market share By Geographical Landscape2023-2028 (%)
- 9.2 Geographic comparison
- Chart on Geographic comparison
- Data Table on Geographic comparison
- 9.3 APAC - Market size and forecast 2023-2028
- Chart on APAC - Market size and forecast 2023-2028 ($ million)
- Data Table on APAC - Market size and forecast 2023-2028 ($ million)
- Chart on APAC - Year-over-year growth 2023-2028 (%)
- Data Table on APAC - Year-over-year growth 2023-2028 (%)
- 9.4 Europe - Market size and forecast 2023-2028
- Chart on Europe - Market size and forecast 2023-2028 ($ million)
- Data Table on Europe - Market size and forecast 2023-2028 ($ million)
- Chart on Europe - Year-over-year growth 2023-2028 (%)
- Data Table on Europe - Year-over-year growth 2023-2028 (%)
- 9.5 North America - Market size and forecast 2023-2028
- Chart on North America - Market size and forecast 2023-2028 ($ million)
- Data Table on North America - Market size and forecast 2023-2028 ($ million)
- Chart on North America - Year-over-year growth 2023-2028 (%)
- Data Table on North America - Year-over-year growth 2023-2028 (%)
- 9.6 South America - Market size and forecast 2023-2028
- Chart on South America - Market size and forecast 2023-2028 ($ million)
- Data Table on South America - Market size and forecast 2023-2028 ($ million)
- Chart on South America - Year-over-year growth 2023-2028 (%)
- Data Table on South America - Year-over-year growth 2023-2028 (%)
- 9.7 Middle East and Africa - Market size and forecast 2023-2028
- Chart on Middle East and Africa - Market size and forecast 2023-2028 ($ million)
- Data Table on Middle East and Africa - Market size and forecast 2023-2028 ($ million)
- Chart on Middle East and Africa - Year-over-year growth 2023-2028 (%)
- Data Table on Middle East and Africa - Year-over-year growth 2023-2028 (%)
- 9.8 US - Market size and forecast 2023-2028
- Chart on US - Market size and forecast 2023-2028 ($ million)
- Data Table on US - Market size and forecast 2023-2028 ($ million)
- Chart on US - Year-over-year growth 2023-2028 (%)
- Data Table on US - Year-over-year growth 2023-2028 (%)
- 9.9 China - Market size and forecast 2023-2028
- Chart on China - Market size and forecast 2023-2028 ($ million)
- Data Table on China - Market size and forecast 2023-2028 ($ million)
- Chart on China - Year-over-year growth 2023-2028 (%)
- Data Table on China - Year-over-year growth 2023-2028 (%)
- 9.10 Japan - Market size and forecast 2023-2028
- Chart on Japan - Market size and forecast 2023-2028 ($ million)
- Data Table on Japan - Market size and forecast 2023-2028 ($ million)
- Chart on Japan - Year-over-year growth 2023-2028 (%)
- Data Table on Japan - Year-over-year growth 2023-2028 (%)
- 9.11 India - Market size and forecast 2023-2028
- Chart on India - Market size and forecast 2023-2028 ($ million)
- Data Table on India - Market size and forecast 2023-2028 ($ million)
- Chart on India - Year-over-year growth 2023-2028 (%)
- Data Table on India - Year-over-year growth 2023-2028 (%)
- 9.12 Germany - Market size and forecast 2023-2028
- Chart on Germany - Market size and forecast 2023-2028 ($ million)
- Data Table on Germany - Market size and forecast 2023-2028 ($ million)
- Chart on Germany - Year-over-year growth 2023-2028 (%)
- Data Table on Germany - Year-over-year growth 2023-2028 (%)
- 9.13 Market opportunity by geography
- Market opportunity By Geographical Landscape($ million)
- Data Tables on Market opportunity By Geographical Landscape($ million)
10 Drivers, Challenges, and Opportunity/Restraints
- 10.1 Market drivers
- 10.2 Market challenges
- 10.3 Impact of drivers and challenges
- Impact of drivers and challenges in 2023 and 2028
- 10.4 Market opportunities/restraints
11 Competitive Landscape
- 11.1 Overview
- 11.2 Competitive Landscape
- Overview on criticality of inputs and factors of differentiation
- 11.3 Landscape disruption
- Overview on factors of disruption
- 11.4 Industry risks
- Impact of key risks on business
12 Competitive Analysis
- 12.1 Companies profiled
- Companies covered
- 12.2 Market positioning of companies
- Matrix on companies position and classification
- 12.3 ABOX42 GmbH
- ABOX42 GmbH - Overview
- ABOX42 GmbH - Product / Service
- ABOX42 GmbH - Key offerings
- 12.4 Advanced Digital Broadcast SA
- Advanced Digital Broadcast SA - Overview
- Advanced Digital Broadcast SA - Product / Service
- Advanced Digital Broadcast SA - Key offerings
- 12.5 Broadcom Inc.
- Broadcom Inc. - Overview
- Broadcom Inc. - Business segments
- Broadcom Inc. - Key news
- Broadcom Inc. - Key offerings
- Broadcom Inc. - Segment focus
- 12.6 Catvision Ltd.
- Catvision Ltd. - Overview
- Catvision Ltd. - Product / Service
- Catvision Ltd. - Key offerings
- 12.7 Comcast Corp.
- Comcast Corp. - Overview
- Comcast Corp. - Business segments
- Comcast Corp. - Key offerings
- Comcast Corp. - Segment focus
- 12.8 CommScope Holding Co. Inc.
- CommScope Holding Co. Inc. - Overview
- CommScope Holding Co. Inc. - Business segments
- CommScope Holding Co. Inc. - Key offerings
- CommScope Holding Co. Inc. - Segment focus
- 12.9 DISH Network L.L.C.
- DISH Network L.L.C. - Overview
- DISH Network L.L.C. - Business segments
- DISH Network L.L.C. - Key offerings
- DISH Network L.L.C. - Segment focus
- 12.10 EchoStar Corp.
- EchoStar Corp. - Overview
- EchoStar Corp. - Business segments
- EchoStar Corp. - Key offerings
- EchoStar Corp. - Segment focus
- 12.11 Huawei Technologies Co. Ltd.
- Huawei Technologies Co. Ltd. - Overview
- Huawei Technologies Co. Ltd. - Product / Service
- Huawei Technologies Co. Ltd. - Key offerings
- 12.12 HUMAX Electronics Co. Ltd.
- HUMAX Electronics Co. Ltd. - Overview
- HUMAX Electronics Co. Ltd. - Product / Service
- HUMAX Electronics Co. Ltd. - Key offerings
- 12.13 MyBox Technologies Pvt Ltd.
- MyBox Technologies Pvt Ltd. - Overview
- MyBox Technologies Pvt Ltd. - Product / Service
- MyBox Technologies Pvt Ltd. - Key offerings
- 12.14 Roku Inc.
- Roku Inc. - Overview
- Roku Inc. - Business segments
- Roku Inc. - Key offerings
- Roku Inc. - Segment focus
- 12.15 Sagemcom Broadband SAS
- Sagemcom Broadband SAS - Overview
- Sagemcom Broadband SAS - Product / Service
- Sagemcom Broadband SAS - Key offerings
- 12.16 Samsung Electronics Co. Ltd.
- Samsung Electronics Co. Ltd. - Overview
- Samsung Electronics Co. Ltd. - Business segments
- Samsung Electronics Co. Ltd. - Key news
- Samsung Electronics Co. Ltd. - Key offerings
- Samsung Electronics Co. Ltd. - Segment focus
- 12.17 Shenzhen SDMC Technology Co Ltd
- Shenzhen SDMC Technology Co Ltd - Overview
- Shenzhen SDMC Technology Co Ltd - Product / Service
- Shenzhen SDMC Technology Co Ltd - Key offerings
13 Appendix
- 13.1 Scope of the report
- 13.2 Inclusions and exclusions checklist
- Inclusions checklist
- Exclusions checklist
- 13.3 Currency conversion rates for US$
- Currency conversion rates for US$
- 13.4 Research methodology
- Research methodology
- 13.5 Data procurement
- Information sources
- 13.6 Data validation
- Data validation
- 13.7 Validation techniques employed for market sizing
- Validation techniques employed for market sizing
- 13.8 Data synthesis
- Data synthesis
- 13.9 market analysis
- market analysis
- 13.10 List of abbreviations
- List of abbreviations

