|
|
市場調査レポート
商品コード
1144484
生姜の世界市場 2022-2026Global Ginger Market 2022-2026 |
||||||
|
|
|||||||
|
● お客様のご希望に応じて、既存データの加工や未掲載情報(例:国別セグメント)の追加などの対応が可能です。 詳細はお問い合わせください。 |
|||||||


| 生姜の世界市場 2022-2026 |
|
出版日: 2022年10月19日
発行: TechNavio
ページ情報: 英文 120 Pages
納期: 即納可能
|
- 全表示
- 概要
- 図表
- 目次
当レポートでは生姜の市場規模は、2022年から2026年の間に34億米ドルの増加が見込まれ、予測期間中にCAGR7.3%で成長すると予測しています。当レポートでは、生姜市場の全体的な分析、市場規模と予測、動向、成長促進要因・課題、さらに約25社のベンダーを網羅したベンダー分析を行っています。
また、現在の世界の市場動向と促進要因、市場全体の環境に関する最新の分析も行っています。
市場は、ジンジャーオイルに関連する健康上の利点の認識、フレーバービールにおけるジンジャーの用途の増加、および天然素材ベースの製品の採用の増加によって牽引されています。
本調査では、今後数年間における生姜市場の成長を促進する主要な理由の1つとして、生姜ビールが提供する健康上の利点を挙げています。また、買収や合弁の増加、天然食品添加物への嗜好の高まりは、市場の大きな需要につながるでしょう。
目次
第1章 エグゼクティブサマリー
- 市場概要
第2章 市場情勢
- 市場エコシステム
第3章 市場規模
- 市場の定義
- 市場セグメント分析
- 市場規模 2021
- 市場の見通し:2021-2026年の予測
第4章 ファイブフォース分析
- ファイブフォースの要約
- 買い手の交渉力
- 供給企業の交渉力
- 新規参入業者の脅威
- 代替品の脅威
- 競争の脅威
- 市況
第5章 製品タイプ別の市場セグメンテーション
- 市場内訳
- 製品タイプ別比較
- 生姜 - 市場規模と予測 2021-2026
- 乾燥ショウガ - 市場規模と予測 2021-2026
- その他 - 市場規模と予測 2021-2026
- 製品タイプ別の市場機会
第6章 アプリケーション別市場セグメンテーション
- 市場内訳
- 用途別比較
- 食品産業 - 市場規模と予測 2021-2026
- 製薬業界 - 市場規模と予測 2021-2026
- 化粧品業界 - 市場規模と予測 2021-2026
- その他 - 市場規模と予測 2021-2026
- アプリケーション別の市場機会
第7章 顧客情勢
- 顧客情勢の概要
第8章 地域別情勢
- 地域別セグメンテーション
- 地域別比較
- APAC - 市場規模と予測 2021-2026
- 中東およびアフリカ - 市場規模と予測 2021-2026
- 欧州 - 市場規模と予測 2021-2026
- 北米 - 市場規模と予測 2021-2026
- 南米 - 市場規模と予測 2021-2026
- インド - 市場規模と予測 2021-2026
- ナイジェリア - 市場規模と予測 2021-2026
- ネパール - 市場規模と予測 2021-2026
- 中国 - 市場規模と予測 2021-2026
- インドネシア - 市場規模と予測 2021-2026
- 地域情勢別の市場機会
第9章 促進要因、課題、および動向
- 市場促進要因
- 市場の課題
- 促進要因と課題の影響
- 市場動向
第10章 ベンダー情勢
- 概要
- ベンダー情勢
- 混乱の状況
- 業界のリスク
第11章 ベンダー分析
- 対象ベンダー
- ベンダーの市場ポジショニング
- Archer Daniels Midland Co.
- Buderim Ginger
- Capital Foods Pvt. Ltd.
- Floracopeia Inc.
- Guangxi Yongjiang Food Industry Co. Ltd.
- Indian Organic Farmers Producer Co. Ltd.
- Monterey Bay Spice Co.
- Sino Nature International Co. Ltd.
- SUN IMPEX INTERNATIONAL FOODS LLC
- The Ginger People
第12章 付録
Exhibits:
- Exhibits1: Executive Summary - Chart on Market Overview
- Exhibits2: Executive Summary - Data Table on Market Overview
- Exhibits3: Executive Summary - Chart on Global Market Characteristics
- Exhibits4: Executive Summary - Chart on Market By Geographical Landscape
- Exhibits5: Executive Summary - Chart on Market Segmentation by Product Type
- Exhibits6: Executive Summary - Chart on Market Segmentation by Application
- Exhibits7: Executive Summary - Chart on Incremental Growth
- Exhibits8: Executive Summary - Data Table on Incremental Growth
- Exhibits9: Executive Summary - Chart on Vendor Market Positioning
- Exhibits10: Parent market
- Exhibits11: Market Characteristics
- Exhibits12: Offerings of vendors included in the market definition
- Exhibits13: Market segments
- Exhibits14: Chart on Global - Market size and forecast 2021-2026 ($ million)
- Exhibits15: Data Table on Global - Market size and forecast 2021-2026 ($ million)
- Exhibits16: Chart on Global Market: Year-over-year growth 2021-2026 (%)
- Exhibits17: Data Table on Global Market: Year-over-year growth 2021-2026 (%)
- Exhibits18: Five forces analysis - Comparison between 2021 and 2026
- Exhibits19: Chart on Bargaining power of buyers - Impact of key factors 2021 and 2026
- Exhibits20: Bargaining power of suppliers - Impact of key factors in 2021 and 2026
- Exhibits21: Threat of new entrants - Impact of key factors in 2021 and 2026
- Exhibits22: Threat of substitutes - Impact of key factors in 2021 and 2026
- Exhibits23: Threat of rivalry - Impact of key factors in 2021 and 2026
- Exhibits24: Chart on Market condition - Five forces 2021 and 2026
- Exhibits25: Chart on Product Type - Market share 2021-2026 (%)
- Exhibits26: Data Table on Product Type - Market share 2021-2026 (%)
- Exhibits27: Chart on Comparison by Product Type
- Exhibits28: Data Table on Comparison by Product Type
- Exhibits29: Chart on Fresh ginger - Market size and forecast 2021-2026 ($ million)
- Exhibits30: Data Table on Fresh ginger - Market size and forecast 2021-2026 ($ million)
- Exhibits31: Chart on Fresh ginger - Year-over-year growth 2021-2026 (%)
- Exhibits32: Data Table on Fresh ginger - Year-over-year growth 2021-2026 (%)
- Exhibits33: Chart on Dried ginger - Market size and forecast 2021-2026 ($ million)
- Exhibits34: Data Table on Dried ginger - Market size and forecast 2021-2026 ($ million)
- Exhibits35: Chart on Dried ginger - Year-over-year growth 2021-2026 (%)
- Exhibits36: Data Table on Dried ginger - Year-over-year growth 2021-2026 (%)
- Exhibits37: Chart on Others - Market size and forecast 2021-2026 ($ million)
- Exhibits38: Data Table on Others - Market size and forecast 2021-2026 ($ million)
- Exhibits39: Chart on Others - Year-over-year growth 2021-2026 (%)
- Exhibits40: Data Table on Others - Year-over-year growth 2021-2026 (%)
- Exhibits41: Market opportunity by Product Type ($ million)
- Exhibits42: Chart on Application - Market share 2021-2026 (%)
- Exhibits43: Data Table on Application - Market share 2021-2026 (%)
- Exhibits44: Chart on Comparison by Application
- Exhibits45: Data Table on Comparison by Application
- Exhibits46: Chart on Food industry - Market size and forecast 2021-2026 ($ million)
- Exhibits47: Data Table on Food industry - Market size and forecast 2021-2026 ($ million)
- Exhibits48: Chart on Food industry - Year-over-year growth 2021-2026 (%)
- Exhibits49: Data Table on Food industry - Year-over-year growth 2021-2026 (%)
- Exhibits50: Chart on Pharmaceutical industry - Market size and forecast 2021-2026 ($ million)
- Exhibits51: Data Table on Pharmaceutical industry - Market size and forecast 2021-2026 ($ million)
- Exhibits52: Chart on Pharmaceutical industry - Year-over-year growth 2021-2026 (%)
- Exhibits53: Data Table on Pharmaceutical industry - Year-over-year growth 2021-2026 (%)
- Exhibits54: Chart on Cosmetic industry - Market size and forecast 2021-2026 ($ million)
- Exhibits55: Data Table on Cosmetic industry - Market size and forecast 2021-2026 ($ million)
- Exhibits56: Chart on Cosmetic industry - Year-over-year growth 2021-2026 (%)
- Exhibits57: Data Table on Cosmetic industry - Year-over-year growth 2021-2026 (%)
- Exhibits58: Chart on Others - Market size and forecast 2021-2026 ($ million)
- Exhibits59: Data Table on Others - Market size and forecast 2021-2026 ($ million)
- Exhibits60: Chart on Others - Year-over-year growth 2021-2026 (%)
- Exhibits61: Data Table on Others - Year-over-year growth 2021-2026 (%)
- Exhibits62: Market opportunity by Application ($ million)
- Exhibits63: Analysis of price sensitivity, lifecycle, customer purchase basket, adoption rates, and purchase criteria
- Exhibits64: Chart on Market share By Geographical Landscape 2021-2026 (%)
- Exhibits65: Data Table on Market share By Geographical Landscape 2021-2026 (%)
- Exhibits66: Chart on Geographic comparison
- Exhibits67: Data Table on Geographic comparison
- Exhibits68: Chart on APAC - Market size and forecast 2021-2026 ($ million)
- Exhibits69: Data Table on APAC - Market size and forecast 2021-2026 ($ million)
- Exhibits70: Chart on APAC - Year-over-year growth 2021-2026 (%)
- Exhibits71: Data Table on APAC - Year-over-year growth 2021-2026 (%)
- Exhibits72: Chart on Middle East and Africa - Market size and forecast 2021-2026 ($ million)
- Exhibits73: Data Table on Middle East and Africa - Market size and forecast 2021-2026 ($ million)
- Exhibits74: Chart on Middle East and Africa - Year-over-year growth 2021-2026 (%)
- Exhibits75: Data Table on Middle East and Africa - Year-over-year growth 2021-2026 (%)
- Exhibits76: Chart on Europe - Market size and forecast 2021-2026 ($ million)
- Exhibits77: Data Table on Europe - Market size and forecast 2021-2026 ($ million)
- Exhibits78: Chart on Europe - Year-over-year growth 2021-2026 (%)
- Exhibits79: Data Table on Europe - Year-over-year growth 2021-2026 (%)
- Exhibits80: Chart on North America - Market size and forecast 2021-2026 ($ million)
- Exhibits81: Data Table on North America - Market size and forecast 2021-2026 ($ million)
- Exhibits82: Chart on North America - Year-over-year growth 2021-2026 (%)
- Exhibits83: Data Table on North America - Year-over-year growth 2021-2026 (%)
- Exhibits84: Chart on South America - Market size and forecast 2021-2026 ($ million)
- Exhibits85: Data Table on South America - Market size and forecast 2021-2026 ($ million)
- Exhibits86: Chart on South America - Year-over-year growth 2021-2026 (%)
- Exhibits87: Data Table on South America - Year-over-year growth 2021-2026 (%)
- Exhibits88: Chart on India - Market size and forecast 2021-2026 ($ million)
- Exhibits89: Data Table on India - Market size and forecast 2021-2026 ($ million)
- Exhibits90: Chart on India - Year-over-year growth 2021-2026 (%)
- Exhibits91: Data Table on India - Year-over-year growth 2021-2026 (%)
- Exhibits92: Chart on Nigeria - Market size and forecast 2021-2026 ($ million)
- Exhibits93: Data Table on Nigeria - Market size and forecast 2021-2026 ($ million)
- Exhibits94: Chart on Nigeria - Year-over-year growth 2021-2026 (%)
- Exhibits95: Data Table on Nigeria - Year-over-year growth 2021-2026 (%)
- Exhibits96: Chart on Nepal - Market size and forecast 2021-2026 ($ million)
- Exhibits97: Data Table on Nepal - Market size and forecast 2021-2026 ($ million)
- Exhibits98: Chart on Nepal - Year-over-year growth 2021-2026 (%)
- Exhibits99: Data Table on Nepal - Year-over-year growth 2021-2026 (%)
- Exhibits100: Chart on China - Market size and forecast 2021-2026 ($ million)
- Exhibits101: Data Table on China - Market size and forecast 2021-2026 ($ million)
- Exhibits102: Chart on China - Year-over-year growth 2021-2026 (%)
- Exhibits103: Data Table on China - Year-over-year growth 2021-2026 (%)
- Exhibits104: Chart on Indonesia - Market size and forecast 2021-2026 ($ million)
- Exhibits105: Data Table on Indonesia - Market size and forecast 2021-2026 ($ million)
- Exhibits106: Chart on Indonesia - Year-over-year growth 2021-2026 (%)
- Exhibits107: Data Table on Indonesia - Year-over-year growth 2021-2026 (%)
- Exhibits108: Market opportunity By Geographical Landscape ($ million)
- Exhibits109: Impact of drivers and challenges in 2021 and 2026
- Exhibits110: Overview on Criticality of inputs and Factors of differentiation
- Exhibits111: Overview on factors of disruption
- Exhibits112: Impact of key risks on business
- Exhibits113: Vendors covered
- Exhibits114: Matrix on vendor position and classification
- Exhibits115: Archer Daniels Midland Co. - Overview
- Exhibits116: Archer Daniels Midland Co. - Business segments
- Exhibits117: Archer Daniels Midland Co. - Key offerings
- Exhibits118: Archer Daniels Midland Co. - Segment focus
- Exhibits119: Buderim Ginger - Overview
- Exhibits120: Buderim Ginger - Product / Service
- Exhibits121: Buderim Ginger - Key offerings
- Exhibits122: Capital Foods Pvt. Ltd. - Overview
- Exhibits123: Capital Foods Pvt. Ltd. - Product / Service
- Exhibits124: Capital Foods Pvt. Ltd. - Key offerings
- Exhibits125: Floracopeia Inc. - Overview
- Exhibits126: Floracopeia Inc. - Product / Service
- Exhibits127: Floracopeia Inc. - Key offerings
- Exhibits128: Guangxi Yongjiang Food Industry Co. Ltd. - Overview
- Exhibits129: Guangxi Yongjiang Food Industry Co. Ltd. - Product / Service
- Exhibits130: Guangxi Yongjiang Food Industry Co. Ltd. - Key offerings
- Exhibits131: Indian Organic Farmers Producer Co. Ltd. - Overview
- Exhibits132: Indian Organic Farmers Producer Co. Ltd. - Product / Service
- Exhibits133: Indian Organic Farmers Producer Co. Ltd. - Key offerings
- Exhibits134: Monterey Bay Spice Co. - Overview
- Exhibits135: Monterey Bay Spice Co. - Product / Service
- Exhibits136: Monterey Bay Spice Co. - Key offerings
- Exhibits137: Sino Nature International Co. Ltd. - Overview
- Exhibits138: Sino Nature International Co. Ltd. - Product / Service
- Exhibits139: Sino Nature International Co. Ltd. - Key offerings
- Exhibits140: SUN IMPEX INTERNATIONAL FOODS LLC - Overview
- Exhibits141: SUN IMPEX INTERNATIONAL FOODS LLC - Product / Service
- Exhibits142: SUN IMPEX INTERNATIONAL FOODS LLC - Key offerings
- Exhibits143: The Ginger People - Overview
- Exhibits144: The Ginger People - Product / Service
- Exhibits145: The Ginger People - Key offerings
- Exhibits146: Inclusions checklist
- Exhibits147: Exclusions checklist
- Exhibits148: Currency conversion rates for US$
- Exhibits149: Research methodology
- Exhibits150: Validation techniques employed for market sizing
- Exhibits151: Information sources
- Exhibits152: List of abbreviations
Technavio has been monitoring the ginger market and it is poised to grow by $3.4 bn during 2022-2026, accelerating at a CAGR of 7.3% during the forecast period. Our report on the ginger market provides a holistic analysis, market size and forecast, trends, growth drivers, and challenges, as well as vendor analysis covering around 25 vendors.
The report offers an up-to-date analysis regarding the current global market scenario, latest trends and drivers, and the overall market environment. The market is driven by perceived health benefits associated with ginger oil, increasing application of ginger in flavored beer, and the growing adoption of natural ingredient-based products.
The ginger market analysis includes the type and application segments and geographic landscape.
Technavio's ginger market is segmented as below:
By Type
- Fresh ginger
- Dried ginger
- Others
By Application
- Food industry
- Oharmaceutical industry
- Cosmetic industry
- Others
By Geographical Landscape
- APAC
- Middle East and Africa
- Europe
- North America
- South America
This study identifies the health benefits offered by ginger beer as one of the prime reasons driving the ginger market growth during the next few years. Also, increasing acquisitions and joint ventures and increasing preference toward natural food additives will lead to sizable demand in the market.
Technavio presents a detailed picture of the market by the way of study, synthesis, and summation of data from multiple sources by an analysis of key parameters. Our report on the ginger market covers the following areas:
- Ginger market sizing
- Ginger market forecast
- Ginger market industry analysis
Technavio's robust vendor analysis is designed to help clients improve their market position, and in line with this, this report provides a detailed analysis of several leading ginger market vendors that include AKO GmbH, Archer Daniels Midland Co., Banyan Botanicalsa, BlissOfEarth, BRL Foods, Buderim Ginger, Capital Foods Pvt. Ltd., Floracopeia Inc., Guangxi Yongjiang Food Industry Co. Ltd., Indian Organic Farmers Producer Co. Ltd., Kingsneat Ltd., McCormick and Co. Inc, Monterey Bay Spice Co., NatureLoc Marketing Pvt. Ltd., Olam Group Ltd., PHU GROTEX ERYK GROTOWSKI, Sino Nature International Co. Ltd., SUN IMPEX INTERNATIONAL FOODS LLC, The Canadian Ginger Co., and The Ginger People. Also, the ginger market analysis report includes information on upcoming trends and challenges that will influence market growth. This is to help companies strategize and leverage all forthcoming growth opportunities.
The study was conducted using an objective combination of primary and secondary information including inputs from key participants in the industry. The report contains a comprehensive market and vendor landscape in addition to an analysis of the key vendors.
Technavio presents a detailed picture of the market by the way of study, synthesis, and summation of data from multiple sources by an analysis of key parameters such as profit, pricing, competition, and promotions. It presents various market facets by identifying the key industry influencers. The data presented is comprehensive, reliable, and a result of extensive research - both primary and secondary. Technavio's market research reports provide a complete competitive landscape and an in-depth vendor selection methodology and analysis using qualitative and quantitative research to forecast accurate market growth.
Table of Contents
1 Executive Summary
- 1.1 Market overview
- Exhibit 01: Executive Summary - Chart on Market Overview
- Exhibit 02: Executive Summary - Data Table on Market Overview
- Exhibit 03: Executive Summary - Chart on Global Market Characteristics
- Exhibit 04: Executive Summary - Chart on Market By Geographical Landscape
- Exhibit 05: Executive Summary - Chart on Market Segmentation by Product Type
- Exhibit 06: Executive Summary - Chart on Market Segmentation by Application
- Exhibit 07: Executive Summary - Chart on Incremental Growth
- Exhibit 08: Executive Summary - Data Table on Incremental Growth
- Exhibit 09: Executive Summary - Chart on Vendor Market Positioning
2 Market Landscape
- 2.1 Market ecosystem
- Exhibit 10: Parent market
- Exhibit 11: Market Characteristics
3 Market Sizing
- 3.1 Market definition
- Exhibit 12: Offerings of vendors included in the market definition
- 3.2 Market segment analysis
- Exhibit 13: Market segments
- 3.3 Market size 2021
- 3.4 Market outlook: Forecast for 2021-2026
- Exhibit 14: Chart on Global - Market size and forecast 2021-2026 ($ million)
- Exhibit 15: Data Table on Global - Market size and forecast 2021-2026 ($ million)
- Exhibit 16: Chart on Global Market: Year-over-year growth 2021-2026 (%)
- Exhibit 17: Data Table on Global Market: Year-over-year growth 2021-2026 (%)
4 Five Forces Analysis
- 4.1 Five forces summary
- Exhibit 18: Five forces analysis - Comparison between 2021 and 2026
- 4.2 Bargaining power of buyers
- Exhibit 19: Chart on Bargaining power of buyers - Impact of key factors 2021 and 2026
- 4.3 Bargaining power of suppliers
- Exhibit 20: Bargaining power of suppliers - Impact of key factors in 2021 and 2026
- 4.4 Threat of new entrants
- Exhibit 21: Threat of new entrants - Impact of key factors in 2021 and 2026
- 4.5 Threat of substitutes
- Exhibit 22: Threat of substitutes - Impact of key factors in 2021 and 2026
- 4.6 Threat of rivalry
- Exhibit 23: Threat of rivalry - Impact of key factors in 2021 and 2026
- 4.7 Market condition
- Exhibit 24: Chart on Market condition - Five forces 2021 and 2026
5 Market Segmentation by Product Type
- 5.1 Market segments
- Exhibit 25: Chart on Product Type - Market share 2021-2026 (%)
- Exhibit 26: Data Table on Product Type - Market share 2021-2026 (%)
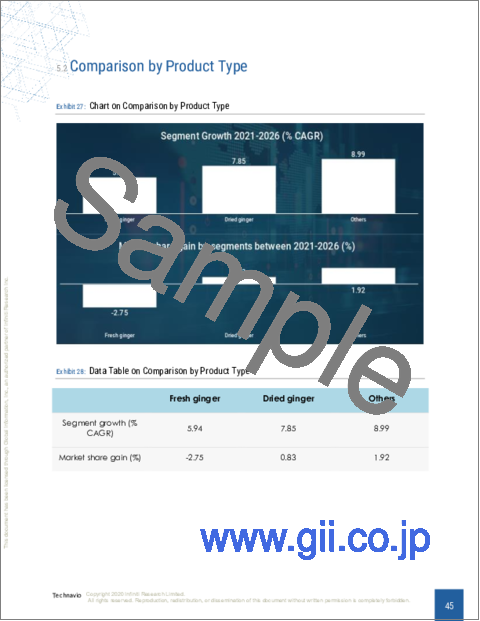
- 5.2 Comparison by Product Type
- Exhibit 27: Chart on Comparison by Product Type
- Exhibit 28: Data Table on Comparison by Product Type
- 5.3 Fresh ginger - Market size and forecast 2021-2026
- Exhibit 29: Chart on Fresh ginger - Market size and forecast 2021-2026 ($ million)
- Exhibit 30: Data Table on Fresh ginger - Market size and forecast 2021-2026 ($ million)
- Exhibit 31: Chart on Fresh ginger - Year-over-year growth 2021-2026 (%)
- Exhibit 32: Data Table on Fresh ginger - Year-over-year growth 2021-2026 (%)
- 5.4 Dried ginger - Market size and forecast 2021-2026
- Exhibit 33: Chart on Dried ginger - Market size and forecast 2021-2026 ($ million)
- Exhibit 34: Data Table on Dried ginger - Market size and forecast 2021-2026 ($ million)
- Exhibit 35: Chart on Dried ginger - Year-over-year growth 2021-2026 (%)
- Exhibit 36: Data Table on Dried ginger - Year-over-year growth 2021-2026 (%)
- 5.5 Others - Market size and forecast 2021-2026
- Exhibit 37: Chart on Others - Market size and forecast 2021-2026 ($ million)
- Exhibit 38: Data Table on Others - Market size and forecast 2021-2026 ($ million)
- Exhibit 39: Chart on Others - Year-over-year growth 2021-2026 (%)
- Exhibit 40: Data Table on Others - Year-over-year growth 2021-2026 (%)
- 5.6 Market opportunity by Product Type
- Exhibit 41: Market opportunity by Product Type ($ million)
6 Market Segmentation by Application
- 6.1 Market segments
- Exhibit 42: Chart on Application - Market share 2021-2026 (%)
- Exhibit 43: Data Table on Application - Market share 2021-2026 (%)
- 6.2 Comparison by Application
- Exhibit 44: Chart on Comparison by Application
- Exhibit 45: Data Table on Comparison by Application
- 6.3 Food industry - Market size and forecast 2021-2026
- Exhibit 46: Chart on Food industry - Market size and forecast 2021-2026 ($ million)
- Exhibit 47: Data Table on Food industry - Market size and forecast 2021-2026 ($ million)
- Exhibit 48: Chart on Food industry - Year-over-year growth 2021-2026 (%)
- Exhibit 49: Data Table on Food industry - Year-over-year growth 2021-2026 (%)
- 6.4 Pharmaceutical industry - Market size and forecast 2021-2026
- Exhibit 50: Chart on Pharmaceutical industry - Market size and forecast 2021-2026 ($ million)
- Exhibit 51: Data Table on Pharmaceutical industry - Market size and forecast 2021-2026 ($ million)
- Exhibit 52: Chart on Pharmaceutical industry - Year-over-year growth 2021-2026 (%)
- Exhibit 53: Data Table on Pharmaceutical industry - Year-over-year growth 2021-2026 (%)
- 6.5 Cosmetic industry - Market size and forecast 2021-2026
- Exhibit 54: Chart on Cosmetic industry - Market size and forecast 2021-2026 ($ million)
- Exhibit 55: Data Table on Cosmetic industry - Market size and forecast 2021-2026 ($ million)
- Exhibit 56: Chart on Cosmetic industry - Year-over-year growth 2021-2026 (%)
- Exhibit 57: Data Table on Cosmetic industry - Year-over-year growth 2021-2026 (%)
- 6.6 Others - Market size and forecast 2021-2026
- Exhibit 58: Chart on Others - Market size and forecast 2021-2026 ($ million)
- Exhibit 59: Data Table on Others - Market size and forecast 2021-2026 ($ million)
- Exhibit 60: Chart on Others - Year-over-year growth 2021-2026 (%)
- Exhibit 61: Data Table on Others - Year-over-year growth 2021-2026 (%)
- 6.7 Market opportunity by Application
- Exhibit 62: Market opportunity by Application ($ million)
7 Customer Landscape
- 7.1 Customer landscape overview
- Exhibit 63: Analysis of price sensitivity, lifecycle, customer purchase basket, adoption rates, and purchase criteria
8 Geographic Landscape
- 8.1 Geographic segmentation
- Exhibit 64: Chart on Market share By Geographical Landscape 2021-2026 (%)
- Exhibit 65: Data Table on Market share By Geographical Landscape 2021-2026 (%)
- 8.2 Geographic comparison
- Exhibit 66: Chart on Geographic comparison
- Exhibit 67: Data Table on Geographic comparison
- 8.3 APAC - Market size and forecast 2021-2026
- Exhibit 68: Chart on APAC - Market size and forecast 2021-2026 ($ million)
- Exhibit 69: Data Table on APAC - Market size and forecast 2021-2026 ($ million)
- Exhibit 70: Chart on APAC - Year-over-year growth 2021-2026 (%)
- Exhibit 71: Data Table on APAC - Year-over-year growth 2021-2026 (%)
- 8.4 Middle East and Africa - Market size and forecast 2021-2026
- Exhibit 72: Chart on Middle East and Africa - Market size and forecast 2021-2026 ($ million)
- Exhibit 73: Data Table on Middle East and Africa - Market size and forecast 2021-2026 ($ million)
- Exhibit 74: Chart on Middle East and Africa - Year-over-year growth 2021-2026 (%)
- Exhibit 75: Data Table on Middle East and Africa - Year-over-year growth 2021-2026 (%)
- 8.5 Europe - Market size and forecast 2021-2026
- Exhibit 76: Chart on Europe - Market size and forecast 2021-2026 ($ million)
- Exhibit 77: Data Table on Europe - Market size and forecast 2021-2026 ($ million)
- Exhibit 78: Chart on Europe - Year-over-year growth 2021-2026 (%)
- Exhibit 79: Data Table on Europe - Year-over-year growth 2021-2026 (%)
- 8.6 North America - Market size and forecast 2021-2026
- Exhibit 80: Chart on North America - Market size and forecast 2021-2026 ($ million)
- Exhibit 81: Data Table on North America - Market size and forecast 2021-2026 ($ million)
- Exhibit 82: Chart on North America - Year-over-year growth 2021-2026 (%)
- Exhibit 83: Data Table on North America - Year-over-year growth 2021-2026 (%)
- 8.7 South America - Market size and forecast 2021-2026
- Exhibit 84: Chart on South America - Market size and forecast 2021-2026 ($ million)
- Exhibit 85: Data Table on South America - Market size and forecast 2021-2026 ($ million)
- Exhibit 86: Chart on South America - Year-over-year growth 2021-2026 (%)
- Exhibit 87: Data Table on South America - Year-over-year growth 2021-2026 (%)
- 8.8 India - Market size and forecast 2021-2026
- Exhibit 88: Chart on India - Market size and forecast 2021-2026 ($ million)
- Exhibit 89: Data Table on India - Market size and forecast 2021-2026 ($ million)
- Exhibit 90: Chart on India - Year-over-year growth 2021-2026 (%)
- Exhibit 91: Data Table on India - Year-over-year growth 2021-2026 (%)
- 8.9 Nigeria - Market size and forecast 2021-2026
- Exhibit 92: Chart on Nigeria - Market size and forecast 2021-2026 ($ million)
- Exhibit 93: Data Table on Nigeria - Market size and forecast 2021-2026 ($ million)
- Exhibit 94: Chart on Nigeria - Year-over-year growth 2021-2026 (%)
- Exhibit 95: Data Table on Nigeria - Year-over-year growth 2021-2026 (%)
- 8.10 Nepal - Market size and forecast 2021-2026
- Exhibit 96: Chart on Nepal - Market size and forecast 2021-2026 ($ million)
- Exhibit 97: Data Table on Nepal - Market size and forecast 2021-2026 ($ million)
- Exhibit 98: Chart on Nepal - Year-over-year growth 2021-2026 (%)
- Exhibit 99: Data Table on Nepal - Year-over-year growth 2021-2026 (%)
- 8.11 China - Market size and forecast 2021-2026
- Exhibit 100: Chart on China - Market size and forecast 2021-2026 ($ million)
- Exhibit 101: Data Table on China - Market size and forecast 2021-2026 ($ million)
- Exhibit 102: Chart on China - Year-over-year growth 2021-2026 (%)
- Exhibit 103: Data Table on China - Year-over-year growth 2021-2026 (%)
- 8.12 Indonesia - Market size and forecast 2021-2026
- Exhibit 104: Chart on Indonesia - Market size and forecast 2021-2026 ($ million)
- Exhibit 105: Data Table on Indonesia - Market size and forecast 2021-2026 ($ million)
- Exhibit 106: Chart on Indonesia - Year-over-year growth 2021-2026 (%)
- Exhibit 107: Data Table on Indonesia - Year-over-year growth 2021-2026 (%)
- 8.13 Market opportunity By Geographical Landscape
- Exhibit 108: Market opportunity By Geographical Landscape ($ million)
9 Drivers, Challenges, and Trends
- 9.1 Market drivers
- 9.2 Market challenges
- 9.3 Impact of drivers and challenges
- Exhibit 109: Impact of drivers and challenges in 2021 and 2026
- 9.4 Market trends
10 Vendor Landscape
- 10.1 Overview
- 10.2 Vendor landscape
- Exhibit 110: Overview on Criticality of inputs and Factors of differentiation
- 10.3 Landscape disruption
- Exhibit 111: Overview on factors of disruption
- 10.4 Industry risks
- Exhibit 112: Impact of key risks on business
11 Vendor Analysis
- 11.1 Vendors covered
- Exhibit 113: Vendors covered
- 11.2 Market positioning of vendors
- Exhibit 114: Matrix on vendor position and classification
- 11.3 Archer Daniels Midland Co.
- Exhibit 115: Archer Daniels Midland Co. - Overview
- Exhibit 116: Archer Daniels Midland Co. - Business segments
- Exhibit 117: Archer Daniels Midland Co. - Key offerings
- Exhibit 118: Archer Daniels Midland Co. - Segment focus
- 11.4 Buderim Ginger
- Exhibit 119: Buderim Ginger - Overview
- Exhibit 120: Buderim Ginger - Product / Service
- Exhibit 121: Buderim Ginger - Key offerings
- 11.5 Capital Foods Pvt. Ltd.
- Exhibit 122: Capital Foods Pvt. Ltd. - Overview
- Exhibit 123: Capital Foods Pvt. Ltd. - Product / Service
- Exhibit 124: Capital Foods Pvt. Ltd. - Key offerings
- 11.6 Floracopeia Inc.
- Exhibit 125: Floracopeia Inc. - Overview
- Exhibit 126: Floracopeia Inc. - Product / Service
- Exhibit 127: Floracopeia Inc. - Key offerings
- 11.7 Guangxi Yongjiang Food Industry Co. Ltd.
- Exhibit 128: Guangxi Yongjiang Food Industry Co. Ltd. - Overview
- Exhibit 129: Guangxi Yongjiang Food Industry Co. Ltd. - Product / Service
- Exhibit 130: Guangxi Yongjiang Food Industry Co. Ltd. - Key offerings
- 11.8 Indian Organic Farmers Producer Co. Ltd.
- Exhibit 131: Indian Organic Farmers Producer Co. Ltd. - Overview
- Exhibit 132: Indian Organic Farmers Producer Co. Ltd. - Product / Service
- Exhibit 133: Indian Organic Farmers Producer Co. Ltd. - Key offerings
- 11.9 Monterey Bay Spice Co.
- Exhibit 134: Monterey Bay Spice Co. - Overview
- Exhibit 135: Monterey Bay Spice Co. - Product / Service
- Exhibit 136: Monterey Bay Spice Co. - Key offerings
- 11.10 Sino Nature International Co. Ltd.
- Exhibit 137: Sino Nature International Co. Ltd. - Overview
- Exhibit 138: Sino Nature International Co. Ltd. - Product / Service
- Exhibit 139: Sino Nature International Co. Ltd. - Key offerings
- 11.11 SUN IMPEX INTERNATIONAL FOODS LLC
- Exhibit 140: SUN IMPEX INTERNATIONAL FOODS LLC - Overview
- Exhibit 141: SUN IMPEX INTERNATIONAL FOODS LLC - Product / Service
- Exhibit 142: SUN IMPEX INTERNATIONAL FOODS LLC - Key offerings
- 11.12 The Ginger People
- Exhibit 143: The Ginger People - Overview
- Exhibit 144: The Ginger People - Product / Service
- Exhibit 145: The Ginger People - Key offerings
12 Appendix
- 12.1 Scope of the report
- 12.2 Inclusions and exclusions checklist
- Exhibit 146: Inclusions checklist
- Exhibit 147: Exclusions checklist
- 12.3 Currency conversion rates for US$
- Exhibit 148: Currency conversion rates for US$
- 12.4 Research methodology
- Exhibit 149: Research methodology
- Exhibit 150: Validation techniques employed for market sizing
- Exhibit 151: Information sources
- 12.5 List of abbreviations
- Exhibit 152: List of abbreviations
- impact: The COVID-19 pandemic had a significant impact on the agricultural products market. The COVID-19 pandemic resulted in restrictions on the movement of workers who work in agricultural fields, changes in consumer demand, temporary closure of food production facilities, restricted trade in agricultural food products, and financial pressure on the overall agricultural products supply chain. Also, with a collapse in demand from restaurants, hotels, catering services, and the closure of open markets, the demand for agricultural products declined in 2020. However, as agricultural products are a basic necessity, the level of demand for agricultural products has been less affected by the COVID-19 pandemic when compared with other goods. The agricultural products market is expected to recover in 2021 and will grow at a moderate pace during the forecast period. The major reasons for the recovery of the agricultural products market are the relaxation of lockdown norms, the gradually reopening of the market in several countries, keeping social distancing norms in place, and the economic stimulus package announced by the governments of various countries.