|
|
市場調査レポート
商品コード
1645575
NANDフラッシュの世界市場、2025-2029年Global NAND Flash Market 2025-2029 |
||||||

|
|||||||
カスタマイズ可能
|
|||||||


| NANDフラッシュの世界市場、2025-2029年 |
|
出版日: 2025年01月16日
発行: TechNavio
ページ情報: 英文 223 Pages
納期: 即納可能
|

全表示
- 概要
- 図表
- 目次
NANDフラッシュ市場は2024-2029年に264億米ドル、予測期間中のCAGRは6.5%で成長すると予測されます。
当レポートでは、NANDフラッシュ市場の全体的な分析、市場規模・予測、動向、成長促進要因、課題、約25のベンダーを網羅したベンダー分析などを掲載しています。
現在の市場シナリオ、最新動向と促進要因、市場環境全体に関する最新分析を提供しています。市場は、製造設備への投資の拡大、エッジストレージによる市場成長、スマートフォンアプリケーションをサポートする高密度ストレージへのニーズの高まりによって牽引されています。
| 市場範囲 | |
|---|---|
| 基準年 | 2025 |
| 終了年 | 2029 |
| 予測期間 | 2025-2029 |
| 成長モメンタム | 加速 |
| 前年比2025年 | 5.2% |
| CAGR | 6.5% |
| 増分額 | 264億米ドル |
本調査では、今後数年間のNANDフラッシュ市場の成長を促進する主な要因の1つとして、戦略的パートナーシップや買収の増加を挙げています。また、環境ラベル付き製品への関心の高まりやフラッシュベースのストレージドライブの人気の高まりも、市場の大きな需要につながると思われます。
目次
第1章 エグゼクティブサマリー
- 市場概要
第2章 Technavio分析
- 価格・ライフサイクル・顧客購入バスケット・採用率・購入基準の分析
- インプットの重要性と差別化の要因
- 混乱の要因
- 促進要因と課題の影響
第3章 市場情勢
- 市場エコシステム
- 市場の特徴
- バリューチェーン分析
第4章 市場規模
- 市場の定義
- 市場セグメント分析
- 市場規模 2024
- 市場の見通し 2024-2029
第5章 市場規模実績
- NANDフラッシュの世界市場 2019-2023
- 用途別セグメント分析 2019-2023
- タイプセグメント分析 2019-2023
- 技術セグメント分析 2019-2023
- 地域別セグメント分析 2019-2023
- 国別セグメント分析 2019-2023
第6章 定性分析
- AIの影響: NANDフラッシュの世界市場
第7章 ファイブフォース分析
- ファイブフォースの要約
- 買い手の交渉力
- 供給企業の交渉力
- 新規参入業者の脅威
- 代替品の脅威
- 競争の脅威
- 市況
第8章 市場セグメンテーション:用途別
- 市場セグメント
- 比較:用途別
- スマートフォン:市場規模と予測 2024-2029
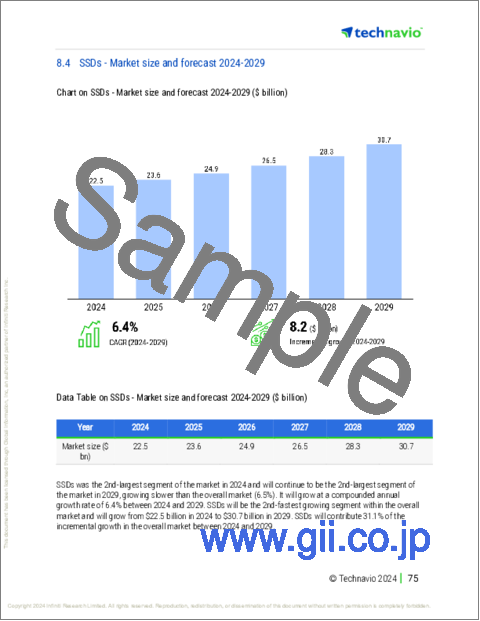
- SSD:市場規模と予測 2024-2029
- メモリーカード:市場規模と予測 2024-2029
- その他:市場規模と予測 2024-2029
- 市場機会:用途別
第9章 市場セグメンテーション:タイプ別
- 市場セグメント
- 比較:タイプ別
- 市場機会:タイプ別
第10章 市場セグメンテーション:技術別
- 市場セグメント
- 比較:技術別
- TLC:市場規模と予測 2024-2029
- MLC:市場規模と予測 2024-2029
- SLC:市場規模と予測 2024-2029
- 市場機会:技術別
第11章 顧客情勢
- 顧客情勢の概要
第12章 地域別情勢
- 地域別セグメンテーション
- 地域別比較
- アジア太平洋:市場規模と予測 2024-2029
- 北米:市場規模と予測 2024-2029
- 欧州:市場規模と予測 2024-2029
- 南米:市場規模と予測 2024-2029
- 中東・アフリカ:市場規模と予測 2024-2029
- 中国:市場規模と予測 2024-2029
- 米国:市場規模と予測 2024-2029
- 日本:市場規模と予測 2024-2029
- 韓国:市場規模と予測 2024-2029
- 台湾:市場規模と予測 2024-2029
- ドイツ:市場規模と予測 2024-2029
- シンガポール:市場規模と予測 2024-2029
- インド:市場規模と予測 2024-2029
- フランス:市場規模と予測 2024-2029
- イタリア:市場規模と予測 2024-2029
- 市場機会:地域情勢別
第13章 促進要因・課題・機会・抑制要因
- 市場促進要因
- 市場の課題
- 促進要因と課題の影響
- 市場の機会・抑制要因
第14章 競合情勢
- 概要
- 競合情勢
- 混乱の状況
- 業界のリスク
第15章 競合分析
- 企業プロファイル
- 企業ランキング指数
- 企業の市場ポジショニング
- ADATA Technology Co. Ltd.
- Flexxon Pte Ltd.
- Greenliant Systems
- Hyperstone GmbH
- Infineon Technologies AG
- Kingston Technology Co. Inc.
- Kioxia Corp.
- Macronix International Co. Ltd.
- Micron Technology Inc.
- Renesas Electronics Corp.
- Samsung Electronics Co. Ltd.
- Silicon Motion Technology Corp.
- SK hynix Co. Ltd.
- Toshiba Corp.
- UDISYS Ltd.
第16章 付録
Exhibits:
- Exhibits1: Executive Summary - Chart on Market Overview
- Exhibits2: Executive Summary - Data Table on Market Overview
- Exhibits3: Executive Summary - Chart on Global Market Characteristics
- Exhibits4: Executive Summary - Chart on Market By Geographical Landscape
- Exhibits5: Executive Summary - Chart on Market Segmentation by Application
- Exhibits6: Executive Summary - Chart on Market Segmentation by Type
- Exhibits7: Executive Summary - Chart on Market Segmentation by Technology
- Exhibits8: Executive Summary - Chart on Incremental Growth
- Exhibits9: Executive Summary - Data Table on Incremental Growth
- Exhibits10: Executive Summary - Chart on Company Market Positioning
- Exhibits11: Analysis of price sensitivity, lifecycle, customer purchase basket, adoption rates, and purchase criteria
- Exhibits12: Overview on criticality of inputs and factors of differentiation
- Exhibits13: Overview on factors of disruption
- Exhibits14: Impact of drivers and challenges in 2024 and 2029
- Exhibits15: Parent Market
- Exhibits16: Data Table on - Parent Market
- Exhibits17: Market characteristics analysis
- Exhibits18: Value chain analysis
- Exhibits19: Offerings of companies included in the market definition
- Exhibits20: Market segments
- Exhibits21: Chart on Global - Market size and forecast 2024-2029 ($ billion)
- Exhibits22: Data Table on Global - Market size and forecast 2024-2029 ($ billion)
- Exhibits23: Chart on Global Market: Year-over-year growth 2024-2029 (%)
- Exhibits24: Data Table on Global Market: Year-over-year growth 2024-2029 (%)
- Exhibits25: Historic Market Size - Data Table on Global NAND Flash Market 2019 - 2023 ($ billion)
- Exhibits26: Historic Market Size - Application Segment 2019 - 2023 ($ billion)
- Exhibits27: Historic Market Size - Type Segment 2019 - 2023 ($ billion)
- Exhibits28: Historic Market Size - Technology Segment 2019 - 2023 ($ billion)
- Exhibits29: Historic Market Size - Geography Segment 2019 - 2023 ($ billion)
- Exhibits30: Historic Market Size - Country Segment 2019 - 2023 ($ billion)
- Exhibits31: Five forces analysis - Comparison between 2024 and 2029
- Exhibits32: Bargaining power of buyers - Impact of key factors 2024 and 2029
- Exhibits33: Bargaining power of suppliers - Impact of key factors in 2024 and 2029
- Exhibits34: Threat of new entrants - Impact of key factors in 2024 and 2029
- Exhibits35: Threat of substitutes - Impact of key factors in 2024 and 2029
- Exhibits36: Threat of rivalry - Impact of key factors in 2024 and 2029
- Exhibits37: Chart on Market condition - Five forces 2024 and 2029
- Exhibits38: Chart on Application - Market share 2024-2029 (%)
- Exhibits39: Data Table on Application - Market share 2024-2029 (%)
- Exhibits40: Chart on Comparison by Application
- Exhibits41: Data Table on Comparison by Application
- Exhibits42: Chart on Smartphones - Market size and forecast 2024-2029 ($ billion)
- Exhibits43: Data Table on Smartphones - Market size and forecast 2024-2029 ($ billion)
- Exhibits44: Chart on Smartphones - Year-over-year growth 2024-2029 (%)
- Exhibits45: Data Table on Smartphones - Year-over-year growth 2024-2029 (%)
- Exhibits46: Chart on SSDs - Market size and forecast 2024-2029 ($ billion)
- Exhibits47: Data Table on SSDs - Market size and forecast 2024-2029 ($ billion)
- Exhibits48: Chart on SSDs - Year-over-year growth 2024-2029 (%)
- Exhibits49: Data Table on SSDs - Year-over-year growth 2024-2029 (%)
- Exhibits50: Chart on Memory cards - Market size and forecast 2024-2029 ($ billion)
- Exhibits51: Data Table on Memory cards - Market size and forecast 2024-2029 ($ billion)
- Exhibits52: Chart on Memory cards - Year-over-year growth 2024-2029 (%)
- Exhibits53: Data Table on Memory cards - Year-over-year growth 2024-2029 (%)
- Exhibits54: Chart on Others - Market size and forecast 2024-2029 ($ billion)
- Exhibits55: Data Table on Others - Market size and forecast 2024-2029 ($ billion)
- Exhibits56: Chart on Others - Year-over-year growth 2024-2029 (%)
- Exhibits57: Data Table on Others - Year-over-year growth 2024-2029 (%)
- Exhibits58: Market opportunity by Application ($ billion)
- Exhibits59: Data Table on Market opportunity by Application ($ billion)
- Exhibits60: Chart on Type - Market share 2024-2029 (%)
- Exhibits61: Data Table on Type - Market share 2024-2029 (%)
- Exhibits62: Chart on Comparison by Type
- Exhibits63: Data Table on Comparison by Type
- Exhibits64: Chart on 3D NAND - Market size and forecast 2024-2029 ($ billion)
- Exhibits65: Data Table on 3D NAND - Market size and forecast 2024-2029 ($ billion)
- Exhibits66: Chart on 3D NAND - Year-over-year growth 2024-2029 (%)
- Exhibits67: Data Table on 3D NAND - Year-over-year growth 2024-2029 (%)
- Exhibits68: Chart on 2D NAND - Market size and forecast 2024-2029 ($ billion)
- Exhibits69: Data Table on 2D NAND - Market size and forecast 2024-2029 ($ billion)
- Exhibits70: Chart on 2D NAND - Year-over-year growth 2024-2029 (%)
- Exhibits71: Data Table on 2D NAND - Year-over-year growth 2024-2029 (%)
- Exhibits72: Market opportunity by Type ($ billion)
- Exhibits73: Data Table on Market opportunity by Type ($ billion)
- Exhibits74: Chart on Technology - Market share 2024-2029 (%)
- Exhibits75: Data Table on Technology - Market share 2024-2029 (%)
- Exhibits76: Chart on Comparison by Technology
- Exhibits77: Data Table on Comparison by Technology
- Exhibits78: Chart on TLC - Market size and forecast 2024-2029 ($ billion)
- Exhibits79: Data Table on TLC - Market size and forecast 2024-2029 ($ billion)
- Exhibits80: Chart on TLC - Year-over-year growth 2024-2029 (%)
- Exhibits81: Data Table on TLC - Year-over-year growth 2024-2029 (%)
- Exhibits82: Chart on MLC - Market size and forecast 2024-2029 ($ billion)
- Exhibits83: Data Table on MLC - Market size and forecast 2024-2029 ($ billion)
- Exhibits84: Chart on MLC - Year-over-year growth 2024-2029 (%)
- Exhibits85: Data Table on MLC - Year-over-year growth 2024-2029 (%)
- Exhibits86: Chart on SLC - Market size and forecast 2024-2029 ($ billion)
- Exhibits87: Data Table on SLC - Market size and forecast 2024-2029 ($ billion)
- Exhibits88: Chart on SLC - Year-over-year growth 2024-2029 (%)
- Exhibits89: Data Table on SLC - Year-over-year growth 2024-2029 (%)
- Exhibits90: Market opportunity by Technology ($ billion)
- Exhibits91: Data Table on Market opportunity by Technology ($ billion)
- Exhibits92: Analysis of price sensitivity, lifecycle, customer purchase basket, adoption rates, and purchase criteria
- Exhibits93: Chart on Market share By Geographical Landscape 2024-2029 (%)
- Exhibits94: Data Table on Market share By Geographical Landscape 2024-2029 (%)
- Exhibits95: Chart on Geographic comparison
- Exhibits96: Data Table on Geographic comparison
- Exhibits97: Chart on APAC - Market size and forecast 2024-2029 ($ billion)
- Exhibits98: Data Table on APAC - Market size and forecast 2024-2029 ($ billion)
- Exhibits99: Chart on APAC - Year-over-year growth 2024-2029 (%)
- Exhibits100: Data Table on APAC - Year-over-year growth 2024-2029 (%)
- Exhibits101: Chart on North America - Market size and forecast 2024-2029 ($ billion)
- Exhibits102: Data Table on North America - Market size and forecast 2024-2029 ($ billion)
- Exhibits103: Chart on North America - Year-over-year growth 2024-2029 (%)
- Exhibits104: Data Table on North America - Year-over-year growth 2024-2029 (%)
- Exhibits105: Chart on Europe - Market size and forecast 2024-2029 ($ billion)
- Exhibits106: Data Table on Europe - Market size and forecast 2024-2029 ($ billion)
- Exhibits107: Chart on Europe - Year-over-year growth 2024-2029 (%)
- Exhibits108: Data Table on Europe - Year-over-year growth 2024-2029 (%)
- Exhibits109: Chart on South America - Market size and forecast 2024-2029 ($ billion)
- Exhibits110: Data Table on South America - Market size and forecast 2024-2029 ($ billion)
- Exhibits111: Chart on South America - Year-over-year growth 2024-2029 (%)
- Exhibits112: Data Table on South America - Year-over-year growth 2024-2029 (%)
- Exhibits113: Chart on Middle East and Africa - Market size and forecast 2024-2029 ($ billion)
- Exhibits114: Data Table on Middle East and Africa - Market size and forecast 2024-2029 ($ billion)
- Exhibits115: Chart on Middle East and Africa - Year-over-year growth 2024-2029 (%)
- Exhibits116: Data Table on Middle East and Africa - Year-over-year growth 2024-2029 (%)
- Exhibits117: Chart on China - Market size and forecast 2024-2029 ($ billion)
- Exhibits118: Data Table on China - Market size and forecast 2024-2029 ($ billion)
- Exhibits119: Chart on China - Year-over-year growth 2024-2029 (%)
- Exhibits120: Data Table on China - Year-over-year growth 2024-2029 (%)
- Exhibits121: Chart on US - Market size and forecast 2024-2029 ($ billion)
- Exhibits122: Data Table on US - Market size and forecast 2024-2029 ($ billion)
- Exhibits123: Chart on US - Year-over-year growth 2024-2029 (%)
- Exhibits124: Data Table on US - Year-over-year growth 2024-2029 (%)
- Exhibits125: Chart on Japan - Market size and forecast 2024-2029 ($ billion)
- Exhibits126: Data Table on Japan - Market size and forecast 2024-2029 ($ billion)
- Exhibits127: Chart on Japan - Year-over-year growth 2024-2029 (%)
- Exhibits128: Data Table on Japan - Year-over-year growth 2024-2029 (%)
- Exhibits129: Chart on South Korea - Market size and forecast 2024-2029 ($ billion)
- Exhibits130: Data Table on South Korea - Market size and forecast 2024-2029 ($ billion)
- Exhibits131: Chart on South Korea - Year-over-year growth 2024-2029 (%)
- Exhibits132: Data Table on South Korea - Year-over-year growth 2024-2029 (%)
- Exhibits133: Chart on Taiwan - Market size and forecast 2024-2029 ($ billion)
- Exhibits134: Data Table on Taiwan - Market size and forecast 2024-2029 ($ billion)
- Exhibits135: Chart on Taiwan - Year-over-year growth 2024-2029 (%)
- Exhibits136: Data Table on Taiwan - Year-over-year growth 2024-2029 (%)
- Exhibits137: Chart on Germany - Market size and forecast 2024-2029 ($ billion)
- Exhibits138: Data Table on Germany - Market size and forecast 2024-2029 ($ billion)
- Exhibits139: Chart on Germany - Year-over-year growth 2024-2029 (%)
- Exhibits140: Data Table on Germany - Year-over-year growth 2024-2029 (%)
- Exhibits141: Chart on Singapore - Market size and forecast 2024-2029 ($ billion)
- Exhibits142: Data Table on Singapore - Market size and forecast 2024-2029 ($ billion)
- Exhibits143: Chart on Singapore - Year-over-year growth 2024-2029 (%)
- Exhibits144: Data Table on Singapore - Year-over-year growth 2024-2029 (%)
- Exhibits145: Chart on India - Market size and forecast 2024-2029 ($ billion)
- Exhibits146: Data Table on India - Market size and forecast 2024-2029 ($ billion)
- Exhibits147: Chart on India - Year-over-year growth 2024-2029 (%)
- Exhibits148: Data Table on India - Year-over-year growth 2024-2029 (%)
- Exhibits149: Chart on France - Market size and forecast 2024-2029 ($ billion)
- Exhibits150: Data Table on France - Market size and forecast 2024-2029 ($ billion)
- Exhibits151: Chart on France - Year-over-year growth 2024-2029 (%)
- Exhibits152: Data Table on France - Year-over-year growth 2024-2029 (%)
- Exhibits153: Chart on Italy - Market size and forecast 2024-2029 ($ billion)
- Exhibits154: Data Table on Italy - Market size and forecast 2024-2029 ($ billion)
- Exhibits155: Chart on Italy - Year-over-year growth 2024-2029 (%)
- Exhibits156: Data Table on Italy - Year-over-year growth 2024-2029 (%)
- Exhibits157: Market opportunity By Geographical Landscape ($ billion)
- Exhibits158: Data Tables on Market opportunity By Geographical Landscape ($ billion)
- Exhibits159: Impact of drivers and challenges in 2024 and 2029
- Exhibits160: Overview on criticality of inputs and factors of differentiation
- Exhibits161: Overview on factors of disruption
- Exhibits162: Impact of key risks on business
- Exhibits163: Companies covered
- Exhibits164: Company ranking index
- Exhibits165: Matrix on companies position and classification
- Exhibits166: ADATA Technology Co. Ltd. - Overview
- Exhibits167: ADATA Technology Co. Ltd. - Product / Service
- Exhibits168: ADATA Technology Co. Ltd. - Key offerings
- Exhibits169: SWOT
- Exhibits170: Flexxon Pte Ltd. - Overview
- Exhibits171: Flexxon Pte Ltd. - Product / Service
- Exhibits172: Flexxon Pte Ltd. - Key offerings
- Exhibits173: SWOT
- Exhibits174: Greenliant Systems - Overview
- Exhibits175: Greenliant Systems - Product / Service
- Exhibits176: Greenliant Systems - Key offerings
- Exhibits177: SWOT
- Exhibits178: Hyperstone GmbH - Overview
- Exhibits179: Hyperstone GmbH - Product / Service
- Exhibits180: Hyperstone GmbH - Key offerings
- Exhibits181: SWOT
- Exhibits182: Infineon Technologies AG - Overview
- Exhibits183: Infineon Technologies AG - Business segments
- Exhibits184: Infineon Technologies AG - Key news
- Exhibits185: Infineon Technologies AG - Key offerings
- Exhibits186: Infineon Technologies AG - Segment focus
- Exhibits187: SWOT
- Exhibits188: Kingston Technology Co. Inc. - Overview
- Exhibits189: Kingston Technology Co. Inc. - Product / Service
- Exhibits190: Kingston Technology Co. Inc. - Key offerings
- Exhibits191: SWOT
- Exhibits192: Kioxia Corp. - Overview
- Exhibits193: Kioxia Corp. - Product / Service
- Exhibits194: Kioxia Corp. - Key offerings
- Exhibits195: SWOT
- Exhibits196: Macronix International Co. Ltd. - Overview
- Exhibits197: Macronix International Co. Ltd. - Product / Service
- Exhibits198: Macronix International Co. Ltd. - Key offerings
- Exhibits199: SWOT
- Exhibits200: Micron Technology Inc. - Overview
- Exhibits201: Micron Technology Inc. - Business segments
- Exhibits202: Micron Technology Inc. - Key news
- Exhibits203: Micron Technology Inc. - Key offerings
- Exhibits204: Micron Technology Inc. - Segment focus
- Exhibits205: SWOT
- Exhibits206: Renesas Electronics Corp. - Overview
- Exhibits207: Renesas Electronics Corp. - Business segments
- Exhibits208: Renesas Electronics Corp. - Key news
- Exhibits209: Renesas Electronics Corp. - Key offerings
- Exhibits210: Renesas Electronics Corp. - Segment focus
- Exhibits211: SWOT
- Exhibits212: Samsung Electronics Co. Ltd. - Overview
- Exhibits213: Samsung Electronics Co. Ltd. - Business segments
- Exhibits214: Samsung Electronics Co. Ltd. - Key news
- Exhibits215: Samsung Electronics Co. Ltd. - Key offerings
- Exhibits216: Samsung Electronics Co. Ltd. - Segment focus
- Exhibits217: SWOT
- Exhibits218: Silicon Motion Technology Corp. - Overview
- Exhibits219: Silicon Motion Technology Corp. - Product / Service
- Exhibits220: Silicon Motion Technology Corp. - Key offerings
- Exhibits221: SWOT
- Exhibits222: SK hynix Co. Ltd. - Overview
- Exhibits223: SK hynix Co. Ltd. - Product / Service
- Exhibits224: SK hynix Co. Ltd. - Key news
- Exhibits225: SK hynix Co. Ltd. - Key offerings
- Exhibits226: SWOT
- Exhibits227: Toshiba Corp. - Overview
- Exhibits228: Toshiba Corp. - Business segments
- Exhibits229: Toshiba Corp. - Key news
- Exhibits230: Toshiba Corp. - Key offerings
- Exhibits231: Toshiba Corp. - Segment focus
- Exhibits232: SWOT
Exhib
The NAND flash market is forecasted to grow by USD 26.4 bn during 2024-2029, accelerating at a CAGR of 6.5% during the forecast period. The report on the NAND flash market provides a holistic analysis, market size and forecast, trends, growth drivers, and challenges, as well as vendor analysis covering around 25 vendors.
The report offers an up-to-date analysis regarding the current market scenario, the latest trends and drivers, and the overall market environment. The market is driven by growing investments in fabrication facilities, market growth through edge storage, and growing need for high-density storage to support smartphone applications.
| Market Scope | |
|---|---|
| Base Year | 2025 |
| End Year | 2029 |
| Series Year | 2025-2029 |
| Growth Momentum | Accelerate |
| YOY 2025 | 5.2% |
| CAGR | 6.5% |
| Incremental Value | $26.4 bn |
Technavio's NAND flash market is segmented as below:
By Application
- Smartphones
- SSDs
- Memory cards
- Others
By Type
- 3D NAND
- 2D NAND
By Technology
- TLC
- MLC
- SLC
By Geographical Landscape
- APAC
- North America
- Europe
- South America
- Middle East and Africa
This study identifies the rise in number of strategic partnerships and acquisitions as one of the prime reasons driving the NAND flash market growth during the next few years. Also, growing interest in eco-labeled products and increasing popularity of flash-based storage drives will lead to sizable demand in the market.
The report on the NAND flash market covers the following areas:
- NAND Flash Market sizing
- NAND Flash Market forecast
- NAND Flash Market industry analysis
The robust vendor analysis is designed to help clients improve their market position, and in line with this, this report provides a detailed analysis of several leading NAND flash market vendors that include ADATA Technology Co. Ltd., Berkshire Hathaway Inc., Flexxon Pte Ltd., Greenliant Systems, Hyperstone GmbH, Infineon Technologies AG, Innodisk Corp., Kingston Technology Co. Inc., Kioxia Corp., Macronix International Co. Ltd., Micron Technology Inc., Renesas Electronics Corp., Samsung Electronics Co. Ltd., Semiconductor Manufacturing International Corp., Shenzhen Longsys Electronics Co. Ltd., Silicon Motion Technology Corp., SK hynix Co. Ltd., Toshiba Corp., Transcend Information Inc., and UDISYS Ltd.. Also, the nand flash market analysis report includes information on upcoming trends and challenges that will influence market growth. This is to help companies strategize and leverage all forthcoming growth opportunities.
The study was conducted using an objective combination of primary and secondary information including inputs from key participants in the industry. The report contains a comprehensive market and vendor landscape in addition to an analysis of the key vendors.
The publisher presents a detailed picture of the market by the way of study, synthesis, and summation of data from multiple sources by an analysis of key parameters such as profit, pricing, competition, and promotions. It presents various market facets by identifying the key industry influencers. The data presented is comprehensive, reliable, and a result of extensive primary and secondary research. The market research reports provide a complete competitive landscape and an in-depth vendor selection methodology and analysis using qualitative and quantitative research to forecast accurate market growth.
Table of Contents
1 Executive Summary
- 1.1 Market overview
- Executive Summary - Chart on Market Overview
- Executive Summary - Data Table on Market Overview
- Executive Summary - Chart on Global Market Characteristics
- Executive Summary - Chart on Market By Geographical Landscape
- Executive Summary - Chart on Market Segmentation by Application
- Executive Summary - Chart on Market Segmentation by Type
- Executive Summary - Chart on Market Segmentation by Technology
- Executive Summary - Chart on Incremental Growth
- Executive Summary - Data Table on Incremental Growth
- Executive Summary - Chart on Company Market Positioning
2 Technavio Analysis
- 2.1 Analysis of price sensitivity, lifecycle, customer purchase basket, adoption rates, and purchase criteria
- Analysis of price sensitivity, lifecycle, customer purchase basket, adoption rates, and purchase criteria
- 2.2 Criticality of inputs and Factors of differentiation
- Overview on criticality of inputs and factors of differentiation
- 2.3 Factors of disruption
- Overview on factors of disruption
- 2.4 Impact of drivers and challenges
- Impact of drivers and challenges in 2024 and 2029
3 Market Landscape
- 3.1 Market ecosystem
- Parent Market
- Data Table on - Parent Market
- 3.2 Market characteristics
- Market characteristics analysis
- 3.3 Value chain analysis
- Value chain analysis
4 Market Sizing
- 4.1 Market definition
- Offerings of companies included in the market definition
- 4.2 Market segment analysis
- Market segments
- 4.3 Market size 2024
- 4.4 Market outlook: Forecast for 2024-2029
- Chart on Global - Market size and forecast 2024-2029 ($ billion)
- Data Table on Global - Market size and forecast 2024-2029 ($ billion)
- Chart on Global Market: Year-over-year growth 2024-2029 (%)
- Data Table on Global Market: Year-over-year growth 2024-2029 (%)
5 Historic Market Size
- 5.1 Global NAND Flash Market 2019 - 2023
- Historic Market Size - Data Table on Global NAND Flash Market 2019 - 2023 ($ billion)
- 5.2 Application segment analysis 2019 - 2023
- Historic Market Size - Application Segment 2019 - 2023 ($ billion)
- 5.3 Type segment analysis 2019 - 2023
- Historic Market Size - Type Segment 2019 - 2023 ($ billion)
- 5.4 Technology segment analysis 2019 - 2023
- Historic Market Size - Technology Segment 2019 - 2023 ($ billion)
- 5.5 Geography segment analysis 2019 - 2023
- Historic Market Size - Geography Segment 2019 - 2023 ($ billion)
- 5.6 Country segment analysis 2019 - 2023
- Historic Market Size - Country Segment 2019 - 2023 ($ billion)
6 Qualitative Analysis
- 6.1 Impact of AI on the Global NAND Flash Market
7 Five Forces Analysis
- 7.1 Five forces summary
- Five forces analysis - Comparison between 2024 and 2029
- 7.2 Bargaining power of buyers
- Bargaining power of buyers - Impact of key factors 2024 and 2029
- 7.3 Bargaining power of suppliers
- Bargaining power of suppliers - Impact of key factors in 2024 and 2029
- 7.4 Threat of new entrants
- Threat of new entrants - Impact of key factors in 2024 and 2029
- 7.5 Threat of substitutes
- Threat of substitutes - Impact of key factors in 2024 and 2029
- 7.6 Threat of rivalry
- Threat of rivalry - Impact of key factors in 2024 and 2029
- 7.7 Market condition
- Chart on Market condition - Five forces 2024 and 2029
8 Market Segmentation by Application
- 8.1 Market segments
- Chart on Application - Market share 2024-2029 (%)
- Data Table on Application - Market share 2024-2029 (%)
- 8.2 Comparison by Application
- Chart on Comparison by Application
- Data Table on Comparison by Application
- 8.3 Smartphones - Market size and forecast 2024-2029
- Chart on Smartphones - Market size and forecast 2024-2029 ($ billion)
- Data Table on Smartphones - Market size and forecast 2024-2029 ($ billion)
- Chart on Smartphones - Year-over-year growth 2024-2029 (%)
- Data Table on Smartphones - Year-over-year growth 2024-2029 (%)
- 8.4 SSDs - Market size and forecast 2024-2029
- Chart on SSDs - Market size and forecast 2024-2029 ($ billion)
- Data Table on SSDs - Market size and forecast 2024-2029 ($ billion)
- Chart on SSDs - Year-over-year growth 2024-2029 (%)
- Data Table on SSDs - Year-over-year growth 2024-2029 (%)
- 8.5 Memory cards - Market size and forecast 2024-2029
- Chart on Memory cards - Market size and forecast 2024-2029 ($ billion)
- Data Table on Memory cards - Market size and forecast 2024-2029 ($ billion)
- Chart on Memory cards - Year-over-year growth 2024-2029 (%)
- Data Table on Memory cards - Year-over-year growth 2024-2029 (%)
- 8.6 Others - Market size and forecast 2024-2029
- Chart on Others - Market size and forecast 2024-2029 ($ billion)
- Data Table on Others - Market size and forecast 2024-2029 ($ billion)
- Chart on Others - Year-over-year growth 2024-2029 (%)
- Data Table on Others - Year-over-year growth 2024-2029 (%)
- 8.7 Market opportunity by Application
- Market opportunity by Application ($ billion)
- Data Table on Market opportunity by Application ($ billion)
9 Market Segmentation by Type
- 9.1 Market segments
- Chart on Type - Market share 2024-2029 (%)
- Data Table on Type - Market share 2024-2029 (%)
- 9.2 Comparison by Type
- Chart on Comparison by Type
- Data Table on Comparison by Type
- 3D NAND - Market size and forecast 2024-2029
- Chart on 3D NAND - Market size and forecast 2024-2029 ($ billion)
- Data Table on 3D NAND - Market size and forecast 2024-2029 ($ billion)
- Chart on 3D NAND - Year-over-year growth 2024-2029 (%)
- Data Table on 3D NAND - Year-over-year growth 2024-2029 (%)
- 2D NAND - Market size and forecast 2024-2029
- Chart on 2D NAND - Market size and forecast 2024-2029 ($ billion)
- Data Table on 2D NAND - Market size and forecast 2024-2029 ($ billion)
- Chart on 2D NAND - Year-over-year growth 2024-2029 (%)
- Data Table on 2D NAND - Year-over-year growth 2024-2029 (%)
- 9.5 Market opportunity by Type
- Market opportunity by Type ($ billion)
- Data Table on Market opportunity by Type ($ billion)
10 Market Segmentation by Technology
- 10.1 Market segments
- Chart on Technology - Market share 2024-2029 (%)
- Data Table on Technology - Market share 2024-2029 (%)
- 10.2 Comparison by Technology
- Chart on Comparison by Technology
- Data Table on Comparison by Technology
- 10.3 TLC - Market size and forecast 2024-2029
- Chart on TLC - Market size and forecast 2024-2029 ($ billion)
- Data Table on TLC - Market size and forecast 2024-2029 ($ billion)
- Chart on TLC - Year-over-year growth 2024-2029 (%)
- Data Table on TLC - Year-over-year growth 2024-2029 (%)
- 10.4 MLC - Market size and forecast 2024-2029
- Chart on MLC - Market size and forecast 2024-2029 ($ billion)
- Data Table on MLC - Market size and forecast 2024-2029 ($ billion)
- Chart on MLC - Year-over-year growth 2024-2029 (%)
- Data Table on MLC - Year-over-year growth 2024-2029 (%)
- 10.5 SLC - Market size and forecast 2024-2029
- Chart on SLC - Market size and forecast 2024-2029 ($ billion)
- Data Table on SLC - Market size and forecast 2024-2029 ($ billion)
- Chart on SLC - Year-over-year growth 2024-2029 (%)
- Data Table on SLC - Year-over-year growth 2024-2029 (%)
- 10.6 Market opportunity by Technology
- Market opportunity by Technology ($ billion)
- Data Table on Market opportunity by Technology ($ billion)
11 Customer Landscape
- 11.1 Customer landscape overview
- Analysis of price sensitivity, lifecycle, customer purchase basket, adoption rates, and purchase criteria
12 Geographic Landscape
- 12.1 Geographic segmentation
- Chart on Market share By Geographical Landscape 2024-2029 (%)
- Data Table on Market share By Geographical Landscape 2024-2029 (%)
- 12.2 Geographic comparison
- Chart on Geographic comparison
- Data Table on Geographic comparison
- 12.3 APAC - Market size and forecast 2024-2029
- Chart on APAC - Market size and forecast 2024-2029 ($ billion)
- Data Table on APAC - Market size and forecast 2024-2029 ($ billion)
- Chart on APAC - Year-over-year growth 2024-2029 (%)
- Data Table on APAC - Year-over-year growth 2024-2029 (%)
- 12.4 North America - Market size and forecast 2024-2029
- Chart on North America - Market size and forecast 2024-2029 ($ billion)
- Data Table on North America - Market size and forecast 2024-2029 ($ billion)
- Chart on North America - Year-over-year growth 2024-2029 (%)
- Data Table on North America - Year-over-year growth 2024-2029 (%)
- 12.5 Europe - Market size and forecast 2024-2029
- Chart on Europe - Market size and forecast 2024-2029 ($ billion)
- Data Table on Europe - Market size and forecast 2024-2029 ($ billion)
- Chart on Europe - Year-over-year growth 2024-2029 (%)
- Data Table on Europe - Year-over-year growth 2024-2029 (%)
- 12.6 South America - Market size and forecast 2024-2029
- Chart on South America - Market size and forecast 2024-2029 ($ billion)
- Data Table on South America - Market size and forecast 2024-2029 ($ billion)
- Chart on South America - Year-over-year growth 2024-2029 (%)
- Data Table on South America - Year-over-year growth 2024-2029 (%)
- 12.7 Middle East and Africa - Market size and forecast 2024-2029
- Chart on Middle East and Africa - Market size and forecast 2024-2029 ($ billion)
- Data Table on Middle East and Africa - Market size and forecast 2024-2029 ($ billion)
- Chart on Middle East and Africa - Year-over-year growth 2024-2029 (%)
- Data Table on Middle East and Africa - Year-over-year growth 2024-2029 (%)
- 12.8 China - Market size and forecast 2024-2029
- Chart on China - Market size and forecast 2024-2029 ($ billion)
- Data Table on China - Market size and forecast 2024-2029 ($ billion)
- Chart on China - Year-over-year growth 2024-2029 (%)
- Data Table on China - Year-over-year growth 2024-2029 (%)
- 12.9 US - Market size and forecast 2024-2029
- Chart on US - Market size and forecast 2024-2029 ($ billion)
- Data Table on US - Market size and forecast 2024-2029 ($ billion)
- Chart on US - Year-over-year growth 2024-2029 (%)
- Data Table on US - Year-over-year growth 2024-2029 (%)
- 12.10 Japan - Market size and forecast 2024-2029
- Chart on Japan - Market size and forecast 2024-2029 ($ billion)
- Data Table on Japan - Market size and forecast 2024-2029 ($ billion)
- Chart on Japan - Year-over-year growth 2024-2029 (%)
- Data Table on Japan - Year-over-year growth 2024-2029 (%)
- 12.11 South Korea - Market size and forecast 2024-2029
- Chart on South Korea - Market size and forecast 2024-2029 ($ billion)
- Data Table on South Korea - Market size and forecast 2024-2029 ($ billion)
- Chart on South Korea - Year-over-year growth 2024-2029 (%)
- Data Table on South Korea - Year-over-year growth 2024-2029 (%)
- 12.12 Taiwan - Market size and forecast 2024-2029
- Chart on Taiwan - Market size and forecast 2024-2029 ($ billion)
- Data Table on Taiwan - Market size and forecast 2024-2029 ($ billion)
- Chart on Taiwan - Year-over-year growth 2024-2029 (%)
- Data Table on Taiwan - Year-over-year growth 2024-2029 (%)
- 12.13 Germany - Market size and forecast 2024-2029
- Chart on Germany - Market size and forecast 2024-2029 ($ billion)
- Data Table on Germany - Market size and forecast 2024-2029 ($ billion)
- Chart on Germany - Year-over-year growth 2024-2029 (%)
- Data Table on Germany - Year-over-year growth 2024-2029 (%)
- 12.14 Singapore - Market size and forecast 2024-2029
- Chart on Singapore - Market size and forecast 2024-2029 ($ billion)
- Data Table on Singapore - Market size and forecast 2024-2029 ($ billion)
- Chart on Singapore - Year-over-year growth 2024-2029 (%)
- Data Table on Singapore - Year-over-year growth 2024-2029 (%)
- 12.15 India - Market size and forecast 2024-2029
- Chart on India - Market size and forecast 2024-2029 ($ billion)
- Data Table on India - Market size and forecast 2024-2029 ($ billion)
- Chart on India - Year-over-year growth 2024-2029 (%)
- Data Table on India - Year-over-year growth 2024-2029 (%)
- 12.16 France - Market size and forecast 2024-2029
- Chart on France - Market size and forecast 2024-2029 ($ billion)
- Data Table on France - Market size and forecast 2024-2029 ($ billion)
- Chart on France - Year-over-year growth 2024-2029 (%)
- Data Table on France - Year-over-year growth 2024-2029 (%)
- 12.17 Italy - Market size and forecast 2024-2029
- Chart on Italy - Market size and forecast 2024-2029 ($ billion)
- Data Table on Italy - Market size and forecast 2024-2029 ($ billion)
- Chart on Italy - Year-over-year growth 2024-2029 (%)
- Data Table on Italy - Year-over-year growth 2024-2029 (%)
- 12.18 Market opportunity By Geographical Landscape
- Market opportunity By Geographical Landscape ($ billion)
- Data Tables on Market opportunity By Geographical Landscape ($ billion)
13 Drivers, Challenges, and Opportunity/Restraints
- 13.1 Market drivers
- 13.2 Market challenges
- 13.3 Impact of drivers and challenges
- Impact of drivers and challenges in 2024 and 2029
- 13.4 Market opportunities/restraints
14 Competitive Landscape
- 14.1 Overview
- 14.2 Competitive Landscape
- Overview on criticality of inputs and factors of differentiation
- 14.3 Landscape disruption
- Overview on factors of disruption
- 14.4 Industry risks
- Impact of key risks on business
15 Competitive Analysis
- 15.1 Companies profiled
- Companies covered
- 15.2 Company ranking index
- Company ranking index
- 15.3 Market positioning of companies
- Matrix on companies position and classification
- 15.4 ADATA Technology Co. Ltd.
- ADATA Technology Co. Ltd. - Overview
- ADATA Technology Co. Ltd. - Product / Service
- ADATA Technology Co. Ltd. - Key offerings
- SWOT
- 15.5 Flexxon Pte Ltd.
- Flexxon Pte Ltd. - Overview
- Flexxon Pte Ltd. - Product / Service
- Flexxon Pte Ltd. - Key offerings
- SWOT
- 15.6 Greenliant Systems
- Greenliant Systems - Overview
- Greenliant Systems - Product / Service
- Greenliant Systems - Key offerings
- SWOT
- 15.7 Hyperstone GmbH
- Hyperstone GmbH - Overview
- Hyperstone GmbH - Product / Service
- Hyperstone GmbH - Key offerings
- SWOT
- 15.8 Infineon Technologies AG
- Infineon Technologies AG - Overview
- Infineon Technologies AG - Business segments
- Infineon Technologies AG - Key news
- Infineon Technologies AG - Key offerings
- Infineon Technologies AG - Segment focus
- SWOT
- 15.9 Kingston Technology Co. Inc.
- Kingston Technology Co. Inc. - Overview
- Kingston Technology Co. Inc. - Product / Service
- Kingston Technology Co. Inc. - Key offerings
- SWOT
- 15.10 Kioxia Corp.
- Kioxia Corp. - Overview
- Kioxia Corp. - Product / Service
- Kioxia Corp. - Key offerings
- SWOT
- 15.11 Macronix International Co. Ltd.
- Macronix International Co. Ltd. - Overview
- Macronix International Co. Ltd. - Product / Service
- Macronix International Co. Ltd. - Key offerings
- SWOT
- 15.12 Micron Technology Inc.
- Micron Technology Inc. - Overview
- Micron Technology Inc. - Business segments
- Micron Technology Inc. - Key news
- Micron Technology Inc. - Key offerings
- Micron Technology Inc. - Segment focus
- SWOT
- 15.13 Renesas Electronics Corp.
- Renesas Electronics Corp. - Overview
- Renesas Electronics Corp. - Business segments
- Renesas Electronics Corp. - Key news
- Renesas Electronics Corp. - Key offerings
- Renesas Electronics Corp. - Segment focus
- SWOT
- 15.14 Samsung Electronics Co. Ltd.
- Samsung Electronics Co. Ltd. - Overview
- Samsung Electronics Co. Ltd. - Business segments
- Samsung Electronics Co. Ltd. - Key news
- Samsung Electronics Co. Ltd. - Key offerings
- Samsung Electronics Co. Ltd. - Segment focus
- SWOT
- 15.15 Silicon Motion Technology Corp.
- Silicon Motion Technology Corp. - Overview
- Silicon Motion Technology Corp. - Product / Service
- Silicon Motion Technology Corp. - Key offerings
- SWOT
- 15.16 SK hynix Co. Ltd.
- SK hynix Co. Ltd. - Overview
- SK hynix Co. Ltd. - Product / Service
- SK hynix Co. Ltd. - Key news
- SK hynix Co. Ltd. - Key offerings
- SWOT
- 15.17 Toshiba Corp.
- Toshiba Corp. - Overview
- Toshiba Corp. - Business segments
- Toshiba Corp. - Key news
- Toshiba Corp. - Key offerings
- Toshiba Corp. - Segment focus
- SWOT
- 15.18 UDISYS Ltd.
- UDISYS Ltd. - Overview
- UDISYS Ltd. - Product / Service
- UDISYS Ltd. - Key offerings
- SWOT
16 Appendix
- 16.1 Scope of the report
- 16.2 Inclusions and exclusions checklist
- Inclusions checklist
- Exclusions checklist
- 16.3 Currency conversion rates for US$
- Currency conversion rates for US$
- 16.4 Research methodology
- Research methodology
- 16.5 Data procurement
- Information sources
- 16.6 Data validation
- Data validation
- 16.7 Validation techniques employed for market sizing
- Validation techniques employed for market sizing
- 16.8 Data synthesis
- Data synthesis
- 16.9 360 degree market analysis
- 360 degree market analysis
- 16.10 List of abbreviations
- List of abbreviations

