|
|
市場調査レポート
商品コード
1727136
運用サポート業務支援ソフトウェアの世界市場 2025-2029Global Operations Support Business Support Software Market 2025-2029 |
||||||

|
|||||||
カスタマイズ可能
|
|||||||


| 運用サポート業務支援ソフトウェアの世界市場 2025-2029 |
|
出版日: 2025年05月09日
発行: TechNavio
ページ情報: 英文 240 Pages
納期: 即納可能
|

全表示
- 概要
- 図表
- 目次
運用サポート業務支援ソフトウェア市場は2024-2029年に839億米ドル、予測期間中のCAGRは15.8%で成長すると予測されます。
当レポートでは、運用サポート業務支援ソフトウェア市場の全体的な分析、市場規模・予測、動向、成長促進要因、課題、約25のベンダーを網羅したベンダー分析などを掲載しています。
現在の市場シナリオ、最新動向と促進要因、市場環境全体に関する最新分析を提供しています。市場は、クラウドベースのBSS(ビジネスサポート)の採用拡大、コンバージェント課金システムの急速な採用、LTE-aへの投資の拡大が牽引しています。
| 市場範囲 | |
|---|---|
| 基準年 | 2025 |
| 終了年 | 2029 |
| 予測期間 | 2025-2029 |
| 成長モメンタム | 加速 |
| 前年比 | 14.1% |
| CAGR | 15.8% |
| 増分額 | 839億米ドル |
本調査は、業界の主要参加者からのインプットを含め、一次情報と二次情報を客観的に組み合わせて実施しました。レポートには、主要企業の分析に加え、包括的な市場規模データ、地域別分析によるセグメント、ベンダー情勢が含まれています。レポートには過去データと予測データがあります。
本調査では、今後数年間の運用サポート業務支援ソフトウェア市場の成長を促進する主な要因の1つとして、商用化前の5g試験が増加していることを挙げています。また、OSS BSS(運用サポート、ビジネスサポート)設計・開発のマネージドサービスプロバイダへのアウトソーシングや、カスタマイズされたOSS BSS(運用サポート、ビジネスサポート)ソフトウェアへの需要の高まりは、市場の大きな需要につながります。
目次
第1章 エグゼクティブサマリー
- 市場概要
第2章 Technavio分析
- 価格・ライフサイクル・顧客購入バスケット・採用率・購入基準の分析
- インプットの重要性と差別化の要因
- 混乱の要因
- 促進要因と課題の影響
第3章 市場情勢
- 市場エコシステム
- 市場の特徴
- バリューチェーン分析
第4章 市場規模
- 市場の定義
- 市場セグメント分析
- 市場規模 2024
- 市場の見通し 2024-2029
第5章 市場規模実績
- 運用サポート業務支援ソフトウェアの世界市場 2019-2023
- 製品セグメント分析 2019-2023
- 展開セグメント分析 2019-2023
- ソリューションセグメント分析 2019-2023
- セクターセグメント分析 2019-2023
- 地域別セグメント分析 2019-2023
- 国別セグメント分析 2019-2023
第6章 定性分析
- AIの影響:運用サポート業務支援ソフトウェアの世界市場
第7章 ファイブフォース分析
- ファイブフォースの要約
- 買い手の交渉力
- 供給企業の交渉力
- 新規参入業者の脅威
- 代替品の脅威
- 競争の脅威
- 市況
第8章 市場セグメンテーション:製品別
- 市場セグメント
- 比較:製品別
- OSS:市場規模と予測 2024-2029
- BSS:市場規模と予測 2024-2029
- 市場機会:製品別
第9章 市場セグメンテーション:展開別
- 市場セグメント
- 比較:展開別
- クラウドベース:市場規模と予測 2024-2029
- オンプレミス:市場規模と予測 2024-2029
- 市場機会:展開別
第10章 市場セグメンテーション:ソリューション別
- 市場セグメント
- 比較:ソリューション別
- 請求と収益管理:市場規模と予測 2024-2029
- 顧客および製品管理:市場規模と予測 2024-2029
- サービス保証:市場規模と予測 2024-2029
- サービスの履行:市場規模と予測 2024-2029
- その他:市場規模と予測 2024-2029
- 市場機会:ソリューション別
第11章 市場セグメンテーション:セクター別
- 市場セグメント
- 比較:セクター別
- 大企業:市場規模と予測 2024-2029
- 中小企業:市場規模と予測 2024-2029
- 市場機会:セクター別
第12章 顧客情勢
- 顧客情勢の概要
第13章 地域別情勢
- 地域別セグメンテーション
- 地域別比較
- 北米:市場規模と予測 2024-2029
- 欧州:市場規模と予測 2024-2029
- アジア太平洋:市場規模と予測 2024-2029
- 南米:市場規模と予測 2024-2029
- 中東・アフリカ:市場規模と予測 2024-2029
- 米国:市場規模と予測 2024-2029
- 中国:市場規模と予測 2024-2029
- ドイツ:市場規模と予測 2024-2029
- 日本:市場規模と予測 2024-2029
- 英国:市場規模と予測 2024-2029
- カナダ:市場規模と予測 2024-2029
- フランス:市場規模と予測 2024-2029
- イタリア:市場規模と予測 2024-2029
- インド:市場規模と予測 2024-2029
- スペイン:市場規模と予測 2024-2029
- 市場機会:地域情勢別
第14章 促進要因・課題・機会・抑制要因
- 市場促進要因
- 市場の課題
- 促進要因と課題の影響
- 市場の機会・抑制要因
第15章 競合情勢
- 概要
- 競合情勢
- 混乱の状況
- 業界のリスク
第16章 競合分析
- 企業プロファイル
- 企業ランキング指数
- 企業の市場ポジショニング
- Accenture PLC
- Amdocs Ltd.
- Aria Systems Inc.
- Cerillion Plc
- CHR Solutions
- Comarch SA
- Hansen Technologies Ltd.
- Hewlett Packard Enterprise Co.
- Hitachi Ltd.
- Huawei Technologies Co. Ltd.
- NEC Corp.
- Nokia Corp.
- Optiva Inc.
- Oracle Corp.
- SAP SE
第17章 付録
Exhibits:
- Exhibits1: Executive Summary - Chart on Market Overview
- Exhibits2: Executive Summary - Data Table on Market Overview
- Exhibits3: Executive Summary - Chart on Global Market Characteristics
- Exhibits4: Executive Summary - Chart on Market By Geographical Landscape
- Exhibits5: Executive Summary - Chart on Market Segmentation by Product
- Exhibits6: Executive Summary - Chart on Market Segmentation by Deployment
- Exhibits7: Executive Summary - Chart on Market Segmentation by Solution
- Exhibits8: Executive Summary - Chart on Market Segmentation by Sector
- Exhibits9: Executive Summary - Chart on Incremental Growth
- Exhibits10: Executive Summary - Data Table on Incremental Growth
- Exhibits11: Executive Summary - Chart on Company Market Positioning
- Exhibits12: Analysis of price sensitivity, lifecycle, customer purchase basket, adoption rates, and purchase criteria
- Exhibits13: Overview on criticality of inputs and factors of differentiation
- Exhibits14: Overview on factors of disruption
- Exhibits15: Impact of drivers and challenges in 2024 and 2029
- Exhibits16: Parent Market
- Exhibits17: Data Table on - Parent Market
- Exhibits18: Market characteristics analysis
- Exhibits19: Value chain analysis
- Exhibits20: Offerings of companies included in the market definition
- Exhibits21: Market segments
- Exhibits22: Chart on Global - Market size and forecast 2024-2029 ($ billion)
- Exhibits23: Data Table on Global - Market size and forecast 2024-2029 ($ billion)
- Exhibits24: Chart on Global Market: Year-over-year growth 2024-2029 (%)
- Exhibits25: Data Table on Global Market: Year-over-year growth 2024-2029 (%)
- Exhibits26: Historic Market Size - Data Table on Global Operations Support Business Support Software Market 2019 - 2023 ($ billion)
- Exhibits27: Historic Market Size - Product Segment 2019 - 2023 ($ billion)
- Exhibits28: Historic Market Size - Deployment Segment 2019 - 2023 ($ billion)
- Exhibits29: Historic Market Size - Solution Segment 2019 - 2023 ($ billion)
- Exhibits30: Historic Market Size - Sector Segment 2019 - 2023 ($ billion)
- Exhibits31: Historic Market Size - Geography Segment 2019 - 2023 ($ billion)
- Exhibits32: Historic Market Size - Country Segment 2019 - 2023 ($ billion)
- Exhibits33: Five forces analysis - Comparison between 2024 and 2029
- Exhibits34: Bargaining power of buyers - Impact of key factors 2024 and 2029
- Exhibits35: Bargaining power of suppliers - Impact of key factors in 2024 and 2029
- Exhibits36: Threat of new entrants - Impact of key factors in 2024 and 2029
- Exhibits37: Threat of substitutes - Impact of key factors in 2024 and 2029
- Exhibits38: Threat of rivalry - Impact of key factors in 2024 and 2029
- Exhibits39: Chart on Market condition - Five forces 2024 and 2029
- Exhibits40: Chart on Product - Market share 2024-2029 (%)
- Exhibits41: Data Table on Product - Market share 2024-2029 (%)
- Exhibits42: Chart on Comparison by Product
- Exhibits43: Data Table on Comparison by Product
- Exhibits44: Chart on OSS - Market size and forecast 2024-2029 ($ billion)
- Exhibits45: Data Table on OSS - Market size and forecast 2024-2029 ($ billion)
- Exhibits46: Chart on OSS - Year-over-year growth 2024-2029 (%)
- Exhibits47: Data Table on OSS - Year-over-year growth 2024-2029 (%)
- Exhibits48: Chart on BSS - Market size and forecast 2024-2029 ($ billion)
- Exhibits49: Data Table on BSS - Market size and forecast 2024-2029 ($ billion)
- Exhibits50: Chart on BSS - Year-over-year growth 2024-2029 (%)
- Exhibits51: Data Table on BSS - Year-over-year growth 2024-2029 (%)
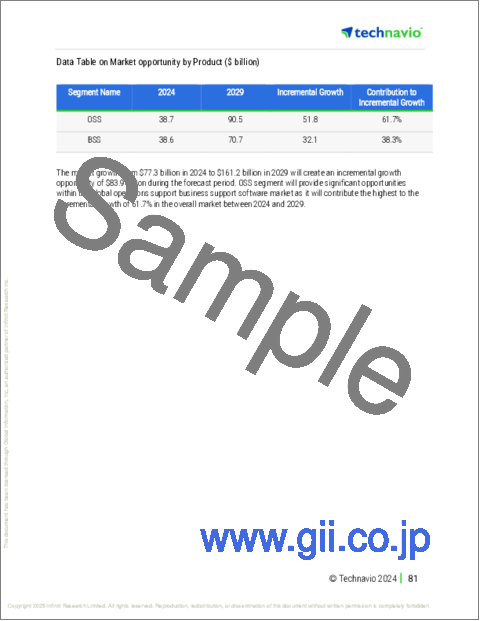
- Exhibits52: Market opportunity by Product ($ billion)
- Exhibits53: Data Table on Market opportunity by Product ($ billion)
- Exhibits54: Chart on Deployment - Market share 2024-2029 (%)
- Exhibits55: Data Table on Deployment - Market share 2024-2029 (%)
- Exhibits56: Chart on Comparison by Deployment
- Exhibits57: Data Table on Comparison by Deployment
- Exhibits58: Chart on Cloud-based - Market size and forecast 2024-2029 ($ billion)
- Exhibits59: Data Table on Cloud-based - Market size and forecast 2024-2029 ($ billion)
- Exhibits60: Chart on Cloud-based - Year-over-year growth 2024-2029 (%)
- Exhibits61: Data Table on Cloud-based - Year-over-year growth 2024-2029 (%)
- Exhibits62: Chart on On-premises - Market size and forecast 2024-2029 ($ billion)
- Exhibits63: Data Table on On-premises - Market size and forecast 2024-2029 ($ billion)
- Exhibits64: Chart on On-premises - Year-over-year growth 2024-2029 (%)
- Exhibits65: Data Table on On-premises - Year-over-year growth 2024-2029 (%)
- Exhibits66: Market opportunity by Deployment ($ billion)
- Exhibits67: Data Table on Market opportunity by Deployment ($ billion)
- Exhibits68: Chart on Solution - Market share 2024-2029 (%)
- Exhibits69: Data Table on Solution - Market share 2024-2029 (%)
- Exhibits70: Chart on Comparison by Solution
- Exhibits71: Data Table on Comparison by Solution
- Exhibits72: Chart on Billing and revenue management - Market size and forecast 2024-2029 ($ billion)
- Exhibits73: Data Table on Billing and revenue management - Market size and forecast 2024-2029 ($ billion)
- Exhibits74: Chart on Billing and revenue management - Year-over-year growth 2024-2029 (%)
- Exhibits75: Data Table on Billing and revenue management - Year-over-year growth 2024-2029 (%)
- Exhibits76: Chart on Customer and product management - Market size and forecast 2024-2029 ($ billion)
- Exhibits77: Data Table on Customer and product management - Market size and forecast 2024-2029 ($ billion)
- Exhibits78: Chart on Customer and product management - Year-over-year growth 2024-2029 (%)
- Exhibits79: Data Table on Customer and product management - Year-over-year growth 2024-2029 (%)
- Exhibits80: Chart on Service assurance - Market size and forecast 2024-2029 ($ billion)
- Exhibits81: Data Table on Service assurance - Market size and forecast 2024-2029 ($ billion)
- Exhibits82: Chart on Service assurance - Year-over-year growth 2024-2029 (%)
- Exhibits83: Data Table on Service assurance - Year-over-year growth 2024-2029 (%)
- Exhibits84: Chart on Service fulfillment - Market size and forecast 2024-2029 ($ billion)
- Exhibits85: Data Table on Service fulfillment - Market size and forecast 2024-2029 ($ billion)
- Exhibits86: Chart on Service fulfillment - Year-over-year growth 2024-2029 (%)
- Exhibits87: Data Table on Service fulfillment - Year-over-year growth 2024-2029 (%)
- Exhibits88: Chart on Others - Market size and forecast 2024-2029 ($ billion)
- Exhibits89: Data Table on Others - Market size and forecast 2024-2029 ($ billion)
- Exhibits90: Chart on Others - Year-over-year growth 2024-2029 (%)
- Exhibits91: Data Table on Others - Year-over-year growth 2024-2029 (%)
- Exhibits92: Market opportunity by Solution ($ billion)
- Exhibits93: Data Table on Market opportunity by Solution ($ billion)
- Exhibits94: Chart on Sector - Market share 2024-2029 (%)
- Exhibits95: Data Table on Sector - Market share 2024-2029 (%)
- Exhibits96: Chart on Comparison by Sector
- Exhibits97: Data Table on Comparison by Sector
- Exhibits98: Chart on Large enterprises - Market size and forecast 2024-2029 ($ billion)
- Exhibits99: Data Table on Large enterprises - Market size and forecast 2024-2029 ($ billion)
- Exhibits100: Chart on Large enterprises - Year-over-year growth 2024-2029 (%)
- Exhibits101: Data Table on Large enterprises - Year-over-year growth 2024-2029 (%)
- Exhibits102: Chart on SMEs - Market size and forecast 2024-2029 ($ billion)
- Exhibits103: Data Table on SMEs - Market size and forecast 2024-2029 ($ billion)
- Exhibits104: Chart on SMEs - Year-over-year growth 2024-2029 (%)
- Exhibits105: Data Table on SMEs - Year-over-year growth 2024-2029 (%)
- Exhibits106: Market opportunity by Sector ($ billion)
- Exhibits107: Data Table on Market opportunity by Sector ($ billion)
- Exhibits108: Analysis of price sensitivity, lifecycle, customer purchase basket, adoption rates, and purchase criteria
- Exhibits109: Chart on Market share By Geographical Landscape 2024-2029 (%)
- Exhibits110: Data Table on Market share By Geographical Landscape 2024-2029 (%)
- Exhibits111: Chart on Geographic comparison
- Exhibits112: Data Table on Geographic comparison
- Exhibits113: Chart on North America - Market size and forecast 2024-2029 ($ billion)
- Exhibits114: Data Table on North America - Market size and forecast 2024-2029 ($ billion)
- Exhibits115: Chart on North America - Year-over-year growth 2024-2029 (%)
- Exhibits116: Data Table on North America - Year-over-year growth 2024-2029 (%)
- Exhibits117: Chart on Europe - Market size and forecast 2024-2029 ($ billion)
- Exhibits118: Data Table on Europe - Market size and forecast 2024-2029 ($ billion)
- Exhibits119: Chart on Europe - Year-over-year growth 2024-2029 (%)
- Exhibits120: Data Table on Europe - Year-over-year growth 2024-2029 (%)
- Exhibits121: Chart on APAC - Market size and forecast 2024-2029 ($ billion)
- Exhibits122: Data Table on APAC - Market size and forecast 2024-2029 ($ billion)
- Exhibits123: Chart on APAC - Year-over-year growth 2024-2029 (%)
- Exhibits124: Data Table on APAC - Year-over-year growth 2024-2029 (%)
- Exhibits125: Chart on South America - Market size and forecast 2024-2029 ($ billion)
- Exhibits126: Data Table on South America - Market size and forecast 2024-2029 ($ billion)
- Exhibits127: Chart on South America - Year-over-year growth 2024-2029 (%)
- Exhibits128: Data Table on South America - Year-over-year growth 2024-2029 (%)
- Exhibits129: Chart on Middle East and Africa - Market size and forecast 2024-2029 ($ billion)
- Exhibits130: Data Table on Middle East and Africa - Market size and forecast 2024-2029 ($ billion)
- Exhibits131: Chart on Middle East and Africa - Year-over-year growth 2024-2029 (%)
- Exhibits132: Data Table on Middle East and Africa - Year-over-year growth 2024-2029 (%)
- Exhibits133: Chart on US - Market size and forecast 2024-2029 ($ billion)
- Exhibits134: Data Table on US - Market size and forecast 2024-2029 ($ billion)
- Exhibits135: Chart on US - Year-over-year growth 2024-2029 (%)
- Exhibits136: Data Table on US - Year-over-year growth 2024-2029 (%)
- Exhibits137: Chart on China - Market size and forecast 2024-2029 ($ billion)
- Exhibits138: Data Table on China - Market size and forecast 2024-2029 ($ billion)
- Exhibits139: Chart on China - Year-over-year growth 2024-2029 (%)
- Exhibits140: Data Table on China - Year-over-year growth 2024-2029 (%)
- Exhibits141: Chart on Germany - Market size and forecast 2024-2029 ($ billion)
- Exhibits142: Data Table on Germany - Market size and forecast 2024-2029 ($ billion)
- Exhibits143: Chart on Germany - Year-over-year growth 2024-2029 (%)
- Exhibits144: Data Table on Germany - Year-over-year growth 2024-2029 (%)
- Exhibits145: Chart on Japan - Market size and forecast 2024-2029 ($ billion)
- Exhibits146: Data Table on Japan - Market size and forecast 2024-2029 ($ billion)
- Exhibits147: Chart on Japan - Year-over-year growth 2024-2029 (%)
- Exhibits148: Data Table on Japan - Year-over-year growth 2024-2029 (%)
- Exhibits149: Chart on UK - Market size and forecast 2024-2029 ($ billion)
- Exhibits150: Data Table on UK - Market size and forecast 2024-2029 ($ billion)
- Exhibits151: Chart on UK - Year-over-year growth 2024-2029 (%)
- Exhibits152: Data Table on UK - Year-over-year growth 2024-2029 (%)
- Exhibits153: Chart on Canada - Market size and forecast 2024-2029 ($ billion)
- Exhibits154: Data Table on Canada - Market size and forecast 2024-2029 ($ billion)
- Exhibits155: Chart on Canada - Year-over-year growth 2024-2029 (%)
- Exhibits156: Data Table on Canada - Year-over-year growth 2024-2029 (%)
- Exhibits157: Chart on France - Market size and forecast 2024-2029 ($ billion)
- Exhibits158: Data Table on France - Market size and forecast 2024-2029 ($ billion)
- Exhibits159: Chart on France - Year-over-year growth 2024-2029 (%)
- Exhibits160: Data Table on France - Year-over-year growth 2024-2029 (%)
- Exhibits161: Chart on Italy - Market size and forecast 2024-2029 ($ billion)
- Exhibits162: Data Table on Italy - Market size and forecast 2024-2029 ($ billion)
- Exhibits163: Chart on Italy - Year-over-year growth 2024-2029 (%)
- Exhibits164: Data Table on Italy - Year-over-year growth 2024-2029 (%)
- Exhibits165: Chart on India - Market size and forecast 2024-2029 ($ billion)
- Exhibits166: Data Table on India - Market size and forecast 2024-2029 ($ billion)
- Exhibits167: Chart on India - Year-over-year growth 2024-2029 (%)
- Exhibits168: Data Table on India - Year-over-year growth 2024-2029 (%)
- Exhibits169: Chart on Spain - Market size and forecast 2024-2029 ($ billion)
- Exhibits170: Data Table on Spain - Market size and forecast 2024-2029 ($ billion)
- Exhibits171: Chart on Spain - Year-over-year growth 2024-2029 (%)
- Exhibits172: Data Table on Spain - Year-over-year growth 2024-2029 (%)
- Exhibits173: Market opportunity By Geographical Landscape ($ billion)
- Exhibits174: Data Tables on Market opportunity By Geographical Landscape ($ billion)
- Exhibits175: Impact of drivers and challenges in 2024 and 2029
- Exhibits176: Overview on criticality of inputs and factors of differentiation
- Exhibits177: Overview on factors of disruption
- Exhibits178: Impact of key risks on business
- Exhibits179: Companies covered
- Exhibits180: Company ranking index
- Exhibits181: Matrix on companies position and classification
- Exhibits182: Accenture PLC - Overview
- Exhibits183: Accenture PLC - Business segments
- Exhibits184: Accenture PLC - Key news
- Exhibits185: Accenture PLC - Key offerings
- Exhibits186: Accenture PLC - Segment focus
- Exhibits187: SWOT
- Exhibits188: Amdocs Ltd. - Overview
- Exhibits189: Amdocs Ltd. - Product / Service
- Exhibits190: Amdocs Ltd. - Key news
- Exhibits191: Amdocs Ltd. - Key offerings
- Exhibits192: SWOT
- Exhibits193: Aria Systems Inc. - Overview
- Exhibits194: Aria Systems Inc. - Product / Service
- Exhibits195: Aria Systems Inc. - Key offerings
- Exhibits196: SWOT
- Exhibits197: Cerillion Plc - Overview
- Exhibits198: Cerillion Plc - Business segments
- Exhibits199: Cerillion Plc - Key offerings
- Exhibits200: Cerillion Plc - Segment focus
- Exhibits201: SWOT
- Exhibits202: CHR Solutions - Overview
- Exhibits203: CHR Solutions - Product / Service
- Exhibits204: CHR Solutions - Key offerings
- Exhibits205: SWOT
- Exhibits206: Comarch SA - Overview
- Exhibits207: Comarch SA - Product / Service
- Exhibits208: Comarch SA - Key news
- Exhibits209: Comarch SA - Key offerings
- Exhibits210: SWOT
- Exhibits211: Hansen Technologies Ltd. - Overview
- Exhibits212: Hansen Technologies Ltd. - Product / Service
- Exhibits213: Hansen Technologies Ltd. - Key news
- Exhibits214: Hansen Technologies Ltd. - Key offerings
- Exhibits215: SWOT
- Exhibits216: Hewlett Packard Enterprise Co. - Overview
- Exhibits217: Hewlett Packard Enterprise Co. - Business segments
- Exhibits218: Hewlett Packard Enterprise Co. - Key news
- Exhibits219: Hewlett Packard Enterprise Co. - Key offerings
- Exhibits220: Hewlett Packard Enterprise Co. - Segment focus
- Exhibits221: SWOT
- Exhibits222: Hitachi Ltd. - Overview
- Exhibits223: Hitachi Ltd. - Business segments
- Exhibits224: Hitachi Ltd. - Key news
- Exhibits225: Hitachi Ltd. - Key offerings
- Exhibits226: Hitachi Ltd. - Segment focus
- Exhibits227: SWOT
- Exhibits228: Huawei Technologies Co. Ltd. - Overview
- Exhibits229: Huawei Technologies Co. Ltd. - Product / Service
- Exhibits230: Huawei Technologies Co. Ltd. - Key news
- Exhibits231: Huawei Technologies Co. Ltd. - Key offerings
- Exhibits232: SWOT
- Exhibits233: NEC Corp. - Overview
- Exhibits234: NEC Corp. - Business segments
- Exhibits235: NEC Corp. - Key news
- Exhibits236: NEC Corp. - Key offerings
- Exhibits237: NEC Corp. - Segment focus
- Exhibits238: SWOT
- Exhibits239: Nokia Corp. - Overview
- Exhibits240: Nokia Corp. - Business segments
- Exhibits241: Nokia Corp. - Key news
- Exhibits242: Nokia Corp. - Key offerings
- Exhibits243: Nokia Corp. - Segment focus
- Exhibits244: SWOT
- Exhibits245: Optiva Inc. - Overview
- Exhibits246: Optiva Inc. - Product / Service
- Exhibits247: Optiva Inc. - Key news
- Exhibits248: Optiva Inc. - Key offerings
- Exhibits249: SWOT
- Exhibits250: Oracle Corp. - Overview
- Exhibits251: Oracle Corp. - Business segments
- Exhibits252: Oracle Corp. - Key news
- Exhibits253: Oracle Corp. - Key offerings
- Exhibits254: Oracle Corp. - Segment focus
- Exhibits255: SWOT
- Exhibits256: SAP SE - Overview
- Exhibits257: SAP SE - Business segments
- Exhibits258: SAP SE - Key news
- Exhibits259: SAP SE - Key offerings
- Exhibits260: SAP SE - Segment focus
- Exhibits261: SWOT
- Exhibits262: Inclusions checklist
- Exhibits263: Exclusions checklist
- Exhibits264: Currency conversion rates for US$
- Exhibits265: Research methodology
- Exhibits266: Information sources
- Exhibits267: Data validation
- Exhibits268: Validation techniques employed for market sizing
- Exhibits269: Data synthesis
- Exhibits270: 360 degree market analysis
- Exhibits271: List of abbreviations
The operations support business support software market is forecasted to grow by USD 83.9 bn during 2024-2029, accelerating at a CAGR of 15.8% during the forecast period. The report on the operations support business support software market provides a holistic analysis, market size and forecast, trends, growth drivers, and challenges, as well as vendor analysis covering around 25 vendors.
The report offers an up-to-date analysis regarding the current market scenario, the latest trends and drivers, and the overall market environment. The market is driven by growing adoption of cloud-based bss (business support), rapid adoption of convergent billing systems, and growing investments in lte-a.
| Market Scope | |
|---|---|
| Base Year | 2025 |
| End Year | 2029 |
| Series Year | 2025-2029 |
| Growth Momentum | Accelerate |
| YOY 2025 | 14.1% |
| CAGR | 15.8% |
| Incremental Value | $83.9 bn |
The study was conducted using an objective combination of primary and secondary information including inputs from key participants in the industry. The report contains a comprehensive market size data, segment with regional analysis and vendor landscape in addition to an analysis of the key companies. Reports have historic and forecast data.
Technavio's operations support business support software market is segmented as below:
By Product
- OSS
- BSS
By Deployment
- Cloud-based
- On-premises
By Solution
- Billing and revenue management
- Customer and product management
- Service assurance
- Service fulfillment
- Others
By Sector
- Large enterprises
- SMEs
By Geographical Landscape
- North America
- Europe
- APAC
- South America
- Middle East and Africa
This study identifies the growing number of pre-commercial 5g trials as one of the prime reasons driving the operations support business support software market growth during the next few years. Also, outsourcing of oss bss (operations support, business support) design and development to managed service providers and increasing demand for customized oss bss (operations support, business support ) software will lead to sizable demand in the market.
The report on the operations support business support software market covers the following areas:
- Operations Support Business Support Software Market sizing
- Operations Support Business Support Software Market forecast
- Operations Support Business Support Software Market industry analysis
The robust vendor analysis is designed to help clients improve their market position, and in line with this, this report provides a detailed analysis of several leading operations support business support software market vendors that include Accenture PLC, Amdocs Ltd., Aria Systems Inc., Cerillion Plc, CHR Solutions, Comarch SA, Hansen Technologies Ltd., Hewlett Packard Enterprise Co., Hitachi Ltd., Huawei Technologies Co. Ltd., NEC Corp., Nokia Corp., Optiva Inc., Oracle Corp., SAP SE, Saskatchewan Telecommunications Holding Corp., SUBEX Ltd., TelcoDR Inc., Telefonaktiebolaget LM Ericsson, and Tridens doo. Also, the operations support business support software market analysis report includes information on upcoming trends and challenges that will influence market growth. This is to help companies strategize and leverage all forthcoming growth opportunities.
The publisher presents a detailed picture of the market by the way of study, synthesis, and summation of data from multiple sources by an analysis of key parameters such as profit, pricing, competition, and promotions. It presents various market facets by identifying the key industry influencers. The data presented is comprehensive, reliable, and a result of extensive primary and secondary research. The market research reports provide a complete competitive landscape and an in-depth vendor selection methodology and analysis using qualitative and quantitative research to forecast accurate market growth.
Table of Contents
1 Executive Summary
- 1.1 Market overview
- Executive Summary - Chart on Market Overview
- Executive Summary - Data Table on Market Overview
- Executive Summary - Chart on Global Market Characteristics
- Executive Summary - Chart on Market By Geographical Landscape
- Executive Summary - Chart on Market Segmentation by Product
- Executive Summary - Chart on Market Segmentation by Deployment
- Executive Summary - Chart on Market Segmentation by Solution
- Executive Summary - Chart on Market Segmentation by Sector
- Executive Summary - Chart on Incremental Growth
- Executive Summary - Data Table on Incremental Growth
- Executive Summary - Chart on Company Market Positioning
2 Technavio Analysis
- 2.1 Analysis of price sensitivity, lifecycle, customer purchase basket, adoption rates, and purchase criteria
- Analysis of price sensitivity, lifecycle, customer purchase basket, adoption rates, and purchase criteria
- 2.2 Criticality of inputs and Factors of differentiation
- Overview on criticality of inputs and factors of differentiation
- 2.3 Factors of disruption
- Overview on factors of disruption
- 2.4 Impact of drivers and challenges
- Impact of drivers and challenges in 2024 and 2029
3 Market Landscape
- 3.1 Market ecosystem
- Parent Market
- Data Table on - Parent Market
- 3.2 Market characteristics
- Market characteristics analysis
- 3.3 Value chain analysis
- Value chain analysis
4 Market Sizing
- 4.1 Market definition
- Offerings of companies included in the market definition
- 4.2 Market segment analysis
- Market segments
- 4.3 Market size 2024
- 4.4 Market outlook: Forecast for 2024-2029
- Chart on Global - Market size and forecast 2024-2029 ($ billion)
- Data Table on Global - Market size and forecast 2024-2029 ($ billion)
- Chart on Global Market: Year-over-year growth 2024-2029 (%)
- Data Table on Global Market: Year-over-year growth 2024-2029 (%)
5 Historic Market Size
- 5.1 Global Operations Support Business Support Software Market 2019 - 2023
- Historic Market Size - Data Table on Global Operations Support Business Support Software Market 2019 - 2023 ($ billion)
- 5.2 Product segment analysis 2019 - 2023
- Historic Market Size - Product Segment 2019 - 2023 ($ billion)
- 5.3 Deployment segment analysis 2019 - 2023
- Historic Market Size - Deployment Segment 2019 - 2023 ($ billion)
- 5.4 Solution segment analysis 2019 - 2023
- Historic Market Size - Solution Segment 2019 - 2023 ($ billion)
- 5.5 Sector segment analysis 2019 - 2023
- Historic Market Size - Sector Segment 2019 - 2023 ($ billion)
- 5.6 Geography segment analysis 2019 - 2023
- Historic Market Size - Geography Segment 2019 - 2023 ($ billion)
- 5.7 Country segment analysis 2019 - 2023
- Historic Market Size - Country Segment 2019 - 2023 ($ billion)
6 Qualitative Analysis
- 6.1 The AI impact on Global Operations Support Business Support Software Market
7 Five Forces Analysis
- 7.1 Five forces summary
- Five forces analysis - Comparison between 2024 and 2029
- 7.2 Bargaining power of buyers
- Bargaining power of buyers - Impact of key factors 2024 and 2029
- 7.3 Bargaining power of suppliers
- Bargaining power of suppliers - Impact of key factors in 2024 and 2029
- 7.4 Threat of new entrants
- Threat of new entrants - Impact of key factors in 2024 and 2029
- 7.5 Threat of substitutes
- Threat of substitutes - Impact of key factors in 2024 and 2029
- 7.6 Threat of rivalry
- Threat of rivalry - Impact of key factors in 2024 and 2029
- 7.7 Market condition
- Chart on Market condition - Five forces 2024 and 2029
8 Market Segmentation by Product
- 8.1 Market segments
- Chart on Product - Market share 2024-2029 (%)
- Data Table on Product - Market share 2024-2029 (%)
- 8.2 Comparison by Product
- Chart on Comparison by Product
- Data Table on Comparison by Product
- 8.3 OSS - Market size and forecast 2024-2029
- Chart on OSS - Market size and forecast 2024-2029 ($ billion)
- Data Table on OSS - Market size and forecast 2024-2029 ($ billion)
- Chart on OSS - Year-over-year growth 2024-2029 (%)
- Data Table on OSS - Year-over-year growth 2024-2029 (%)
- 8.4 BSS - Market size and forecast 2024-2029
- Chart on BSS - Market size and forecast 2024-2029 ($ billion)
- Data Table on BSS - Market size and forecast 2024-2029 ($ billion)
- Chart on BSS - Year-over-year growth 2024-2029 (%)
- Data Table on BSS - Year-over-year growth 2024-2029 (%)
- 8.5 Market opportunity by Product
- Market opportunity by Product ($ billion)
- Data Table on Market opportunity by Product ($ billion)
9 Market Segmentation by Deployment
- 9.1 Market segments
- Chart on Deployment - Market share 2024-2029 (%)
- Data Table on Deployment - Market share 2024-2029 (%)
- 9.2 Comparison by Deployment
- Chart on Comparison by Deployment
- Data Table on Comparison by Deployment
- 9.3 Cloud-based - Market size and forecast 2024-2029
- Chart on Cloud-based - Market size and forecast 2024-2029 ($ billion)
- Data Table on Cloud-based - Market size and forecast 2024-2029 ($ billion)
- Chart on Cloud-based - Year-over-year growth 2024-2029 (%)
- Data Table on Cloud-based - Year-over-year growth 2024-2029 (%)
- 9.4 On-premises - Market size and forecast 2024-2029
- Chart on On-premises - Market size and forecast 2024-2029 ($ billion)
- Data Table on On-premises - Market size and forecast 2024-2029 ($ billion)
- Chart on On-premises - Year-over-year growth 2024-2029 (%)
- Data Table on On-premises - Year-over-year growth 2024-2029 (%)
- 9.5 Market opportunity by Deployment
- Market opportunity by Deployment ($ billion)
- Data Table on Market opportunity by Deployment ($ billion)
10 Market Segmentation by Solution
- 10.1 Market segments
- Chart on Solution - Market share 2024-2029 (%)
- Data Table on Solution - Market share 2024-2029 (%)
- 10.2 Comparison by Solution
- Chart on Comparison by Solution
- Data Table on Comparison by Solution
- 10.3 Billing and revenue management - Market size and forecast 2024-2029
- Chart on Billing and revenue management - Market size and forecast 2024-2029 ($ billion)
- Data Table on Billing and revenue management - Market size and forecast 2024-2029 ($ billion)
- Chart on Billing and revenue management - Year-over-year growth 2024-2029 (%)
- Data Table on Billing and revenue management - Year-over-year growth 2024-2029 (%)
- 10.4 Customer and product management - Market size and forecast 2024-2029
- Chart on Customer and product management - Market size and forecast 2024-2029 ($ billion)
- Data Table on Customer and product management - Market size and forecast 2024-2029 ($ billion)
- Chart on Customer and product management - Year-over-year growth 2024-2029 (%)
- Data Table on Customer and product management - Year-over-year growth 2024-2029 (%)
- 10.5 Service assurance - Market size and forecast 2024-2029
- Chart on Service assurance - Market size and forecast 2024-2029 ($ billion)
- Data Table on Service assurance - Market size and forecast 2024-2029 ($ billion)
- Chart on Service assurance - Year-over-year growth 2024-2029 (%)
- Data Table on Service assurance - Year-over-year growth 2024-2029 (%)
- 10.6 Service fulfillment - Market size and forecast 2024-2029
- Chart on Service fulfillment - Market size and forecast 2024-2029 ($ billion)
- Data Table on Service fulfillment - Market size and forecast 2024-2029 ($ billion)
- Chart on Service fulfillment - Year-over-year growth 2024-2029 (%)
- Data Table on Service fulfillment - Year-over-year growth 2024-2029 (%)
- 10.7 Others - Market size and forecast 2024-2029
- Chart on Others - Market size and forecast 2024-2029 ($ billion)
- Data Table on Others - Market size and forecast 2024-2029 ($ billion)
- Chart on Others - Year-over-year growth 2024-2029 (%)
- Data Table on Others - Year-over-year growth 2024-2029 (%)
- 10.8 Market opportunity by Solution
- Market opportunity by Solution ($ billion)
- Data Table on Market opportunity by Solution ($ billion)
11 Market Segmentation by Sector
- 11.1 Market segments
- Chart on Sector - Market share 2024-2029 (%)
- Data Table on Sector - Market share 2024-2029 (%)
- 11.2 Comparison by Sector
- Chart on Comparison by Sector
- Data Table on Comparison by Sector
- 11.3 Large enterprises - Market size and forecast 2024-2029
- Chart on Large enterprises - Market size and forecast 2024-2029 ($ billion)
- Data Table on Large enterprises - Market size and forecast 2024-2029 ($ billion)
- Chart on Large enterprises - Year-over-year growth 2024-2029 (%)
- Data Table on Large enterprises - Year-over-year growth 2024-2029 (%)
- 11.4 SMEs - Market size and forecast 2024-2029
- Chart on SMEs - Market size and forecast 2024-2029 ($ billion)
- Data Table on SMEs - Market size and forecast 2024-2029 ($ billion)
- Chart on SMEs - Year-over-year growth 2024-2029 (%)
- Data Table on SMEs - Year-over-year growth 2024-2029 (%)
- 11.5 Market opportunity by Sector
- Market opportunity by Sector ($ billion)
- Data Table on Market opportunity by Sector ($ billion)
12 Customer Landscape
- 12.1 Customer landscape overview
- Analysis of price sensitivity, lifecycle, customer purchase basket, adoption rates, and purchase criteria
13 Geographic Landscape
- 13.1 Geographic segmentation
- Chart on Market share By Geographical Landscape 2024-2029 (%)
- Data Table on Market share By Geographical Landscape 2024-2029 (%)
- 13.2 Geographic comparison
- Chart on Geographic comparison
- Data Table on Geographic comparison
- 13.3 North America - Market size and forecast 2024-2029
- Chart on North America - Market size and forecast 2024-2029 ($ billion)
- Data Table on North America - Market size and forecast 2024-2029 ($ billion)
- Chart on North America - Year-over-year growth 2024-2029 (%)
- Data Table on North America - Year-over-year growth 2024-2029 (%)
- 13.4 Europe - Market size and forecast 2024-2029
- Chart on Europe - Market size and forecast 2024-2029 ($ billion)
- Data Table on Europe - Market size and forecast 2024-2029 ($ billion)
- Chart on Europe - Year-over-year growth 2024-2029 (%)
- Data Table on Europe - Year-over-year growth 2024-2029 (%)
- 13.5 APAC - Market size and forecast 2024-2029
- Chart on APAC - Market size and forecast 2024-2029 ($ billion)
- Data Table on APAC - Market size and forecast 2024-2029 ($ billion)
- Chart on APAC - Year-over-year growth 2024-2029 (%)
- Data Table on APAC - Year-over-year growth 2024-2029 (%)
- 13.6 South America - Market size and forecast 2024-2029
- Chart on South America - Market size and forecast 2024-2029 ($ billion)
- Data Table on South America - Market size and forecast 2024-2029 ($ billion)
- Chart on South America - Year-over-year growth 2024-2029 (%)
- Data Table on South America - Year-over-year growth 2024-2029 (%)
- 13.7 Middle East and Africa - Market size and forecast 2024-2029
- Chart on Middle East and Africa - Market size and forecast 2024-2029 ($ billion)
- Data Table on Middle East and Africa - Market size and forecast 2024-2029 ($ billion)
- Chart on Middle East and Africa - Year-over-year growth 2024-2029 (%)
- Data Table on Middle East and Africa - Year-over-year growth 2024-2029 (%)
- 13.8 US - Market size and forecast 2024-2029
- Chart on US - Market size and forecast 2024-2029 ($ billion)
- Data Table on US - Market size and forecast 2024-2029 ($ billion)
- Chart on US - Year-over-year growth 2024-2029 (%)
- Data Table on US - Year-over-year growth 2024-2029 (%)
- 13.9 China - Market size and forecast 2024-2029
- Chart on China - Market size and forecast 2024-2029 ($ billion)
- Data Table on China - Market size and forecast 2024-2029 ($ billion)
- Chart on China - Year-over-year growth 2024-2029 (%)
- Data Table on China - Year-over-year growth 2024-2029 (%)
- 13.10 Germany - Market size and forecast 2024-2029
- Chart on Germany - Market size and forecast 2024-2029 ($ billion)
- Data Table on Germany - Market size and forecast 2024-2029 ($ billion)
- Chart on Germany - Year-over-year growth 2024-2029 (%)
- Data Table on Germany - Year-over-year growth 2024-2029 (%)
- 13.11 Japan - Market size and forecast 2024-2029
- Chart on Japan - Market size and forecast 2024-2029 ($ billion)
- Data Table on Japan - Market size and forecast 2024-2029 ($ billion)
- Chart on Japan - Year-over-year growth 2024-2029 (%)
- Data Table on Japan - Year-over-year growth 2024-2029 (%)
- 13.12 UK - Market size and forecast 2024-2029
- Chart on UK - Market size and forecast 2024-2029 ($ billion)
- Data Table on UK - Market size and forecast 2024-2029 ($ billion)
- Chart on UK - Year-over-year growth 2024-2029 (%)
- Data Table on UK - Year-over-year growth 2024-2029 (%)
- 13.13 Canada - Market size and forecast 2024-2029
- Chart on Canada - Market size and forecast 2024-2029 ($ billion)
- Data Table on Canada - Market size and forecast 2024-2029 ($ billion)
- Chart on Canada - Year-over-year growth 2024-2029 (%)
- Data Table on Canada - Year-over-year growth 2024-2029 (%)
- 13.14 France - Market size and forecast 2024-2029
- Chart on France - Market size and forecast 2024-2029 ($ billion)
- Data Table on France - Market size and forecast 2024-2029 ($ billion)
- Chart on France - Year-over-year growth 2024-2029 (%)
- Data Table on France - Year-over-year growth 2024-2029 (%)
- 13.15 Italy - Market size and forecast 2024-2029
- Chart on Italy - Market size and forecast 2024-2029 ($ billion)
- Data Table on Italy - Market size and forecast 2024-2029 ($ billion)
- Chart on Italy - Year-over-year growth 2024-2029 (%)
- Data Table on Italy - Year-over-year growth 2024-2029 (%)
- 13.16 India - Market size and forecast 2024-2029
- Chart on India - Market size and forecast 2024-2029 ($ billion)
- Data Table on India - Market size and forecast 2024-2029 ($ billion)
- Chart on India - Year-over-year growth 2024-2029 (%)
- Data Table on India - Year-over-year growth 2024-2029 (%)
- 13.17 Spain - Market size and forecast 2024-2029
- Chart on Spain - Market size and forecast 2024-2029 ($ billion)
- Data Table on Spain - Market size and forecast 2024-2029 ($ billion)
- Chart on Spain - Year-over-year growth 2024-2029 (%)
- Data Table on Spain - Year-over-year growth 2024-2029 (%)
- 13.18 Market opportunity By Geographical Landscape
- Market opportunity By Geographical Landscape ($ billion)
- Data Tables on Market opportunity By Geographical Landscape ($ billion)
14 Drivers, Challenges, and Opportunity/Restraints
- 14.1 Market drivers
- 14.2 Market challenges
- 14.3 Impact of drivers and challenges
- Impact of drivers and challenges in 2024 and 2029
- 14.4 Market opportunities/restraints
15 Competitive Landscape
- 15.1 Overview
- 15.2 Competitive Landscape
- Overview on criticality of inputs and factors of differentiation
- 15.3 Landscape disruption
- Overview on factors of disruption
- 15.4 Industry risks
- Impact of key risks on business
16 Competitive Analysis
- 16.1 Companies profiled
- Companies covered
- 16.2 Company ranking index
- Company ranking index
- 16.3 Market positioning of companies
- Matrix on companies position and classification
- 16.4 Accenture PLC
- Accenture PLC - Overview
- Accenture PLC - Business segments
- Accenture PLC - Key news
- Accenture PLC - Key offerings
- Accenture PLC - Segment focus
- SWOT
- 16.5 Amdocs Ltd.
- Amdocs Ltd. - Overview
- Amdocs Ltd. - Product / Service
- Amdocs Ltd. - Key news
- Amdocs Ltd. - Key offerings
- SWOT
- 16.6 Aria Systems Inc.
- Aria Systems Inc. - Overview
- Aria Systems Inc. - Product / Service
- Aria Systems Inc. - Key offerings
- SWOT
- 16.7 Cerillion Plc
- Cerillion Plc - Overview
- Cerillion Plc - Business segments
- Cerillion Plc - Key offerings
- Cerillion Plc - Segment focus
- SWOT
- 16.8 CHR Solutions
- CHR Solutions - Overview
- CHR Solutions - Product / Service
- CHR Solutions - Key offerings
- SWOT
- 16.9 Comarch SA
- Comarch SA - Overview
- Comarch SA - Product / Service
- Comarch SA - Key news
- Comarch SA - Key offerings
- SWOT
- 16.10 Hansen Technologies Ltd.
- Hansen Technologies Ltd. - Overview
- Hansen Technologies Ltd. - Product / Service
- Hansen Technologies Ltd. - Key news
- Hansen Technologies Ltd. - Key offerings
- SWOT
- 16.11 Hewlett Packard Enterprise Co.
- Hewlett Packard Enterprise Co. - Overview
- Hewlett Packard Enterprise Co. - Business segments
- Hewlett Packard Enterprise Co. - Key news
- Hewlett Packard Enterprise Co. - Key offerings
- Hewlett Packard Enterprise Co. - Segment focus
- SWOT
- 16.12 Hitachi Ltd.
- Hitachi Ltd. - Overview
- Hitachi Ltd. - Business segments
- Hitachi Ltd. - Key news
- Hitachi Ltd. - Key offerings
- Hitachi Ltd. - Segment focus
- SWOT
- 16.13 Huawei Technologies Co. Ltd.
- Huawei Technologies Co. Ltd. - Overview
- Huawei Technologies Co. Ltd. - Product / Service
- Huawei Technologies Co. Ltd. - Key news
- Huawei Technologies Co. Ltd. - Key offerings
- SWOT
- 16.14 NEC Corp.
- NEC Corp. - Overview
- NEC Corp. - Business segments
- NEC Corp. - Key news
- NEC Corp. - Key offerings
- NEC Corp. - Segment focus
- SWOT
- 16.15 Nokia Corp.
- Nokia Corp. - Overview
- Nokia Corp. - Business segments
- Nokia Corp. - Key news
- Nokia Corp. - Key offerings
- Nokia Corp. - Segment focus
- SWOT
- 16.16 Optiva Inc.
- Optiva Inc. - Overview
- Optiva Inc. - Product / Service
- Optiva Inc. - Key news
- Optiva Inc. - Key offerings
- SWOT
- 16.17 Oracle Corp.
- Oracle Corp. - Overview
- Oracle Corp. - Business segments
- Oracle Corp. - Key news
- Oracle Corp. - Key offerings
- Oracle Corp. - Segment focus
- SWOT
- 16.18 SAP SE
- SAP SE - Overview
- SAP SE - Business segments
- SAP SE - Key news
- SAP SE - Key offerings
- SAP SE - Segment focus
- SWOT
17 Appendix
- 17.1 Scope of the report
- 17.2 Inclusions and exclusions checklist
- Inclusions checklist
- Exclusions checklist
- 17.3 Currency conversion rates for US$
- Currency conversion rates for US$
- 17.4 Research methodology
- Research methodology
- 17.5 Data procurement
- Information sources
- 17.6 Data validation
- Data validation
- 17.7 Validation techniques employed for market sizing
- Validation techniques employed for market sizing
- 17.8 Data synthesis
- Data synthesis
- 17.9 360 degree market analysis
- 360 degree market analysis
- 17.10 List of abbreviations
- List of abbreviations

