|
|
市場調査レポート
商品コード
1636340
造船市場レポート:タイプ別、エンドユーザー別、地域別、2025-2033年Ship Building Market Report by Type (Oil Tankers, Bulk Carriers, General Cargo Ships, Container Ships, Passenger Ships, and Others), End User (Transport Companies, Military), and Region 2025-2033 |
||||||

|
|||||||
カスタマイズ可能
|
|||||||

| 造船市場レポート:タイプ別、エンドユーザー別、地域別、2025-2033年 |
|
出版日: 2025年01月10日
発行: IMARC
ページ情報: 英文 128 Pages
納期: 2~3営業日
|

全表示
- 概要
- 図表
- 目次
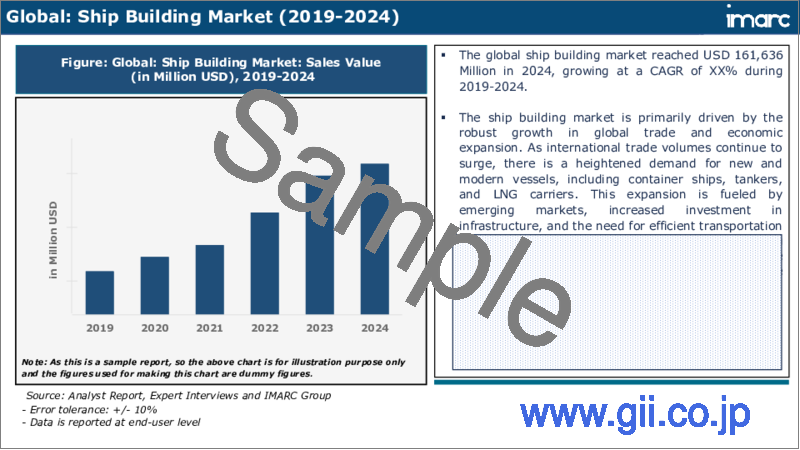
造船市場の世界市場規模は2024年に1,616億米ドルに達しました。IMARC Groupは、2025年から2033年にかけての成長率(CAGR)は3%で、2033年には2,106億米ドルに達すると予測しています。国際貿易の増加、軍艦建造の増加、モジュール式建造手法の採用などが市場を牽引する主な要因です。
造船とは、造船所として知られる専門施設で大型船舶を設計・製造するプロセスを指します。これには、石油タンカー、ばら積み貨物船、コンテナ船、一般貨物船、クルーズ船、フェリー、タグボート、軍用船の建造が含まれます。造船には、鉄鋼、アルミニウム、合金、木材、ガラス繊維、発泡プラスチック、複合材料など、さまざまな原材料が使用されます。パネル建造、セクション組立、ブロック建造、架設、進水、プレ艤装、塗装、滑走路艤装など、複数の製造工程が含まれます。製造された船舶は、船体の完全性と搭載機器の最適な機能を確保するため、静水圧試験、海上試験、エンジン試験など、いくつかの段階の試験を受ける。造船は、国の経済成長を助け、輸送、エネルギー、防衛、漁業など様々な産業の需要に応える、必要不可欠で戦略的な製造活動です。
造船市場動向:
急速なグローバリゼーションと経済成長による国際海上貿易の増加は、市場成長を促進する主な要因のひとつです。造船プロセスは、原油、石油製品、鉄鋼、鉱石、原材料、自動車、家電製品、果物・野菜、機械、その他の製造品の輸送に利用される大型貨物船、ばら積み貨物船、タンカーの建造に広く利用されており、その巨大な積載能力、費用対効果、燃料効率の高さがその理由です。これに加えて、新たな港湾施設の建設や自由貿易協定の締結を通じて海上貿易を促進するためのさまざまな政府イニシアチブの実施も、成長を促す要因として作用しています。さらに、急速な軍事近代化と国防費の増加が相まって、航空母艦、フリゲート、駆逐艦、巡洋艦、フルサービスキャリア、沿岸戦闘艦、コルベット、高速巡視船、水陸両用強襲揚陸艦などの高度な軍艦を建造するための造船需要が促進されています。さらに、複数の造船所が船舶の主要モジュールを建造し、その後、最終的な統合とテストを行うことを可能にする造船におけるモジュール建造アプローチの採用は、時間の節約、品質の向上、コストの削減をもたらし、市場成長にプラスの影響を与えています。さらに、造船における拡張現実と仮想現実(AR/VR)技術の統合は、従業員に没入型トレーニングを提供し、エンジニアが設計コンセプトを検証するために視覚環境にデジタル情報を配置できるようにするため、市場成長に好都合です。その他の要因としては、輸出入活動の活発化、環境に優しい船舶への需要の増加、造船におけるロボット工学の導入などが挙げられ、市場の成長を促進すると予想されます。
本レポートで扱う主な質問
- 世界の造船市場はこれまでどのように推移してきたのか?
- 世界の造船市場における促進要因、抑制要因、機会は何か?
- 各促進要因、抑制要因、機会が世界の造船市場に与える影響は?
- 主要な地域市場とは?
- 最も魅力的な造船市場はどの国か?
- タイプ別の市場内訳は?
- 造船市場で最も魅力的なタイプは?
- エンドユーザー別の市場内訳は?
- 造船市場で最も魅力的なエンドユーザーは?
- 世界の造船市場の競合構造は?
- 世界の造船市場における主要プレイヤー/企業は?
目次
第1章 序文
第2章 調査範囲と調査手法
- 調査の目的
- ステークホルダー
- データソース
- 一次情報
- 二次情報
- 市場推定
- ボトムアップアプローチ
- トップダウンアプローチ
- 調査手法
第3章 エグゼクティブサマリー
第4章 イントロダクション
- 概要
- 主要業界動向
第5章 世界の造船市場
- 市場概要
- 市場実績
- COVID-19の影響
- 市場予測
第6章 市場内訳:タイプ別
- 石油タンカー
- 市場動向
- 市場予測
- バルクキャリア
- 市場動向
- 市場予測
- 一般貨物船
- 市場動向
- 市場予測
- コンテナ船
- 市場動向
- 市場予測
- 旅客船
- 市場動向
- 市場予測
- その他
- 市場動向
- 市場予測
第7章 市場内訳:エンドユーザー別
- 輸送会社
- 市場動向
- 市場予測
- 軍事
- 市場動向
- 市場予測
第8章 市場内訳:地域別
- 北米
- 米国
- カナダ
- アジア太平洋地域
- 中国
- 日本
- インド
- 韓国
- オーストラリア
- インドネシア
- その他
- 欧州
- ドイツ
- フランス
- 英国
- イタリア
- スペイン
- ロシア
- その他
- ラテンアメリカ
- ブラジル
- メキシコ
- その他
- 中東・アフリカ
第9章 促進要因・抑制要因・機会
- 概要
- 促進要因
- 抑制要因
- 機会
第10章 バリューチェーン分析
第11章 ポーターのファイブフォース分析
- 概要
- 買い手の交渉力
- 供給企業の交渉力
- 競合の程度
- 新規参入業者の脅威
- 代替品の脅威
第12章 価格分析
第13章 競合情勢
- 市場構造
- 主要企業
- 主要企業のプロファイル
- China Shipbuilding Trading Co. Ltd.
- Damen Shipyards Group
- Fincantieri S.p.A.
- Huntington Ingalls Industries Inc.
- JSC United Shipbuilding Corporation
- Korea Shipbuilding & Offshore Engineering Co. Ltd.
- Larsen & Toubro Ltd.
- Mitsubishi Shipbuilding Co. Ltd.
- Oshima Shipbuilding Co. Ltd.
- Samsung Heavy Industries Co. Ltd.
- Tsuneishi Shipbuilding Co. Ltd.
- Yangzijiang Shipbuilding(Holdings)Ltd.
List of Figures
- Figure 1: Global: Ship Building Market: Major Drivers and Challenges
- Figure 2: Global: Ship Building Market: Sales Value (in Billion USD), 2019-2024
- Figure 3: Global: Ship Building Market Forecast: Sales Value (in Billion USD), 2025-2033
- Figure 4: Global: Ship Building Market: Breakup by Type (in %), 2024
- Figure 5: Global: Ship Building Market: Breakup by End User (in %), 2024
- Figure 6: Global: Ship Building Market: Breakup by Region (in %), 2024
- Figure 7: Global: Ship Building (Oil Tankers) Market: Sales Value (in Million USD), 2019 & 2024
- Figure 8: Global: Ship Building (Oil Tankers) Market Forecast: Sales Value (in Million USD), 2025-2033
- Figure 9: Global: Ship Building (Bulk Carriers) Market: Sales Value (in Million USD), 2019 & 2024
- Figure 10: Global: Ship Building (Bulk Carriers) Market Forecast: Sales Value (in Million USD), 2025-2033
- Figure 11: Global: Ship Building (General Cargo Ships) Market: Sales Value (in Million USD), 2019 & 2024
- Figure 12: Global: Ship Building (General Cargo Ships) Market Forecast: Sales Value (in Million USD), 2025-2033
- Figure 13: Global: Ship Building (Container Ships) Market: Sales Value (in Million USD), 2019 & 2024
- Figure 14: Global: Ship Building (Container Ships) Market Forecast: Sales Value (in Million USD), 2025-2033
- Figure 15: Global: Ship Building (Passenger Ships) Market: Sales Value (in Million USD), 2019 & 2024
- Figure 16: Global: Ship Building (Passenger Ships) Market Forecast: Sales Value (in Million USD), 2025-2033
- Figure 17: Global: Ship Building (Other Types) Market: Sales Value (in Million USD), 2019 & 2024
- Figure 18: Global: Ship Building (Other Types) Market Forecast: Sales Value (in Million USD), 2025-2033
- Figure 19: Global: Ship Building (Transport Companies) Market: Sales Value (in Million USD), 2019 & 2024
- Figure 20: Global: Ship Building (Transport Companies) Market Forecast: Sales Value (in Million USD), 2025-2033
- Figure 21: Global: Ship Building (Military) Market: Sales Value (in Million USD), 2019 & 2024
- Figure 22: Global: Ship Building (Military) Market Forecast: Sales Value (in Million USD), 2025-2033
- Figure 23: North America: Ship Building Market: Sales Value (in Million USD), 2019 & 2024
- Figure 24: North America: Ship Building Market Forecast: Sales Value (in Million USD), 2025-2033
- Figure 25: United States: Ship Building Market: Sales Value (in Million USD), 2019 & 2024
- Figure 26: United States: Ship Building Market Forecast: Sales Value (in Million USD), 2025-2033
- Figure 27: Canada: Ship Building Market: Sales Value (in Million USD), 2019 & 2024
- Figure 28: Canada: Ship Building Market Forecast: Sales Value (in Million USD), 2025-2033
- Figure 29: Asia-Pacific: Ship Building Market: Sales Value (in Million USD), 2019 & 2024
- Figure 30: Asia-Pacific: Ship Building Market Forecast: Sales Value (in Million USD), 2025-2033
- Figure 31: China: Ship Building Market: Sales Value (in Million USD), 2019 & 2024
- Figure 32: China: Ship Building Market Forecast: Sales Value (in Million USD), 2025-2033
- Figure 33: Japan: Ship Building Market: Sales Value (in Million USD), 2019 & 2024
- Figure 34: Japan: Ship Building Market Forecast: Sales Value (in Million USD), 2025-2033
- Figure 35: India: Ship Building Market: Sales Value (in Million USD), 2019 & 2024
- Figure 36: India: Ship Building Market Forecast: Sales Value (in Million USD), 2025-2033
- Figure 37: South Korea: Ship Building Market: Sales Value (in Million USD), 2019 & 2024
- Figure 38: South Korea: Ship Building Market Forecast: Sales Value (in Million USD), 2025-2033
- Figure 39: Australia: Ship Building Market: Sales Value (in Million USD), 2019 & 2024
- Figure 40: Australia: Ship Building Market Forecast: Sales Value (in Million USD), 2025-2033
- Figure 41: Indonesia: Ship Building Market: Sales Value (in Million USD), 2019 & 2024
- Figure 42: Indonesia: Ship Building Market Forecast: Sales Value (in Million USD), 2025-2033
- Figure 43: Others: Ship Building Market: Sales Value (in Million USD), 2019 & 2024
- Figure 44: Others: Ship Building Market Forecast: Sales Value (in Million USD), 2025-2033
- Figure 45: Europe: Ship Building Market: Sales Value (in Million USD), 2019 & 2024
- Figure 46: Europe: Ship Building Market Forecast: Sales Value (in Million USD), 2025-2033
- Figure 47: Germany: Ship Building Market: Sales Value (in Million USD), 2019 & 2024
- Figure 48: Germany: Ship Building Market Forecast: Sales Value (in Million USD), 2025-2033
- Figure 49: France: Ship Building Market: Sales Value (in Million USD), 2019 & 2024
- Figure 50: France: Ship Building Market Forecast: Sales Value (in Million USD), 2025-2033
- Figure 51: United Kingdom: Ship Building Market: Sales Value (in Million USD), 2019 & 2024
- Figure 52: United Kingdom: Ship Building Market Forecast: Sales Value (in Million USD), 2025-2033
- Figure 53: Italy: Ship Building Market: Sales Value (in Million USD), 2019 & 2024
- Figure 54: Italy: Ship Building Market Forecast: Sales Value (in Million USD), 2025-2033
- Figure 55: Spain: Ship Building Market: Sales Value (in Million USD), 2019 & 2024
- Figure 56: Spain: Ship Building Market Forecast: Sales Value (in Million USD), 2025-2033
- Figure 57: Russia: Ship Building Market: Sales Value (in Million USD), 2019 & 2024
- Figure 58: Russia: Ship Building Market Forecast: Sales Value (in Million USD), 2025-2033
- Figure 59: Others: Ship Building Market: Sales Value (in Million USD), 2019 & 2024
- Figure 60: Others: Ship Building Market Forecast: Sales Value (in Million USD), 2025-2033
- Figure 61: Latin America: Ship Building Market: Sales Value (in Million USD), 2019 & 2024
- Figure 62: Latin America: Ship Building Market Forecast: Sales Value (in Million USD), 2025-2033
- Figure 63: Brazil: Ship Building Market: Sales Value (in Million USD), 2019 & 2024
- Figure 64: Brazil: Ship Building Market Forecast: Sales Value (in Million USD), 2025-2033
- Figure 65: Mexico: Ship Building Market: Sales Value (in Million USD), 2019 & 2024
- Figure 66: Mexico: Ship Building Market Forecast: Sales Value (in Million USD), 2025-2033
- Figure 67: Others: Ship Building Market: Sales Value (in Million USD), 2019 & 2024
- Figure 68: Others: Ship Building Market Forecast: Sales Value (in Million USD), 2025-2033
- Figure 69: Middle East and Africa: Ship Building Market: Sales Value (in Million USD), 2019 & 2024
- Figure 70: Middle East and Africa: Ship Building Market: Breakup by Country (in %), 2024
- Figure 71: Middle East and Africa: Ship Building Market Forecast: Sales Value (in Million USD), 2025-2033
- Figure 72: Global: Ship Building Industry: Drivers, Restraints, and Opportunities
- Figure 73: Global: Ship Building Industry: Value Chain Analysis
- Figure 74: Global: Ship Building Industry: Porter's Five Forces Analysis
List of Tables
- Table 1: Global: Ship Building Market: Key Industry Highlights, 2024 & 2033
- Table 2: Global: Ship Building Market Forecast: Breakup by Type (in Million USD), 2025-2033
- Table 3: Global: Ship Building Market Forecast: Breakup by End User (in Million USD), 2025-2033
- Table 4: Global: Ship Building Market Forecast: Breakup by Region (in Million USD), 2025-2033
- Table 5: Global: Ship Building Market: Competitive Structure
- Table 6: Global: Ship Building Market: Key Players
The global ship building market size reached USD 161.6 Billion in 2024. Looking forward, IMARC Group expects the market to reach USD 210.6 Billion by 2033, exhibiting a growth rate (CAGR) of 3% during 2025-2033. The rising international trade, increasing construction of military vessels, and adoption of modular construction approach represent some of the key factors driving the market.
Ship building refers to the process of designing and fabricating large marine vessels in a specialized facility known as a shipyard. It includes the construction of oil tankers, bulk carriers, container ships, general cargo vessels, cruise ships, ferries, tugs, and military vessels. Shipbuilding utilizes various raw materials, such as steel, aluminum, alloys, wood, glass fibers, foam plastics, and composites. It involves multiple manufacturing steps, such as panel construction, section assembly, block building, erection, launching, pre-outfitting, painting, and slipway outfitting. Manufactured ships undergo several phases of testing, such as hydrostatic tests, sea trials, and engine tests, to ensure hull integrity and optimum functioning of onboard equipment. Ship building is an essential and strategic manufacturing activity that helps in a country's economic growth and caters to the demands of various industries, such as transportation, energy, defense, and fishing.
Ship Building Market Trends:
The rising international seaborne trade due to rapid globalization and economic growth is one of the primary factors driving the market growth. Ship building processis widely used to construct larger cargo ships, bulk carriers, and tankers that are utilized for transporting crude oils, petroleum products, steel, mineral ores, raw materials, vehicles, consumer electronics, fruits and vegetables, machinery, and other manufactured goods due to their enormous load-carrying capacity, cost-effectiveness, and fuel efficiency. In addition to this, the implementation of various government initiatives by to boost maritime trade through the construction of new port facilities and the signing of free trade agreements is acting as another growth-inducing factor. Furthermore, rapid military modernization coupled with increasing defense spending is facilitating the demand for shipbuilding to construct advanced military vessels, such as aircraft carriers, frigates, destroyers, cruisers, full-service carriers, littoral combat ships, corvettes, fast patrol vessels, and amphibious assault ships. Additionally, the adoption of a modular construction approach in shipbuilding that allows multiple shipyards to construct major modules of a ship, followed by final integration and testing, which in turn saves time, increases quality, and reduces costs, is positively influencing the market growth. Moreover, the integration of augmented and virtual reality (AR/VR) technologies in shipbuilding to provide immersive training to employees and allow engineers to place digital information in a visual environment to validate design concepts is favoring the market growth. Other factors, including rising import and export activities, increasing demand for eco-friendly ships, and the introduction of robotics in shipbuilding, are anticipated to drive the market growth.
Key Market Segmentation:
Type Insights:
- Oil Tankers
- Bulk Carriers
- General Cargo Ships
- Container Ships
- Passenger Ships
- Others
End User Insights:
- Transport Companies
- Military
Regional Insights:
- North America
- United States
- Canada
- Europe
- Germany
- France
- United Kingdom
- Italy
- Spain
- Russia
- Others
- Asia Pacific
- China
- Japan
- India
- South Korea
- Australia
- Indonesia
- Others
- Latin America
- Brazil
- Mexico
- Others
- Middle East and Africa
- The report has also provided a comprehensive analysis of all the major regional markets, which include North America (the United States and Canada); Europe (Germany, France, the United Kingdom, Italy, Spain, Russia, and others); Asia Pacific (China, Japan, India, South Korea, Australia, Indonesia, and others); Latin America (Brazil, Mexico, and others); and the Middle East and Africa. According to the report, Asia Pacific was the largest market for ship building. Some of the factors driving the Asia Pacific ship building market included the increasing maritime trade activities, rising defense budget, and significant technological advancements.
Competitive Landscape:
- The report has also provided a comprehensive analysis of the competitive landscape in the global ship building market. Competitive analysis such as market structure, market share by key players, player positioning, top winning strategies, competitive dashboard, and company evaluation quadrant has been covered in the report. Also, detailed profiles of all major companies have been provided. Some of the companies covered include China Shipbuilding Trading Co. Ltd., Damen Shipyards Group, Fincantieri S.p.A., Huntington Ingalls Industries Inc., JSC United Shipbuilding Corporation, Korea Shipbuilding & Offshore Engineering Co. Ltd., Larsen & Toubro Ltd., Mitsubishi Shipbuilding Co. Ltd., Oshima Shipbuilding Co. Ltd., Samsung Heavy Industries Co. Ltd., Tsuneishi Shipbuilding Co. Ltd., Yangzijiang Shipbuilding (Holdings) Ltd., etc.
Key Questions Answered in This Report:
- How has the global ship building market performed so far, and how will it perform in the coming years?
- What are the drivers, restraints, and opportunities in the global ship building market?
- What is the impact of each driver, restraint, and opportunity on the global ship building market?
- What are the key regional markets?
- Which countries represent the most attractive ship building market?
- What is the breakup of the market based on the type?
- Which is the most attractive type in the ship building market?
- What is the breakup of the market based on the end user?
- Which is the most attractive end user in the ship building market?
- What is the competitive structure of the global ship building market?
- Who are the key players/companies in the global ship building market?
Table of Contents
1 Preface
2 Scope and Methodology
- 2.1 Objectives of the Study
- 2.2 Stakeholders
- 2.3 Data Sources
- 2.3.1 Primary Sources
- 2.3.2 Secondary Sources
- 2.4 Market Estimation
- 2.4.1 Bottom-Up Approach
- 2.4.2 Top-Down Approach
- 2.5 Forecasting Methodology
3 Executive Summary
4 Introduction
- 4.1 Overview
- 4.2 Key Industry Trends
5 Global Ship Building Market
- 5.1 Market Overview
- 5.2 Market Performance
- 5.3 Impact of COVID-19
- 5.4 Market Forecast
6 Market Breakup by Type
- 6.1 Oil Tankers
- 6.1.1 Market Trends
- 6.1.2 Market Forecast
- 6.2 Bulk Carriers
- 6.2.1 Market Trends
- 6.2.2 Market Forecast
- 6.3 General Cargo Ships
- 6.3.1 Market Trends
- 6.3.2 Market Forecast
- 6.4 Container Ships
- 6.4.1 Market Trends
- 6.4.2 Market Forecast
- 6.5 Passenger Ships
- 6.5.1 Market Trends
- 6.5.2 Market Forecast
- 6.6 Others
- 6.6.1 Market Trends
- 6.6.2 Market Forecast
7 Market Breakup by End User
- 7.1 Transport Companies
- 7.1.1 Market Trends
- 7.1.2 Market Forecast
- 7.2 Military
- 7.2.1 Market Trends
- 7.2.2 Market Forecast
8 Market Breakup by Region
- 8.1 North America
- 8.1.1 United States
- 8.1.1.1 Market Trends
- 8.1.1.2 Market Forecast
- 8.1.2 Canada
- 8.1.2.1 Market Trends
- 8.1.2.2 Market Forecast
- 8.1.1 United States
- 8.2 Asia-Pacific
- 8.2.1 China
- 8.2.1.1 Market Trends
- 8.2.1.2 Market Forecast
- 8.2.2 Japan
- 8.2.2.1 Market Trends
- 8.2.2.2 Market Forecast
- 8.2.3 India
- 8.2.3.1 Market Trends
- 8.2.3.2 Market Forecast
- 8.2.4 South Korea
- 8.2.4.1 Market Trends
- 8.2.4.2 Market Forecast
- 8.2.5 Australia
- 8.2.5.1 Market Trends
- 8.2.5.2 Market Forecast
- 8.2.6 Indonesia
- 8.2.6.1 Market Trends
- 8.2.6.2 Market Forecast
- 8.2.7 Others
- 8.2.7.1 Market Trends
- 8.2.7.2 Market Forecast
- 8.2.1 China
- 8.3 Europe
- 8.3.1 Germany
- 8.3.1.1 Market Trends
- 8.3.1.2 Market Forecast
- 8.3.2 France
- 8.3.2.1 Market Trends
- 8.3.2.2 Market Forecast
- 8.3.3 United Kingdom
- 8.3.3.1 Market Trends
- 8.3.3.2 Market Forecast
- 8.3.4 Italy
- 8.3.4.1 Market Trends
- 8.3.4.2 Market Forecast
- 8.3.5 Spain
- 8.3.5.1 Market Trends
- 8.3.5.2 Market Forecast
- 8.3.6 Russia
- 8.3.6.1 Market Trends
- 8.3.6.2 Market Forecast
- 8.3.7 Others
- 8.3.7.1 Market Trends
- 8.3.7.2 Market Forecast
- 8.3.1 Germany
- 8.4 Latin America
- 8.4.1 Brazil
- 8.4.1.1 Market Trends
- 8.4.1.2 Market Forecast
- 8.4.2 Mexico
- 8.4.2.1 Market Trends
- 8.4.2.2 Market Forecast
- 8.4.3 Others
- 8.4.3.1 Market Trends
- 8.4.3.2 Market Forecast
- 8.4.1 Brazil
- 8.5 Middle East and Africa
- 8.5.1 Market Trends
- 8.5.2 Market Breakup by Country
- 8.5.3 Market Forecast
9 Drivers, Restraints, and Opportunities
- 9.1 Overview
- 9.2 Drivers
- 9.3 Restraints
- 9.4 Opportunities
10 Value Chain Analysis
11 Porters Five Forces Analysis
- 11.1 Overview
- 11.2 Bargaining Power of Buyers
- 11.3 Bargaining Power of Suppliers
- 11.4 Degree of Competition
- 11.5 Threat of New Entrants
- 11.6 Threat of Substitutes
12 Price Analysis
13 Competitive Landscape
- 13.1 Market Structure
- 13.2 Key Players
- 13.3 Profiles of Key Players
- 13.3.1 China Shipbuilding Trading Co. Ltd.
- 13.3.1.1 Company Overview
- 13.3.1.2 Product Portfolio
- 13.3.2 Damen Shipyards Group
- 13.3.2.1 Company Overview
- 13.3.2.2 Product Portfolio
- 13.3.3 Fincantieri S.p.A.
- 13.3.3.1 Company Overview
- 13.3.3.2 Product Portfolio
- 13.3.3.3 Financials
- 13.3.4 Huntington Ingalls Industries Inc.
- 13.3.4.1 Company Overview
- 13.3.4.2 Product Portfolio
- 13.3.4.3 Financials
- 13.3.4.4 SWOT Analysis
- 13.3.5 JSC United Shipbuilding Corporation
- 13.3.5.1 Company Overview
- 13.3.5.2 Product Portfolio
- 13.3.6 Korea Shipbuilding & Offshore Engineering Co. Ltd.
- 13.3.6.1 Company Overview
- 13.3.6.2 Product Portfolio
- 13.3.6.3 Financials
- 13.3.7 Larsen & Toubro Ltd.
- 13.3.7.1 Company Overview
- 13.3.7.2 Product Portfolio
- 13.3.7.3 Financials
- 13.3.7.4 SWOT Analysis
- 13.3.8 Mitsubishi Shipbuilding Co. Ltd.
- 13.3.8.1 Company Overview
- 13.3.8.2 Product Portfolio
- 13.3.8.3 Financials
- 13.3.8.4 SWOT Analysis
- 13.3.9 Oshima Shipbuilding Co. Ltd.
- 13.3.9.1 Company Overview
- 13.3.9.2 Product Portfolio
- 13.3.10 Samsung Heavy Industries Co. Ltd.
- 13.3.10.1 Company Overview
- 13.3.10.2 Product Portfolio
- 13.3.10.3 Financials
- 13.3.11 Tsuneishi Shipbuilding Co. Ltd.
- 13.3.11.1 Company Overview
- 13.3.11.2 Product Portfolio
- 13.3.12 Yangzijiang Shipbuilding (Holdings) Ltd.
- 13.3.12.1 Company Overview
- 13.3.12.2 Product Portfolio
- 13.3.12.3 Financials
- 13.3.1 China Shipbuilding Trading Co. Ltd.
Kindly note that this only represents a partial list of companies, and the complete list has been provided in the report.

