
造船:市場シェア分析、業界動向と統計、成長予測(2026年~2031年)
Shipbuilding - Market Share Analysis, Industry Trends & Statistics, Growth Forecasts (2026 - 2031)
- 発行日
- ページ情報
- 英文 150 Pages
- 納期
- 2~3営業日
- 商品コード
- 1940648
- カスタマイズ可能 お客様のご希望に応じて、既存データの加工や未掲載情報(例:国別セグメント)の追加などの対応が可能です。詳細はお問い合わせください。
- 適宜更新あり 本レポートは最新情報反映のため適宜更新し、内容構成変更を行う場合があります。ご検討の際はお問い合わせください。
- 翻訳ツール提供対象 PDF対応AI翻訳ツールの無料貸し出しサービスのご利用が可能です
概要
造船市場は2025年に1,572億1,000万米ドルと評価され、2026年の1,644億7,000万米ドルから2031年までに2,062億4,000万米ドルに達すると予測されています。
予測期間(2026-2031年)におけるCAGRは4.62%と見込まれます。
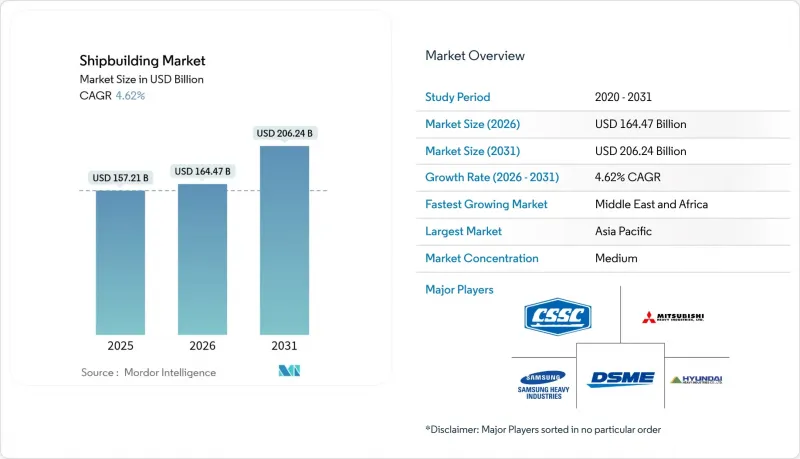
この好調な見通しは、より厳格な炭素排出目標、海上貿易量の増加、そして記録的な代替燃料新造船契約が相まって、一部の過剰生産能力を相殺していることに起因します。中国の膨大な受注残、韓国のLNG運搬船における技術的優位性、そして中東・アフリカにおける新興エネルギープロジェクトが、造船所への持続的な受注パイプラインを支えています。2020年末以降、鋼材価格の変動性が高まり、バースの空き状況が逼迫したことで、平均新造船価格は上昇しています。しかしながら、船主はIMO 2028規則に対応するため、引き続き将来の建造枠を確保しています。先進的な造船所がデジタルツインやモジュラーブロック技術を導入するにつれ、建造サイクルタイムは短縮され、増加する運賃需要を迅速に収益化することが可能となり、造船市場における競争上の差別化をさらに促進しています。
世界の造船市場の動向と洞察
増加する世界の海上貿易量
コンテナ貨物は2024年に急回復し、取扱量が大幅に増加したことで稼働コンテナ船隊が100万TEU増加し、中国・韓国・日本の造船所における新規受注を支えました。紅海における安全保障リスクへの対応として喜望峰回航が継続したことで、スエズ運河経由の主要取扱量は5分の4以上急落したもの、トンマイル需要は拡大しました。航路距離の延長は、港湾混雑に伴う運航上の課題があるにもかかわらず、バルカー船や大型で燃料効率の高いコンテナ船への需要を持続させています。欧州が米国からカタールや西アフリカへLNG調達先を多様化させる動きは、大西洋貿易ルートの拡大につながり、長距離輸送の必要性をさらに強めています。こうした動向が相まって、2020年代半ばまでの造船市場の受注パイプラインに好影響を与えています。
LNG燃料船の需要急増
アジア地域が電力・重工業向け低炭素原料を模索する中、世界のLNG消費量は2040年までに5分の3増加すると予測されています。カタールエナジーによるサムスン重工業へのLNG運搬船15隻の発注により、同社の受注残は86隻に達しました。一方、ハンファオーシャンはこれまでに180隻を納入し、2025年末までに年間生産能力を24隻に引き上げる計画です。シェル社は、2030年までに船舶用LNG需要が急増し、デュアルフューエル推進が主要な移行選択肢となると予測しています。地政学的な逆風が貨物の流れを変える可能性はあるもの、カタールの生産ラインと米国の輸出ターミナルによる膨大な供給量が、液化プロセスの成長を長期にわたり固定化させる見込みです。これにより、造船市場には複数年にわたる見通しが確立されるでしょう。
変動する鉄鋼・原材料価格
2024年には中国の鉄筋価格が2割以上下落し、鉄鉱石の指標価格も急落。これにより供給過剰が生じ、世界の相場が週単位で変動する状況が続いております。熱延コイルの年間平均価格はトン当たり850米ドル、アルミニウム価格も急騰し、依然として変動が激しい状態です。20万DWTのばら積み貨物船1隻で最大2万トンの鋼板を使用するため、造船所の利益率は縮小傾向にあります。これにより、複数年にわたる建造期間中に数,000万米ドル規模の価格変動リスクに晒されることになります。インドとタイにおけるダンピング防止措置は、原材料調達を複雑化し、物流コストを押し上げています。結果として、一部の船主は新規契約の締結を遅らせており、造船市場の短期的な受注量を圧縮する要因となっています。
セグメント分析
2025年における造船市場シェアの36.74%をバルクキャリアが占め、造船市場で最大のシェアを獲得しました。規模の経済性、低速エンジン、スクラバー後付け改修が継続的な受注を支えています。一方、コンテナ船セグメントは過剰供給に直面しつつも、効率性向上と脱炭素化経路を両立できる大型ネオパナマックス設計への転換を進めています。タンカー需要は制裁による貿易経路変更の影響を受け、長距離輸送向けのアフラマックス級およびスエズマックス級の需要が拡大しました。
オフショア支援船は、世界のタービン基礎が130メートルのモノパイルへ拡大する中、2031年までに4.71%という最速のCAGRを達成します。中国は年間オフショア受注高で堅調な伸びを記録し、コストと品質の均衡により欧州既存企業に対するシェアを拡大しました。海軍水上戦闘艦は技術的に複雑な船体を安定的に供給し、キャッシュフローを安定化させています。クルーズ船の予約はパンデミック後に回復したもの、船主は慎重姿勢を維持し、LNGデュアルフューエルおよびメタノール対応船に注力しています。このバランスの取れた受注構成が景気変動を緩和し、造船市場の幅広い受注基盤を支えています。
2025年時点でも、従来型エンジンは造船市場シェアの72.85%を占めております。これは、燃料油インフラが世界的に整備されており、乗組員の習熟度が高いことが理由です。シェル社の予測によれば、海上輸送需要は2040年までに5分の3増加する可能性があり、デュアルフューエルLNGの採用が加速しております。しかしながら、アフリカや南米における燃料ネットワークの不足が、導入地域を制限する要因となっております。ハイブリッド電気モジュールは、位置保持精度がコストを上回る洋上風力発電施設や調査船に最初に導入される見込みです。
メタノールおよびアンモニア対応契約は、MAN ESやWinGDなどのエンジンメーカーが2025年の引き渡しに向けた商業モデルを検証する中で、CAGRCAGR4.86%で増加します。原子力推進は海軍専用ですが、次世代マイクロリアクターは2035年以降に商業的実現可能性に達する可能性があり、造船市場に新たな転換のベクトルをもたらすでしょう。
地域別分析
2025年時点でアジア太平洋地域は造船市場シェアの38.30%を占め、同市場における中核的地位を強調しています。中国単独で世界の受注の5分の3を確保し、ばら積み貨物船の4分の3を出荷しました。低廉な人件費、統合されたバリューチェーン、そして広大な国内鉄鋼基盤により、中国造船所は通貨高の影響を考慮してもコスト競争力を維持しています。韓国は高度な封じ込め技術によりLNG運搬船などの高付加価値ニッチ市場を守り、世界のガスタンカー生産量の5分の3以上を占めています。人口高齢化による労働力不足にもかかわらず、日本は品質重視分野とゼロエミッションパイロットプロジェクトにおけるシェアを維持しています。
中東・アフリカ地域は、石油・ガス設備投資がエネルギー物流回廊に流入する中、2031年までにCAGR4.77%という最速の伸びを示すと予測されています(IEA.ORG)。サウジアラビアとUAEは、国内調達比率の要件により地域内建造が必須となる大型重量物運搬船やモジュール運搬船の大型プロジェクトを発注しています。トルコは紅海情勢不安の中、米国輸出業者と欧州買い手間のLNG中継拠点として台頭し、ドック修理・新造船投資を促進しています。北米はジョーンズ法を活用し高付加価値設置船の国内建造を維持、米海軍の30年計画が複数プログラム資金を確固たるものにしています。欧州の造船所は環境規制対応により艦隊更新が加速する一方、鋼材需要の低迷とマクロ経済の逆風により稼働率は抑制されます。しかしながらノルウェーとデンマークはメタノール・アンモニア推進技術の研究開発を主導し、早期導入顧客を獲得しています。南米では選択的な成長が見られ、ブラジルが海軍向け潜水艦・支援艦発注を推進する「ProSub」計画が進行中です。こうした地域ごとの要請のモザイクが、造船市場全体に多様な機会を持続させています。
その他の特典:
- エクセル形式の市場予測(ME)シート
- アナリストによる3ヶ月間のサポート
よくあるご質問
目次
第1章 イントロダクション
- 調査の前提条件と市場の定義
- 調査範囲
第2章 調査手法
第3章 エグゼクティブサマリー
第4章 市場情勢
- 市場概要
- 市場促進要因
- 増加する世界の海上貿易量
- 脱炭素化義務が代替燃料受注を牽引
- LNG燃料船に対する需要の急増
- 海軍艦隊近代化計画
- 洋上風力発電設備設置船の需要
- デジタルツインを活用したモジュラー建設
- 市場抑制要因
- 鋼材及び原材料価格の変動性
- 主要拠点における熟練労働者不足
- バルクセグメントにおける世界の造船所の過剰生産能力
- 国際海事機関(IMO)の温室効果ガス規制強化に伴うコスト負担
- バリュー/サプライチェーン分析
- 規制情勢
- テクノロジーの展望
- ポーターのファイブフォース分析
- 供給企業の交渉力
- 買い手の交渉力
- 新規参入業者の脅威
- 代替品の脅威
- 競争企業間の敵対関係
第5章 市場規模と成長予測(金額(米ドル))
- 船舶タイプ別
- ばら積み貨物船
- 石油タンカー
- 製品/化学品タンカー
- LNG/LPG運搬船
- コンテナ船
- 一般貨物船
- 旅客船・クルーズ船
- オフショア支援船
- 海軍・沿岸警備隊艦艇
- 特殊船(ローロー船、自動車運搬船など)
- 推進技術別
- 従来型(重油/軽油)
- デュアル燃料LNG
- メタノール/アンモニア対応
- ハイブリッド・電気自動車
- 原子力(海軍)
- エンドユーザー別
- 商船会社
- オフショア・エネルギー事業者
- 旅客輸送・クルーズライン
- 防衛・沿岸警備隊
- その他(調査、漁業)
- 素材別
- 鉄鋼
- アルミニウム
- 複合材料・先進合金
- 地域別
- 北米
- 米国
- カナダ
- その他北米地域
- 南米
- ブラジル
- チリ
- その他南米
- 欧州
- ドイツ
- 英国
- フランス
- イタリア
- ノルウェー
- スペイン
- ロシア
- その他欧州地域
- アジア太平洋地域
- 中国
- 日本
- 韓国
- インド
- その他アジア太平洋地域
- 中東・アフリカ
- アラブ首長国連邦
- サウジアラビア
- トルコ
- 南アフリカ
- その他中東・アフリカ地域
- 北米
第6章 競合情勢
- 市場集中度
- 戦略的動向
- 市場シェア分析
- 企業プロファイル
- China State Shipbuilding Corporation
- Mitsubishi Heavy Industries Ltd
- Samsung Heavy Industries
- Daewoo Shipbuilding Marine Engineering Co. Ltd
- Hyundai Heavy Industries Co. Ltd
- Sumitomo Heavy Industries
- Hanjin Heavy Industries and Construction Co.
- Yangzijiang Shipbuilding Ltd
- United Shipbuilding Corporation
- STX Group
第7章 市場機会と将来の展望
- 発行日
- 発行
- Mordor Intelligence
- ページ情報
- 英文 150 Pages
- 納期
- 2~3営業日


