|
|
市場調査レポート
商品コード
1701850
シングルセルマルチオミクス市場レポート:タイプ別、製品タイプ別、技法別、用途別、エンドユーザー別、地域別、2025年~2033年Single Cell Multiomics Market Report by Type, Product Type, Technique, Application, End User, and Region 2025-2033 |
||||||
|
|||||||
カスタマイズ可能
|
|||||||

| シングルセルマルチオミクス市場レポート:タイプ別、製品タイプ別、技法別、用途別、エンドユーザー別、地域別、2025年~2033年 |
|
出版日: 2025年04月01日
発行: IMARC
ページ情報: 英文 145 Pages
納期: 2~3営業日
|

全表示
- 概要
- 図表
- 目次
シングルセルマルチオミクス市場の世界市場規模は2024年に46億米ドルに達しました。今後、IMARC Groupは、2033年には166億米ドルに達し、2025年から2033年にかけて14.6%の成長率(CAGR)を示すと予測しています。
シングルセルマルチオミクスとは、細胞の多様性と異質性に関する洞察を得るために、個々の細胞から複数の種類の分子を分析することを指します。シングルセルゲノミクス、プロテオミクス、トランスクリプトミクス、メタボロミクスを含み、神経学、免疫学、細胞生物学、腫瘍学で広く利用されています。シングルセルマルチオミクスは、異種組織の集団アーキテクチャと細胞特性の理解を深めるのに役立ちます。単一細胞の分離と分注技術を利用して、分子層や複雑な生物学的構造の画像を提供します。従来から用いられているライブセル蛍光イメージング技術と比較すると、シングルセルマルチオミクスは解析のために細胞を破壊する必要がなく、単一細胞から複数のタイプの分子を測定することができます。その結果、バイオテクノロジーや製薬会社、病院、学術研究機関、診断研究所などで広く利用されています。
シングルセルマルチオミクス市場動向:
がんや伝染性ウイルス性疾患などの慢性疾患の有病率の上昇は、市場の成長を促進する重要な要因の一つです。シングルセルマルチオミクスは、腫瘍内の細胞成分の高解像度の全体像を提供します。さらに、細胞の不均一性、腫瘍微小環境、抗体開発の可視化と解析のための製品採用が広がっていることも、市場の成長を後押ししています。さらに、デオキシリボ核酸(DNA)、メッセンジャーリボ核酸(mRNA)、タンパク質のプロファイルを単一細胞の分解能で測定できる単一細胞分離技術やバーコード技術の開発など、さまざまな技術の進歩が市場の成長を後押ししています。これに伴い、製薬業界の著しい成長が市場成長にプラスの影響を与えています。その他にも、遺伝性疾患の治療における個別化医療の導入の増加や、ヘルスケアインフラの広範な改善などが、市場の成長を後押しすると予想されます。
本レポートで扱う主な質問
- 2024年の世界のシングルセルマルチオミクス市場の市場規模は?
- 2025-2033年の世界のシングルセルマルチオミクス市場の予想成長率は?
- 世界のシングルセルマルチオミクス市場に対するCOVID-19の影響は?
- 世界のシングルセルマルチオミクス市場を牽引する主要因は何か?
- 世界のシングルセルマルチオミクス市場におけるタイプ別の内訳は?
- 世界のシングルセルマルチオミクス市場の製品タイプ別の内訳は?
- 世界のシングルセルマルチオミクス市場の技法別の内訳は?
- 世界のシングルセルマルチオミクス市場の用途別の内訳は?
- 世界のシングルセルマルチオミクス市場のエンドユーザー別内訳は?
- 世界のシングルセルマルチオミクス市場における主要地域は?
- 世界のシングルセルマルチオミクス市場における主要プレイヤー/企業は?
目次
第1章 序文
第2章 調査範囲と調査手法
- 調査の目的
- ステークホルダー
- データソース
- 一次情報
- 二次情報
- 市場推定
- ボトムアップアプローチ
- トップダウンアプローチ
- 調査手法
第3章 エグゼクティブサマリー
第4章 イントロダクション
- 概要
- 主要業界動向
第5章 世界のシングルセルマルチオミクス市場
- 市場概要
- 市場実績
- COVID-19の影響
- 市場予測
第6章 市場内訳:タイプ別
- シングルセルゲノミクス
- シングルセルプロテオミクス
- 単一細胞トランスクリプトミクス
- 単一細胞メタボロミクス
第7章 市場内訳:製品タイプ別
- 消耗品
- 機器
- ソフトウェア
第8章 市場内訳:技法別
- 単一細胞の分離と分配
- 単一細胞解析
第9章 市場内訳:用途別
- 腫瘍学
- 細胞生物学
- 神経学
- その他
第10章 市場内訳:エンドユーザー別
- 学術機関
- 契約調査機関
- 製薬およびバイオテクノロジー企業
第11章 市場内訳:地域別
- 北米
- 米国
- カナダ
- アジア太平洋地域
- 中国
- 日本
- インド
- 韓国
- オーストラリア
- インドネシア
- その他
- 欧州
- ドイツ
- フランス
- 英国
- イタリア
- スペイン
- ロシア
- その他
- ラテンアメリカ
- ブラジル
- メキシコ
- その他
- 中東・アフリカ
- 市場内訳:国別
第12章 SWOT分析
- 概要
- 強み
- 弱み
- 機会
- 脅威
第13章 バリューチェーン分析
第14章 ポーターのファイブフォース分析
- 概要
- 買い手の交渉力
- 供給企業の交渉力
- 競合の程度
- 新規参入業者の脅威
- 代替品の脅威
第15章 価格分析
第16章 競合情勢
- 市場構造
- 主要企業
- 主要企業のプロファイル
- 10x Genomics Inc.
- Becton Dickinson and Company
- BGI Genomics(BGI Group)
- Bio-RAD Laboratories Inc.
- Fluidigm Corporation
- Illumina Inc.
- Mission Bio
- NanoCellect Biomedical
- Nanostring Technologies Inc.
- Proteona
- Takara Bio Inc.(Takara Holdings)
- Thermo Fisher Scientific Inc.
List of Figures
- Figure 1: Global: Single Cell Multiomics Market: Major Drivers and Challenges
- Figure 2: Global: Single Cell Multiomics Market: Sales Value (in Billion USD), 2019-2024
- Figure 3: Global: Single Cell Multiomics Market Forecast: Sales Value (in Billion USD), 2025-2033
- Figure 4: Global: Single Cell Multiomics Market: Breakup by Type (in %), 2024
- Figure 5: Global: Single Cell Multiomics Market: Breakup by Product Type (in %), 2024
- Figure 6: Global: Single Cell Multiomics Market: Breakup by Technique (in %), 2024
- Figure 7: Global: Single Cell Multiomics Market: Breakup by Application (in %), 2024
- Figure 8: Global: Single Cell Multiomics Market: Breakup by End User (in %), 2024
- Figure 9: Global: Single Cell Multiomics Market: Breakup by Region (in %), 2024
- Figure 10: Global: Single Cell Multiomics (Single Cell Genomics) Market: Sales Value (in Million USD), 2019 & 2024
- Figure 11: Global: Single Cell Multiomics (Single Cell Genomics) Market Forecast: Sales Value (in Million USD), 2025-2033
- Figure 12: Global: Single Cell Multiomics (Single Cell Proteomics) Market: Sales Value (in Million USD), 2019 & 2024
- Figure 13: Global: Single Cell Multiomics (Single Cell Proteomics) Market Forecast: Sales Value (in Million USD), 2025-2033
- Figure 14: Global: Single Cell Multiomics (Single Cell Transcriptomics) Market: Sales Value (in Million USD), 2019 & 2024
- Figure 15: Global: Single Cell Multiomics (Single Cell Transcriptomics) Market Forecast: Sales Value (in Million USD), 2025-2033
- Figure 16: Global: Single Cell Multiomics (Single Cell Metabolomics) Market: Sales Value (in Million USD), 2019 & 2024
- Figure 17: Global: Single Cell Multiomics (Single Cell Metabolomics) Market Forecast: Sales Value (in Million USD), 2025-2033
- Figure 18: Global: Single Cell Multiomics (Consumables) Market: Sales Value (in Million USD), 2019 & 2024
- Figure 19: Global: Single Cell Multiomics (Consumables) Market Forecast: Sales Value (in Million USD), 2025-2033
- Figure 20: Global: Single Cell Multiomics (Instruments) Market: Sales Value (in Million USD), 2019 & 2024
- Figure 21: Global: Single Cell Multiomics (Instruments) Market Forecast: Sales Value (in Million USD), 2025-2033
- Figure 22: Global: Single Cell Multiomics (Software) Market: Sales Value (in Million USD), 2019 & 2024
- Figure 23: Global: Single Cell Multiomics (Software) Market Forecast: Sales Value (in Million USD), 2025-2033
- Figure 24: Global: Single Cell Multiomics (Single-Cell Isolation and Dispensing) Market: Sales Value (in Million USD), 2019 & 2024
- Figure 25: Global: Single Cell Multiomics (Single-Cell Isolation and Dispensing) Market Forecast: Sales Value (in Million USD), 2025-2033
- Figure 26: Global: Single Cell Multiomics (Single-Cell Analysis) Market: Sales Value (in Million USD), 2019 & 2024
- Figure 27: Global: Single Cell Multiomics (Single-Cell Analysis) Market Forecast: Sales Value (in Million USD), 2025-2033
- Figure 28: Global: Single Cell Multiomics (Oncology) Market: Sales Value (in Million USD), 2019 & 2024
- Figure 29: Global: Single Cell Multiomics (Oncology) Market Forecast: Sales Value (in Million USD), 2025-2033
- Figure 30: Global: Single Cell Multiomics (Cell Biology) Market: Sales Value (in Million USD), 2019 & 2024
- Figure 31: Global: Single Cell Multiomics (Cell Biology) Market Forecast: Sales Value (in Million USD), 2025-2033
- Figure 32: Global: Single Cell Multiomics (Neurology) Market: Sales Value (in Million USD), 2019 & 2024
- Figure 33: Global: Single Cell Multiomics (Neurology) Market Forecast: Sales Value (in Million USD), 2025-2033
- Figure 34: Global: Single Cell Multiomics (Other Applications) Market: Sales Value (in Million USD), 2019 & 2024
- Figure 35: Global: Single Cell Multiomics (Other Applications) Market Forecast: Sales Value (in Million USD), 2025-2033
- Figure 36: Global: Single Cell Multiomics (Academic Institutes) Market: Sales Value (in Million USD), 2019 & 2024
- Figure 37: Global: Single Cell Multiomics (Academic Institutes) Market Forecast: Sales Value (in Million USD), 2025-2033
- Figure 38: Global: Single Cell Multiomics (Contract Research Organizations) Market: Sales Value (in Million USD), 2019 & 2024
- Figure 39: Global: Single Cell Multiomics (Contract Research Organizations) Market Forecast: Sales Value (in Million USD), 2025-2033
- Figure 40: Global: Single Cell Multiomics (Pharmaceutical and Biotech Companies) Market: Sales Value (in Million USD), 2019 & 2024
- Figure 41: Global: Single Cell Multiomics (Pharmaceutical and Biotech Companies) Market Forecast: Sales Value (in Million USD), 2025-2033
- Figure 42: North America: Single Cell Multiomics Market: Sales Value (in Million USD), 2019 & 2024
- Figure 43: North America: Single Cell Multiomics Market Forecast: Sales Value (in Million USD), 2025-2033
- Figure 44: United States: Single Cell Multiomics Market: Sales Value (in Million USD), 2019 & 2024
- Figure 45: United States: Single Cell Multiomics Market Forecast: Sales Value (in Million USD), 2025-2033
- Figure 46: Canada: Single Cell Multiomics Market: Sales Value (in Million USD), 2019 & 2024
- Figure 47: Canada: Single Cell Multiomics Market Forecast: Sales Value (in Million USD), 2025-2033
- Figure 48: Asia-Pacific: Single Cell Multiomics Market: Sales Value (in Million USD), 2019 & 2024
- Figure 49: Asia-Pacific: Single Cell Multiomics Market Forecast: Sales Value (in Million USD), 2025-2033
- Figure 50: China: Single Cell Multiomics Market: Sales Value (in Million USD), 2019 & 2024
- Figure 51: China: Single Cell Multiomics Market Forecast: Sales Value (in Million USD), 2025-2033
- Figure 52: Japan: Single Cell Multiomics Market: Sales Value (in Million USD), 2019 & 2024
- Figure 53: Japan: Single Cell Multiomics Market Forecast: Sales Value (in Million USD), 2025-2033
- Figure 54: India: Single Cell Multiomics Market: Sales Value (in Million USD), 2019 & 2024
- Figure 55: India: Single Cell Multiomics Market Forecast: Sales Value (in Million USD), 2025-2033
- Figure 56: South Korea: Single Cell Multiomics Market: Sales Value (in Million USD), 2019 & 2024
- Figure 57: South Korea: Single Cell Multiomics Market Forecast: Sales Value (in Million USD), 2025-2033
- Figure 58: Australia: Single Cell Multiomics Market: Sales Value (in Million USD), 2019 & 2024
- Figure 59: Australia: Single Cell Multiomics Market Forecast: Sales Value (in Million USD), 2025-2033
- Figure 60: Indonesia: Single Cell Multiomics Market: Sales Value (in Million USD), 2019 & 2024
- Figure 61: Indonesia: Single Cell Multiomics Market Forecast: Sales Value (in Million USD), 2025-2033
- Figure 62: Others: Single Cell Multiomics Market: Sales Value (in Million USD), 2019 & 2024
- Figure 63: Others: Single Cell Multiomics Market Forecast: Sales Value (in Million USD), 2025-2033
- Figure 64: Europe: Single Cell Multiomics Market: Sales Value (in Million USD), 2019 & 2024
- Figure 65: Europe: Single Cell Multiomics Market Forecast: Sales Value (in Million USD), 2025-2033
- Figure 66: Germany: Single Cell Multiomics Market: Sales Value (in Million USD), 2019 & 2024
- Figure 67: Germany: Single Cell Multiomics Market Forecast: Sales Value (in Million USD), 2025-2033
- Figure 68: France: Single Cell Multiomics Market: Sales Value (in Million USD), 2019 & 2024
- Figure 69: France: Single Cell Multiomics Market Forecast: Sales Value (in Million USD), 2025-2033
- Figure 70: United Kingdom: Single Cell Multiomics Market: Sales Value (in Million USD), 2019 & 2024
- Figure 71: United Kingdom: Single Cell Multiomics Market Forecast: Sales Value (in Million USD), 2025-2033
- Figure 72: Italy: Single Cell Multiomics Market: Sales Value (in Million USD), 2019 & 2024
- Figure 73: Italy: Single Cell Multiomics Market Forecast: Sales Value (in Million USD), 2025-2033
- Figure 74: Spain: Single Cell Multiomics Market: Sales Value (in Million USD), 2019 & 2024
- Figure 75: Spain: Single Cell Multiomics Market Forecast: Sales Value (in Million USD), 2025-2033
- Figure 76: Russia: Single Cell Multiomics Market: Sales Value (in Million USD), 2019 & 2024
- Figure 77: Russia: Single Cell Multiomics Market Forecast: Sales Value (in Million USD), 2025-2033
- Figure 78: Others: Single Cell Multiomics Market: Sales Value (in Million USD), 2019 & 2024
- Figure 79: Others: Single Cell Multiomics Market Forecast: Sales Value (in Million USD), 2025-2033
- Figure 80: Latin America: Single Cell Multiomics Market: Sales Value (in Million USD), 2019 & 2024
- Figure 81: Latin America: Single Cell Multiomics Market Forecast: Sales Value (in Million USD), 2025-2033
- Figure 82: Brazil: Single Cell Multiomics Market: Sales Value (in Million USD), 2019 & 2024
- Figure 83: Brazil: Single Cell Multiomics Market Forecast: Sales Value (in Million USD), 2025-2033
- Figure 84: Mexico: Single Cell Multiomics Market: Sales Value (in Million USD), 2019 & 2024
- Figure 85: Mexico: Single Cell Multiomics Market Forecast: Sales Value (in Million USD), 2025-2033
- Figure 86: Others: Single Cell Multiomics Market: Sales Value (in Million USD), 2019 & 2024
- Figure 87: Others: Single Cell Multiomics Market Forecast: Sales Value (in Million USD), 2025-2033
- Figure 88: Middle East and Africa: Single Cell Multiomics Market: Sales Value (in Million USD), 2019 & 2024
- Figure 89: Middle East and Africa: Single Cell Multiomics Market: Breakup by Country (in %), 2024
- Figure 90: Middle East and Africa: Single Cell Multiomics Market Forecast: Sales Value (in Million USD), 2025-2033
- Figure 91: Global: Single Cell Multiomics Industry: SWOT Analysis
- Figure 92: Global: Single Cell Multiomics Industry: Value Chain Analysis
- Figure 93: Global: Single Cell Multiomics Industry: Porter's Five Forces Analysis
List of Tables
- Table 1: Global: Single Cell Multiomics Market: Key Industry Highlights, 2024 and 2033
- Table 2: Global: Single Cell Multiomics Market Forecast: Breakup by Type (in Million USD), 2025-2033
- Table 3: Global: Single Cell Multiomics Market Forecast: Breakup by Product Type (in Million USD), 2025-2033
- Table 4: Global: Single Cell Multiomics Market Forecast: Breakup by Technique (in Million USD), 2025-2033
- Table 5: Global: Single Cell Multiomics Market Forecast: Breakup by Application (in Million USD), 2025-2033
- Table 6: Global: Single Cell Multiomics Market Forecast: Breakup by End User (in Million USD), 2025-2033
- Table 7: Global: Single Cell Multiomics Market Forecast: Breakup by Region (in Million USD), 2025-2033
- Table 8: Global: Single Cell Multiomics Market: Competitive Structure
- Table 9: Global: Single Cell Multiomics Market: Key Players
The global single cell multiomics market size reached USD 4.6 Billion in 2024. Looking forward, IMARC Group expects the market to reach USD 16.6 Billion by 2033, exhibiting a growth rate (CAGR) of 14.6% during 2025-2033.
Single cell multiomics refers to the analysis of multiple types of molecules from an individual cell to gain insights regarding cellular diversity and heterogenity. It involves single cell genomics, proteomics, transcriptomics and metabolomics and is widely used in neurology, immunology, cell biology and oncology. Single cell multiomics aids in enhancing the understanding of population architectures and cellular properties of heterogeneous tissues. It utilizes single cell isolation and dispensing techniques to provide images of the molecular layers and complex biological structures. In comparison to the traditionally used live-cell fluorescence imaging techniques, single-cell multi-omics does not involve the destruction of cells for analysis and can measure multiple types of the molecule from a single cell. As a result, it is widely used across biotechnology and pharmaceutical organizations, hospitals, academics and research institutes and diagnostic laboratories.
Single Cell Multiomics Market Trends:
The rising prevalence of chronic diseases, such as cancer and communicable viral diseases, is one of the key factors driving the growth of the market. Single cell multiomics provides a high-resolution landscape of cellular components in the tumors. Additionally, the widespread product adoption for visualization and analysis of cell heterogeneity, tumor micro-environment and antibody development are favoring the market growth. Moreover, various technological advancements, such as the development of single-cell isolation and barcoding technologies that enable deoxyribonucleic acid (DNA), messenger ribonucleic acid (mRNA) and protein profiles to be measured at a single-cell resolution, are providing a thrust to the market growth. In line with this, significant growth in the pharmaceutical industry is positively impacting the market growth. Other factors, including the increasing adoption of personalized medicine for the treatment of genetic disorders, along with the extensive improvements in the healthcare infrastructure, are anticipated to drive the market toward growth.
Key Market Segmentation:
Breakup by Type:
- Single Cell Genomics
- Single Cell Proteomics
- Single Cell Transcriptomics
- Single Cell Metabolomics
Breakup by Product Type:
- Consumables
- Instruments
- Software
Breakup by Technique:
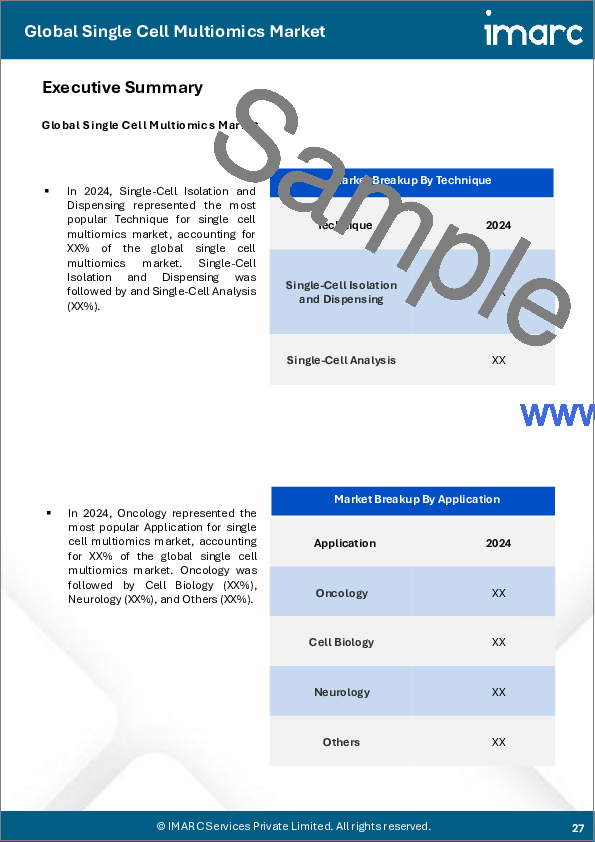
- Single-Cell Isolation and Dispensing
- Single-Cell Analysis
Breakup by Application:
- Oncology
- Cell Biology
- Neurology
- Others
Breakup by End User:
- Academic Institutes
- Contract Research Organizations
- Pharmaceutical and Biotech Companies
Breakup by Region:
- North America
- United States
- Canada
- Asia-Pacific
- China
- Japan
- India
- South Korea
- Australia
- Indonesia
- Others
- Europe
- Germany
- France
- United Kingdom
- Italy
- Spain
- Russia
- Others
- Latin America
- Brazil
- Mexico
- Others
- Middle East and Africa
Competitive Landscape:
The competitive landscape of the industry has also been examined along with the profiles of the key players being 10x Genomics Inc., Becton Dickinson and Company, BGI Genomics (BGI Group), Bio-RAD Laboratories Inc., Fluidigm Corporation, Illumina Inc., Mission Bio, NanoCellect Biomedical, Nanostring Technologies Inc., Proteona, Takara Bio Inc. (Takara Holdings) and Thermo Fisher Scientific Inc.
Key Questions Answered in This Report
- 1.What was the size of the global single cell multiomics market in 2024?
- 2.What is the expected growth rate of the global single cell multiomics market during 2025-2033?
- 3.What has been the impact of COVID-19 on the global single cell multiomics market?
- 4.What are the key factors driving the global single cell multiomics market?
- 5.What is the breakup of the global single cell multiomics market based on the type?
- 6.What is the breakup of the global single cell multiomics market based on the product type?
- 7.What is the breakup of the global single cell multiomics market based on the technique?
- 8.What is the breakup of the global single cell multiomics market based on the application?
- 9.What is the breakup of the global single cell multiomics market based on the end user?
- 10.What are the key regions in the global single cell multiomics market?
- 11.Who are the key players/companies in the global single cell multiomics market?
Table of Contents
1 Preface
2 Scope and Methodology
- 2.1 Objectives of the Study
- 2.2 Stakeholders
- 2.3 Data Sources
- 2.3.1 Primary Sources
- 2.3.2 Secondary Sources
- 2.4 Market Estimation
- 2.4.1 Bottom-Up Approach
- 2.4.2 Top-Down Approach
- 2.5 Forecasting Methodology
3 Executive Summary
4 Introduction
- 4.1 Overview
- 4.2 Key Industry Trends
5 Global Single Cell Multiomics Market
- 5.1 Market Overview
- 5.2 Market Performance
- 5.3 Impact of COVID-19
- 5.4 Market Forecast
6 Market Breakup by Type
- 6.1 Single Cell Genomics
- 6.1.1 Market Trends
- 6.1.2 Market Forecast
- 6.2 Single Cell Proteomics
- 6.2.1 Market Trends
- 6.2.2 Market Forecast
- 6.3 Single Cell Transcriptomics
- 6.3.1 Market Trends
- 6.3.2 Market Forecast
- 6.4 Single Cell Metabolomics
- 6.4.1 Market Trends
- 6.4.2 Market Forecast
7 Market Breakup by Product Type
- 7.1 Consumables
- 7.1.1 Market Trends
- 7.1.2 Market Forecast
- 7.2 Instruments
- 7.2.1 Market Trends
- 7.2.2 Market Forecast
- 7.3 Software
- 7.3.1 Market Trends
- 7.3.2 Market Forecast
8 Market Breakup by Technique
- 8.1 Single-Cell Isolation and Dispensing
- 8.1.1 Market Trends
- 8.1.2 Market Forecast
- 8.2 Single-Cell Analysis
- 8.2.1 Market Trends
- 8.2.2 Market Forecast
9 Market Breakup by Application
- 9.1 Oncology
- 9.1.1 Market Trends
- 9.1.2 Market Forecast
- 9.2 Cell Biology
- 9.2.1 Market Trends
- 9.2.2 Market Forecast
- 9.3 Neurology
- 9.3.1 Market Trends
- 9.3.2 Market Forecast
- 9.4 Others
- 9.4.1 Market Trends
- 9.4.2 Market Forecast
10 Market Breakup by End User
- 10.1 Academic Institutes
- 10.1.1 Market Trends
- 10.1.2 Market Forecast
- 10.2 Contract Research Organizations
- 10.2.1 Market Trends
- 10.2.2 Market Forecast
- 10.3 Pharmaceutical and Biotech Companies
- 10.3.1 Market Trends
- 10.3.2 Market Forecast
11 Market Breakup by Region
- 11.1 North America
- 11.1.1 United States
- 11.1.1.1 Market Trends
- 11.1.1.2 Market Forecast
- 11.1.2 Canada
- 11.1.2.1 Market Trends
- 11.1.2.2 Market Forecast
- 11.1.1 United States
- 11.2 Asia-Pacific
- 11.2.1 China
- 11.2.1.1 Market Trends
- 11.2.1.2 Market Forecast
- 11.2.2 Japan
- 11.2.2.1 Market Trends
- 11.2.2.2 Market Forecast
- 11.2.3 India
- 11.2.3.1 Market Trends
- 11.2.3.2 Market Forecast
- 11.2.4 South Korea
- 11.2.4.1 Market Trends
- 11.2.4.2 Market Forecast
- 11.2.5 Australia
- 11.2.5.1 Market Trends
- 11.2.5.2 Market Forecast
- 11.2.6 Indonesia
- 11.2.6.1 Market Trends
- 11.2.6.2 Market Forecast
- 11.2.7 Others
- 11.2.7.1 Market Trends
- 11.2.7.2 Market Forecast
- 11.2.1 China
- 11.3 Europe
- 11.3.1 Germany
- 11.3.1.1 Market Trends
- 11.3.1.2 Market Forecast
- 11.3.2 France
- 11.3.2.1 Market Trends
- 11.3.2.2 Market Forecast
- 11.3.3 United Kingdom
- 11.3.3.1 Market Trends
- 11.3.3.2 Market Forecast
- 11.3.4 Italy
- 11.3.4.1 Market Trends
- 11.3.4.2 Market Forecast
- 11.3.5 Spain
- 11.3.5.1 Market Trends
- 11.3.5.2 Market Forecast
- 11.3.6 Russia
- 11.3.6.1 Market Trends
- 11.3.6.2 Market Forecast
- 11.3.7 Others
- 11.3.7.1 Market Trends
- 11.3.7.2 Market Forecast
- 11.3.1 Germany
- 11.4 Latin America
- 11.4.1 Brazil
- 11.4.1.1 Market Trends
- 11.4.1.2 Market Forecast
- 11.4.2 Mexico
- 11.4.2.1 Market Trends
- 11.4.2.2 Market Forecast
- 11.4.3 Others
- 11.4.3.1 Market Trends
- 11.4.3.2 Market Forecast
- 11.4.1 Brazil
- 11.5 Middle East and Africa
- 11.5.1 Market Trends
- 11.5.2 Market Breakup by Country
- 11.5.3 Market Forecast
12 SWOT Analysis
- 12.1 Overview
- 12.2 Strengths
- 12.3 Weaknesses
- 12.4 Opportunities
- 12.5 Threats
13 Value Chain Analysis
14 Porters Five Forces Analysis
- 14.1 Overview
- 14.2 Bargaining Power of Buyers
- 14.3 Bargaining Power of Suppliers
- 14.4 Degree of Competition
- 14.5 Threat of New Entrants
- 14.6 Threat of Substitutes
15 Price Analysis
16 Competitive Landscape
- 16.1 Market Structure
- 16.2 Key Players
- 16.3 Profiles of Key Players
- 16.3.1 10x Genomics Inc.
- 16.3.1.1 Company Overview
- 16.3.1.2 Product Portfolio
- 16.3.1.3 Financials
- 16.3.2 Becton Dickinson and Company
- 16.3.2.1 Company Overview
- 16.3.2.2 Product Portfolio
- 16.3.2.3 Financials
- 16.3.2.4 SWOT Analysis
- 16.3.3 BGI Genomics (BGI Group)
- 16.3.3.1 Company Overview
- 16.3.3.2 Product Portfolio
- 16.3.3.3 Financials
- 16.3.4 Bio-RAD Laboratories Inc.
- 16.3.4.1 Company Overview
- 16.3.4.2 Product Portfolio
- 16.3.4.3 Financials
- 16.3.4.4 SWOT Analysis
- 16.3.5 Fluidigm Corporation
- 16.3.5.1 Company Overview
- 16.3.5.2 Product Portfolio
- 16.3.5.3 Financials
- 16.3.6 Illumina Inc.
- 16.3.6.1 Company Overview
- 16.3.6.2 Product Portfolio
- 16.3.6.3 Financials
- 16.3.6.4 SWOT Analysis
- 16.3.7 Mission Bio
- 16.3.7.1 Company Overview
- 16.3.7.2 Product Portfolio
- 16.3.8 NanoCellect Biomedical
- 16.3.8.1 Company Overview
- 16.3.8.2 Product Portfolio
- 16.3.9 Nanostring Technologies Inc.
- 16.3.9.1 Company Overview
- 16.3.9.2 Product Portfolio
- 16.3.9.3 Financials
- 16.3.10 Proteona
- 16.3.10.1 Company Overview
- 16.3.10.2 Product Portfolio
- 16.3.11 Takara Bio Inc. (Takara Holdings)
- 16.3.11.1 Company Overview
- 16.3.11.2 Product Portfolio
- 16.3.11.3 Financials
- 16.3.12 Thermo Fisher Scientific Inc.
- 16.3.12.1 Company Overview
- 16.3.12.2 Product Portfolio
- 16.3.12.3 Financials
- 16.3.12.4 SWOT Analysis
- 16.3.1 10x Genomics Inc.

