|
|
市場調査レポート
商品コード
1790215
界面活性剤の市場規模、シェア、動向分析レポート:供給源別、製品別、用途別、地域別、セグメント予測、2025年~2033年Surfactants Market Size, Share & Trends Analysis Report By Source, By Product, By Application, By Region, And Segment Forecasts, 2025 - 2033 |
||||||

|
|||||||
カスタマイズ可能
|
|||||||

| 界面活性剤の市場規模、シェア、動向分析レポート:供給源別、製品別、用途別、地域別、セグメント予測、2025年~2033年 |
|
出版日: 2025年07月29日
発行: Grand View Research
ページ情報: 英文 80 Pages
納期: 2~10営業日
|

全表示
- 概要
- 図表
- 目次
界面活性剤市場の概要
界面活性剤の世界市場規模は、2024年に451億9,940万米ドルと推定され、2033年には717億4,870万米ドルに達すると予測され、2025~2033年のCAGRは5.3%で成長すると予測されています。界面活性剤に対する世界の嗜好は、様々な産業における役割の拡大と、サステイナブルプラクティスに対する消費者の意識の高まりによって大きく形成されています。
再生可能エネルギー技術とエコフレンドリー製品配合の用途拡大。消費者と政府が持続可能性を推進する中、再生可能資源に由来するバイオベース界面活性剤の需要が大幅に伸びています。これらのエコフレンドリー代替品は、環境的に安全であるだけでなく、サステイナブル製造と製品の安全性に関する世界の規制基準に合致しているため、産業がその使用へとシフトする強い誘因となっています。
界面活性剤の需要を促進するもう一つの大きな要因は、パーソナルケア、医薬品、化学品などの産業において界面活性剤が不可欠な役割を果たしていることです。これらのセグメントでは、界面活性剤は乳化、起泡、分散プロセスにおいて重要な役割を果たし、製品の性能と安定性を高めています。特にパーソナルケア産業では、衛生や身だしなみを重視する消費者の増加により、シャンプー、洗顔料、ローションなどの界面活性剤ベース製品に対する需要が急増しています。産業用と施設用の洗浄用途が拡大し、界面活性剤市場がさらに拡大しています。これは、企業が衛生・安全基準を満たすために効率的で準拠性の高い製剤を求めているためです。
ヘルスケア、接客業、小売業、教育などの産業も、清潔さと衛生を重視するため、界面活性剤の消費拡大に貢献しています。人と直接触れ合う環境では、清潔さは譲れないため、油分、汚れ、微生物を効果的に分解する能力を持つ界面活性剤は、洗浄液に欠かせないものとなっています。このような広範な用途に加え、生分解性と高性能の配合に対する需要の高まりが、競争的でありながら機会の豊富な市場を生み出しています。大手メーカーが技術革新とサステイナブル化学への投資を続けているため、世界の界面活性剤市場は、産業上の必要性と環境への責任の両方によって力強い成長軌道を維持すると予想されます。
目次
第1章 調査手法と範囲
第2章 エグゼクティブサマリー
第3章 界面活性剤市場の変数、動向、範囲
- 市場系統の展望
- 界面活性剤市場の展望
- 産業バリューチェーン分析
- 原料の展望
- 製造業の動向
- 流通チャネル分析
- 価格動向分析、2018~2033年
- 市場力学
- 市場促進要因分析
- 市場抑制要因分析
- 産業の課題
- 産業の機会
- 産業分析ツール
- ポーターのファイブフォース分析
- マクロ環境分析
第4章 界面活性剤市場:供給源別、推定・動向分析
- 供給源変動分析と市場シェア、2024年と2033年
- 合成
- バイオベース
第5章 界面活性剤市場:製品別、推定・動向分析
- 製品変動分析と市場シェア、2024年と2033年
- 非イオン界面活性剤
- 両性界面活性剤
第6章 界面活性剤市場:用途別、推定・動向分析
- 用途変動分析と市場シェア、2024年と2033年
- 在宅医療
- パーソナルケア
- I&Iクリーナー
- 食品加工
- 油田化学品
- 農業用化学品
- 繊維
- エマルジョンポリマー
- 塗料とコーティング
- 建設
- その他
第7章 界面活性剤市場:地域別、推定・動向分析
- 地域変動分析と市場シェア、2023年と2033年
- 北米
- 北米の界面活性剤、推定・予測、2018~2033年
- 米国
- カナダ
- メキシコ
- 欧州
- 欧州の界面活性剤、推定・予測、2018~2033年
- ドイツ
- 英国
- フランス
- イタリア
- スペイン
- アジア太平洋
- アジア太平洋の界面活性剤、推定・予測、2018~2033年
- 中国
- インド
- 日本
- 韓国
- ラテンアメリカ
- ラテンアメリカの界面活性剤、推定・予測、2018~2033年
- ブラジル
- アルゼンチン
- 中東・アフリカ
- サウジアラビア
- 南アフリカ
第8章 界面活性剤市場-競合情勢
- 主要市場参入企業による最近の動向と影響分析
- 企業分類
- 2024年の企業市場シェア/ポジション分析
- 企業ヒートマップ分析
- Regional Market Analysis
- 戦略マッピング
- 企業プロファイル
- Akzonobel NV
- BASF SE
- Evonik Industries AG
- Solvay SA
- Clariant AG
- Huntsman International LLC
- Dow
- Kao Corporation
- Henkel Adhesives Technologies India Private Limited
- Bayer AG
- Godrej Industries Limited
- Stepan Company
List of Tables
- Table 1 List of Potential End-Users
- Table 2 Regulatory Framework, by Regions
- Table 3 List of Raw Material Suppliers
- Table 4 U.S. Macroeconomic Outlay
- Table 5 Canada Macroeconomic Outlay
- Table 6 Mexico Macroeconomic Outlay
- Table 7 Germany Macroeconomic Outlay
- Table 8 UK Macroeconomic Outlay
- Table 9 France Macroeconomic Outlay
- Table 10 Italy Macroeconomic Outlay
- Table 11 Spain Macroeconomic Outlay
- Table 13 China Macroeconomic Outlay
- Table 14 India Macroeconomic Outlay
- Table 15 Japan Macroeconomic Outlay
- Table 16 South Korea Macroeconomic Outlay
- Table 17 Brazil Macroeconomic Outlay
- Table 18 Argentina Macroeconomic Outlay
- Table 19 Saudi Arabia Macroeconomic Outlay
- Table 20 South Africa Macroeconomic Outlay
- Table 21 Participant's Overview
- Table 22 Financial Performance
- Table 23 Product Benchmarking
- Table 24 Company Heat Map Analysis
- Table 25 Key Strategy Mapping
List of Figures
- Fig. 1 Surfactants Market Segmentation
- Fig. 2 Information Procurement
- Fig. 3 Data Analysis Models
- Fig. 4 Data Validating & Publishing
- Fig. 5 Surfactants Market Snapshot
- Fig. 6 Surfactants Market Segmental Outlook, 2024 (Kilotons) (USD Million)
- Fig. 7 Surfactants Market: Competitive Insights
- Fig. 8 Global Surfactants Market, 2024 (Kilotons) (USD Million)
- Fig. 9 Global Surfactants Market Value Chain Analysis
- Fig. 10 Surfactants Market Dynamics
- Fig. 11 Surfactants Market: Porter's Analysis
- Fig. 12 Surfactants Market: Pestel Analysis
- Fig. 13 Surfactants Market Analysis & Segment Forecast, By Source, 2018 - 2033 (Kilotons) (USD Million)
- Fig. 14 Synthetic Surfactants Market Estimates & Forecast, 2018 - 2033 (Kilotons) (USD Million)
- Fig. 15 Biobased Surfactants Market Estimates & Forecasts, 2018 - 2033 (Kilotons) (USD Million)
- Fig. 16 Surfactants Market Analysis & Segment Forecast, By Product, 2018 - 2033 (Kilotons) (USD Million)
- Fig. 17 Non-Ionic Surfactants Market Estimates & Forecast, 2018 - 2033 (Kilotons) (USD Million)
- Fig. 18 Alcohol Ethoxylates Market Estimates & Forecast, 2018 - 2033 (Kilotons) (USD Million)
- Fig. 19 Fatty Alcohol Ethoxylates Market Estimates & Forecast, 2018 - 2033 (Kilotons) (USD Million)
- Fig. 20 Lauryl Alcohol Ethoxylates Market Estimates & Forecast, 2018 - 2033 (Kilotons) (USD Million)
- Fig. 21 Ceto Stearyl Alcohol Ethoxylates Market Estimates & Forecast, 2018 - 2033 (Kilotons) (USD Million)
- Fig. 22 Behenyl Alcohol Ethoxylate Market Estimates & Forecast, 2018 - 2033 (Kilotons) (USD Million)
- Fig. 23 Other Alcohol EthoxylatesMarket Estimates & Forecast, 2018 - 2033 (Kilotons) (USD Million)
- Fig. 24 Alkyl Phenol Ethoxylates Market Estimates & Forecast, 2018 - 2033 (Kilotons) (USD Million)
- Fig. 25 Fatty Acid Esters Market Estimates & Forecast, 2018 - 2033 (Kilotons) (USD Million)
- Fig. 26 Fatty Amine Ethoxylates Market Estimates & Forecast, 2018 - 2033 (Kilotons) (USD Million)
- Fig. 27 (EO-PO) Co-ethoxylates Market Estimates & Forecast, 2018 T- 2033 (Kilotons) (USD Million)
- Fig. 28 Other Non-Ionic Surfactants Market Estimates & Forecast, 2018 - 2033 (Kilotons) (USD Million)
- Fig. 29 Amphoteric Surfactants Market Estimates & Forecasts, 2018 - 2033 (Kilotons) (USD Million)
- Fig. 30 Surfactants Market Analysis & Segment Forecast, By Application, 2018 - 2033 (Kilotons) (USD Million)
- Fig. 31 Homecare Surfactants Market Estimates & Forecast, 2018 - 2033 (Kilotons) (USD Million)
- Fig. 32 Personal Care Surfactants Market Estimates & Forecast, 2018 - 2033 (Kilotons) (USD Million)
- Fig. 33 I&I Cleaners Surfactants Market Estimates & Forecast, 2018 - 2033 (Kilotons) (USD Million)
- Fig. 34 Food Processing Surfactants Market Estimates & Forecast, 2018 - 2033 (Kilotons) (USD Million)
- Fig. 35 Oilfield Chemicals Surfactants Market Estimates & Forecast, 2018 - 2033 (Kilotons) (USD Million)
- Fig. 36 Agriculture Surfactants Market Estimates & Forecast, 2018 - 2033 (Kilotons) (USD Million)
- Fig. 37 Textiles Surfactants Market Estimates & Forecast, 2018 - 2033 (Kilotons) (USD Million)
- Fig. 38 Emulsion Polymers Surfactants Market Estimates & Forecast, 2018 - 2033 (Kilotons) (USD Million)
- Fig. 39 Paints & Coatings Surfactants Market Estimates & Forecast, 2018 - 2033 (Kilotons) (USD Million)
- Fig. 40 Construction Surfactants Market Estimates & Forecast, 2018 - 2033 (Kilotons) (USD Million)
- Fig. 41 Other Application Surfactants Market Estimates & Forecast, 2018 - 2033 (Kilotons) (USD Million)
- Fig. 42 Surfactants Market Analysis & Segment Forecast, By Region, 2018 - 2033 (Kilotons) (USD Million)
- Fig. 43 North America Surfactants Market Analysis & Segment Forecast, 2018 - 2033 (Kilotons) (USD Million)
- Fig. 44 U.S. Surfactants Market Analysis & Segment Forecast, 2018 - 2033 (Kilotons) (USD Million)
- Fig. 45 Canada Surfactants Market Analysis & Segment Forecast, 2018 - 2033 (Kilotons) (USD Million)
- Fig. 46 Mexico Surfactants Market Analysis & Segment Forecast, 2018 - 2033 (Kilotons) (USD Million)
- Fig. 47 Europe Surfactants Market Analysis & Segment Forecast, 2018 - 2033 (Kilotons) (USD Million)
- Fig. 48 Germany Surfactants Market Analysis & Segment Forecast, 2018 - 2033 (Kilotons) (USD Million)
- Fig. 49 UK Surfactants Market Analysis & Segment Forecast, 2018 - 2033 (Kilotons) (USD Million)
- Fig. 50 France Surfactants Market Analysis & Segment Forecast, 2018 - 2033 (Kilotons) (USD Million)
- Fig. 51 Italy Surfactants Market Analysis & Segment Forecast, 2018 - 2033 (Kilotons) (USD Million)
- Fig. 52 Spain Surfactants Market Analysis & Segment Forecast, 2018 - 2033 (Kilotons) (USD Million)
- Fig. 53 Asia Pacific Surfactants Market Analysis & Segment Forecast, 2018 - 2033 (Kilotons) (USD Million)
- Fig. 54 China Surfactants Market Analysis & Segment Forecast, 2018 - 2033 (Kilotons) (USD Million)
- Fig. 55 India Surfactants Market Analysis & Segment Forecast, 2018 - 2033 (Kilotons) (USD Million)
- Fig. 56 Japan Surfactants Market Analysis & Segment Forecast, 2018 - 2033 (Kilotons) (USD Million)
- Fig. 57 South Korea Surfactants Market Analysis & Segment Forecast, 2018 - 2033 (Kilotons) (USD Million)
- Fig. 58 Latin America Surfactants Market Analysis & Segment Forecast, 2018 - 2033 (Kilotons) (USD Million)
- Fig. 59 Brazil Surfactants Market Analysis & Segment Forecast, 2018 - 2033 (Kilotons) (USD Million)
- Fig. 60 Argentina Surfactants Market Analysis & Segment Forecast, 2018 - 2033 (Kilotons) (USD Million)
- Fig. 61 Middle East & Africa Surfactants Market Analysis & Segment Forecast, 2018 - 2033 (Kilotons) (USD Million)
- Fig. 62 Saudi Arabia Surfactants Market Analysis & Segment Forecast, 2018 - 2033 (Kilotons) (USD Million)
- Fig. 63 South Africa Surfactants Market Analysis & Segment Forecast, 2018 - 2033 (Kilotons) (USD Million)
- Fig. 64 Surfactants Market: Company Categorization
- Fig. 65 Surfactants Market: Company Market Share Analysis
- Fig. 66 Surfactants Market: Company Market Positioning Analysis
- Fig. 67 Surfactants Market: Strategy Mapping
Surfactants Market Summary
The global surfactants market size was estimated at USD 45,199.4 million in 2024 and is projected to reach USD 71748.70 million by 2033, growing at a CAGR of 5.3% from 2025 to 2033. The global preference for surfactants is being significantly shaped by their expanding role across various industries and rising consumer awareness of sustainable practices.
Increasing application of renewable energy technologies and eco-friendly product formulations. As consumers and governments push for sustainability, the demand for bio-based surfactants, derived from renewable resources, has grown substantially. These green alternatives are not only environmentally safe but also align with global regulatory standards for sustainable manufacturing and product safety, creating strong incentives for industries to shift toward their usage.
Another major factor propelling surfactant demand is their indispensable role in industries such as personal care, pharmaceuticals, and chemicals. In these sectors, surfactants act as critical components in emulsification, foaming, and dispersing processes, enhancing product performance and stability. The personal care industry, in particular, has seen a surge in demand for surfactant-based products like shampoos, face cleansers, and lotions, driven by increasing consumer focus on hygiene and grooming. Industrial and institutional cleaning applications have grown, further expanding the surfactants market, as companies seek efficient and compliant formulations to meet hygiene and safety standards.
Industries such as healthcare, hospitality, retail, and education have also contributed to the growing consumption of surfactants due to their emphasis on cleanliness and sanitation. In settings with direct human interaction, cleanliness is non-negotiable, making surfactants crucial in cleaning solutions for their ability to break down oils, dirt, and microbes effectively. This widespread applicability, combined with mounting demand for biodegradable and high-performance formulations, has created a competitive yet opportunity-rich market. As leading manufacturers continue to invest in innovation and sustainable chemistry, the global surfactants market is expected to maintain a strong growth trajectory driven by both industrial necessity and environmental responsibility.
Global Surfactants Market Report Segmentation
This report forecasts revenue growth at the global, regional, and country levels and provides an analysis of the latest industry trends in each of the sub-segments from 2018 to 2033. For this study, Grand View Research has segmented the global surfactants market report based on source, product, application, and region:
- Source Outlook (Volume, Kilotons; Revenue, USD Million, 2018 - 2033)
- Synthetic
- Biobased
- Product Outlook (Volume, Kilotons; Revenue, USD Million, 2018 - 2033)
- Non-Ionic Surfactants
- Alcohol Ethoxylates
- Fatty Alcohol Ethoxylates
- Lauryl Alcohol Ethoxylates
- Ceto Stearyl Alcohol Ethoxylates
- Behenyl Alcohol Ethoxylate
- Other Alcohol Ethoxylates
- Alkyl Phenol Ethoxylates
- Fatty Acid Esters
- Fatty Amine Ethoxylates
- (EO-PO) co-ethoxylates
- Other Non-Ionic Surfactants
- Amphoteric Surfactants
- Others
- Application Outlook (Volume, Kilotons; Revenue, USD Million, 2018 - 2033)
- Homecare
- Personal Care
- I&I Cleaners
- Food Processing
- Oilfield Chemicals
- Agriculture Chemicals
- Textiles
- Emulsion Polymers
- Paints & Coatings
- Construction
- Other Application
- Regional Outlook (Volume, Kilotons; Revenue, USD Million, 2018 - 2033)
- North America
- U.S.
- Canada
- Mexico
- Europe
- Germany
- UK
- France
- Italy
- Spain
- Asia Pacific
- China
- India
- Japan
- South Korea
- Latin America
- Brazil
- Argentina
- Middle East & Africa
- Saudi Arabia
- South Africa
Table of Contents
Chapter 1. Methodology And Scope
- 1.1. Market Segmentation & Scope
- 1.2. Market Definition
- 1.3. Information Procurement
- 1.3.1. Purchased Database
- 1.3.2. GVR's Internal Database
- 1.3.3. Secondary Sources & Third-Party Perspectives
- 1.3.4. Primary Research
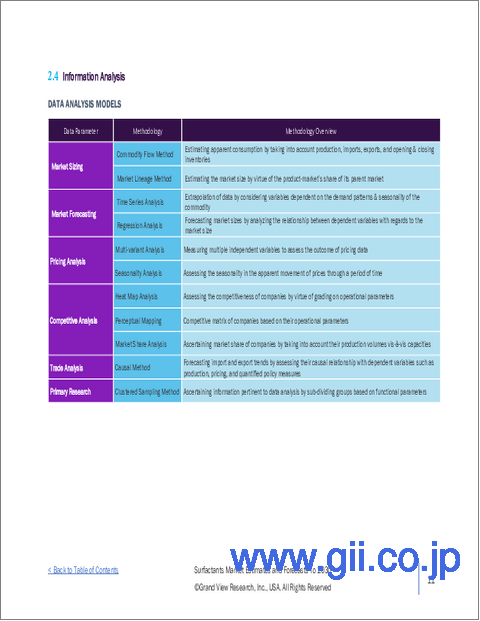
- 1.4. Information Analysis
- 1.4.1. Data Analysis Models
- 1.5. Market Formulation & Data Visualization
- 1.6. Data Validation & Publishing
Chapter 2. Executive Summary
- 2.1. Market Snapshot
- 2.2. Segment Snapshot
- 2.3. Competitive Landscape Snapshot
Chapter 3. Surfactants Market Variables, Trends & Scope
- 3.1. Market Lineage Outlook
- 3.1.1. Surfactants Market Outlook
- 3.2. Industry Value Chain Analysis
- 3.2.1. Raw Material Outlook
- 3.2.2. Manufacturing Trends
- 3.2.3. Sales Channel Analysis
- 3.3. Price Trend Analysis, 2018-2033
- 3.4. Market Dynamics
- 3.4.1. Market Driver Analysis
- 3.4.2. Market Restraint Analysis
- 3.4.3. Industry Challenges
- 3.4.4. Industry Opportunities
- 3.5. Industry Analysis Tools
- 3.5.1. Porter's Five Forces Analysis
- 3.5.2. Macro-Environmental Analysis
Chapter 4. Surfactants Market: Source Estimates & Trend Analysis
- 4.1. Source Movement Analysis & Market Share, 2024 & 2033
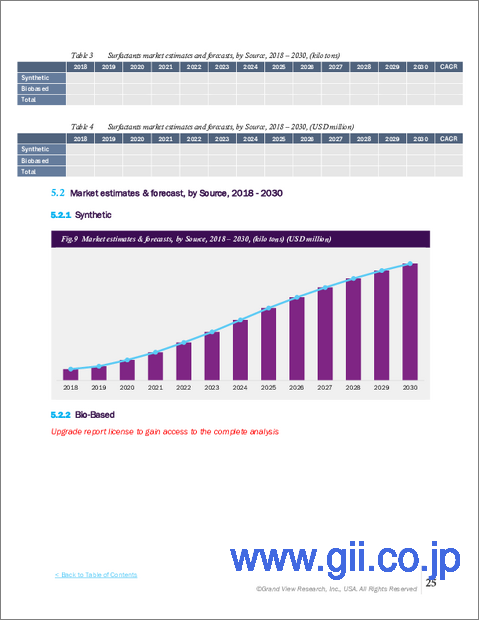
- 4.2. Synthetic
- 4.2.1. Synthetic Surfactants Market Estimates & Forecast, 2018 To 2033 (Kilotons) (USD Million)
- 4.3. Biobased
- 4.3.1. Biobased Surfactants Market Estimates & Forecasts, 2018 - 2033 (Kilotons) (USD Million)
Chapter 5. Surfactants Market: Product Estimates & Trend Analysis
- 5.1. Product Movement Analysis & Market Share, 2024 & 2033
- 5.2. Non-Ionic Surfactants
- 5.2.1. Non-Ionic Surfactants Market Estimates & Forecast, 2018 To 2033 (Kilotons) (USD Million)
- 5.2.2. Alcohol Ethoxylates Market Estimates & Forecast, 2018 To 2033 (Kilotons) (USD Million)
- 5.2.2.1. Fatty Alcohol Ethoxylates Market Estimates & Forecast, 2018 To 2033 (Kilotons) (USD Million)
- 5.2.2.2. Lauryl Alcohol Ethoxylates Market Estimates & Forecast, 2018 To 2033 (Kilotons) (USD Million)
- 5.2.2.3. Ceto Stearyl Alcohol Ethoxylates Market Estimates & Forecast, 2018 To 2033 (Kilotons) (USD Million)
- 5.2.2.4. Behenyl Alcohol Ethoxylate Market Estimates & Forecast, 2018 To 2033 (Kilotons) (USD Million)
- 5.2.2.5. Other Alcohol Ethoxylates Market Estimates & Forecast, 2018 To 2033 (Kilotons) (USD Million)
- 5.2.3. Alkyl Phenol Ethoxylates Market Estimates & Forecast, 2018 To 2033 (Kilotons) (USD Million)
- 5.2.4. Fatty Acid Esters Market Estimates & Forecast, 2018 To 2033 (Kilotons) (USD Million)
- 5.2.5. Fatty Amine Ethoxylates Market Estimates & Forecast, 2018 To 2033 (Kilotons) (USD Million)
- 5.2.6. (EO-PO) Co-ethoxylates Market Estimates & Forecast, 2018 To 2033 (Kilotons) (USD Million)
- 5.2.7. Other Non-Ionic Surfactants Market Estimates & Forecast, 2018 To 2033 (Kilotons) (USD Million)
- 5.3. Amphoteric Surfactants
- 5.3.1. Amphoteric Surfactants Market Estimates & Forecasts, 2018 - 2033 (Kilotons) (USD Million)
Chapter 6. Surfactants Market: Application Estimates & Trend Analysis
- 6.1. Application Movement Analysis & Market Share, 2024 & 2033
- 6.2. Homecare
- 6.2.1. Homecare Surfactants Market Estimates & Forecast, 2018 To 2033 (Kilotons) (USD Million)
- 6.3. Personal Care
- 6.3.1. Personal Care Surfactants Market Estimates & Forecast, 2018 To 2033 (Kilotons) (USD Million)
- 6.4. I&I Cleaners
- 6.4.1. I&I Cleaners Surfactants Market Estimates & Forecast, 2018 To 2033 (Kilotons) (USD Million)
- 6.5. Food Processing
- 6.5.1. Food Processing Surfactants Market Estimates & Forecast, 2018 To 2033 (Kilotons) (USD Million)
- 6.6. Oilfield Chemicals
- 6.6.1. Oilfield Chemicals Surfactants Market Estimates & Forecast, 2018 To 2033 (Kilotons) (USD Million)
- 6.7. Agriculture Chemicals
- 6.7.1. Agriculture Surfactants Market Estimates & Forecast, 2018 To 2033 (Kilotons) (USD Million)
- 6.8. Textiles
- 6.8.1. Textiles Surfactants Market Estimates & Forecast, 2018 To 2033 (Kilotons) (USD Million)
- 6.9. Emulsion Polymers
- 6.9.1. Emulsion Polymers Surfactants Market Estimates & Forecast, 2018 To 2033 (Kilotons) (USD Million)
- 6.10. Paints & Coatings
- 6.10.1. Paints & Coatings Surfactants Market Estimates & Forecast, 2018 To 2033 (Kilotons) (USD Million)
- 6.11. Construction
- 6.11.1. Construction Surfactants Market Estimates & Forecast, 2018 To 2033 (Kilotons) (USD Million)
- 6.12. Other Application
- 6.12.1. Other Application Surfactants Market Estimates & Forecast, 2018 To 2033 (Kilotons) (USD Million)
Chapter 7. Surfactants Market: Regional Estimates & Trend Analysis
- 7.1. Regional Movement Analysis & Market Share, 2023 & 2033
- 7.2. North America
- 7.2.1. North America Surfactants Estimates & Forecast, 2018 - 2033 (Kilotons) (USD Million)
- 7.2.2. U.S.
- 7.2.2.1. Key Country Dynamics
- 7.2.2.2. U.S. Surfactants Market Estimates & Forecast, 2018 - 2033 (Kilotons) (USD Million)
- 7.2.3. Canada
- 7.2.3.1. Key Country Dynamics
- 7.2.3.2. Canada Surfactants Market Estimates & Forecast, 2018 - 2033 (Kilotons) (USD Million)
- 7.2.4. Mexico
- 7.2.4.1. Key Country Dynamics
- 7.2.4.2. Mexico Surfactants Market Estimates & Forecast, 2018 - 2033 (Kilotons) (USD Million)
- 7.3. Europe
- 7.3.1. Europe Surfactants Estimates & Forecast, 2018 - 2033 (Kilotons) (USD Million)
- 7.3.2. Germany
- 7.3.2.1. Key Country Dynamics
- 7.3.2.2. Germany Surfactants Market Estimates & Forecast, 2018 - 2033 (Kilotons) (USD Million)
- 7.3.3. UK
- 7.3.3.1. Key Country Dynamics
- 7.3.3.2. UK Surfactants Market Estimates & Forecast, 2018 - 2033 (Kilotons) (USD Million)
- 7.3.4. France
- 7.3.4.1. Key Country Dynamics
- 7.3.4.2. France Surfactants Market Estimates & Forecast, 2018 - 2033 (Kilotons) (USD Million)
- 7.3.5. Italy
- 7.3.5.1. Key Country Dynamics
- 7.3.5.2. Italy Surfactants Market Estimates & Forecast, 2018 - 2033 (Kilotons) (USD Million)
- 7.3.6. Spain
- 7.3.6.1. Key Country Dynamics
- 7.3.6.2. Spain Surfactants Market Estimates & Forecast, 2018 - 2033 (Kilotons) (USD Million)
- 7.4. Asia Pacific
- 7.4.1. Asia Pacific Surfactants Estimates & Forecast, 2018 - 2033 (Kilotons) (USD Million)
- 7.4.2. China
- 7.4.2.1. Key Country Dynamics
- 7.4.2.2. China Surfactants Market Estimates & Forecast, 2018 - 2033 (Kilotons) (USD Million)
- 7.4.3. India
- 7.4.3.1. Key Country Dynamics
- 7.4.3.2. India Surfactants Market Estimates & Forecast, 2018 - 2033 (Kilotons) (USD Million)
- 7.4.4. Japan
- 7.4.4.1. Key Country Dynamics
- 7.4.4.2. Japan Surfactants Market Estimates & Forecast, 2018 - 2033 (Kilotons) (USD Million)
- 7.4.5. South Korea
- 7.4.5.1. Key Country Dynamics
- 7.4.5.2. South Korea Surfactants Market Estimates & Forecast, 2018 - 2033 (Kilotons) (USD Million)
- 7.5. Latin America
- 7.5.1. Latin America Surfactants Estimates & Forecast, 2018 - 2033 (Kilotons) (USD Million)
- 7.5.2. Brazil
- 7.5.2.1. Key Country Dynamics
- 7.5.2.2. Brazil Surfactants Market Estimates & Forecast, 2018 - 2033 (Kilotons) (USD Million)
- 7.5.3. Argentina
- 7.5.3.1. Key Country Dynamics
- 7.5.3.2. Argentina Surfactants Market Estimates & Forecast, 2018 - 2033 (Kilotons) (USD Million)
- 7.6. Middle East & Africa
- 7.6.1. Middle East & Africa Surfactants Market Estimates & Forecast, 2018 - 2033 (Kilotons) (USD Million)
- 7.6.2. Saudi Arabia
- 7.6.2.1. Key Country Dynamics
- 7.6.2.2. Saudi Arabia Surfactants Market Estimates & Forecast, 2018 - 2033 (Kilotons) (USD Million)
- 7.6.3. South Africa
- 7.6.3.1. Key Country Dynamics
- 7.6.3.2. South Africa Surfactants Market Estimates & Forecast, 2018 - 2033 (Kilotons) (USD Million)
Chapter 8. Surfactants Market - Competitive Landscape
- 8.1. Recent Developments & Impact Analysis, By Key Market Participants
- 8.2. Company Categorization
- 8.3. Company Market Share/Position Analysis, 2024
- 8.4. Company Heat Map Analysis
- 8.5. Regional Market Analysis
- 8.6. Strategy Mapping
- 8.7. Company Profiles
- 8.7.1. Akzonobel N.V
- 8.7.1.1. Participant's Overview
- 8.7.1.2. Financial Performance
- 8.7.1.3. Product Benchmarking
- 8.7.1.4. Recent Developments
- 8.7.2. BASF SE
- 8.7.2.1. Participant's Overview
- 8.7.2.2. Financial Performance
- 8.7.2.3. Product Benchmarking
- 8.7.2.4. Recent Developments
- 8.7.3. Evonik Industries AG
- 8.7.3.1. Participant's Overview
- 8.7.3.2. Financial Performance
- 8.7.3.3. Product Benchmarking
- 8.7.3.4. Recent Developments
- 8.7.4. Solvay S.A
- 8.7.4.1. Participant's Overview
- 8.7.4.2. Financial Performance
- 8.7.4.3. Product Benchmarking
- 8.7.4.4. Recent Developments
- 8.7.5. Clariant AG
- 8.7.5.1. Participant's Overview
- 8.7.5.2. Financial Performance
- 8.7.5.3. Product Benchmarking
- 8.7.5.4. Recent Developments
- 8.7.6. Huntsman International LLC
- 8.7.6.1. Participant's Overview
- 8.7.6.2. Financial Performance
- 8.7.6.3. Product Benchmarking
- 8.7.6.4. Recent Developments
- 8.7.7. Dow
- 8.7.7.1. Participant's Overview
- 8.7.7.2. Financial Performance
- 8.7.7.3. Product Benchmarking
- 8.7.7.4. Recent Developments
- 8.7.8. Kao Corporation
- 8.7.8.1. Participant's Overview
- 8.7.8.2. Financial Performance
- 8.7.8.3. Product Benchmarking
- 8.7.8.4. Recent Developments
- 8.7.9. Henkel Adhesives Technologies India Private Limited
- 8.7.9.1. Participant's Overview
- 8.7.9.2. Financial Performance
- 8.7.9.3. Product Benchmarking
- 8.7.9.4. Recent Developments
- 8.7.10. Bayer AG
- 8.7.10.1. Participant's Overview
- 8.7.10.2. Financial Performance
- 8.7.10.3. Product Benchmarking
- 8.7.10.4. Recent Developments
- 8.7.11. Godrej Industries Limited
- 8.7.11.1. Participant's Overview
- 8.7.11.2. Financial Performance
- 8.7.11.3. Product Benchmarking
- 8.7.11.4. Recent Developments
- 8.7.12. Stepan Company
- 8.7.12.1. Participant's Overview
- 8.7.12.2. Financial Performance
- 8.7.12.3. Product Benchmarking
- 8.7.12.4. Recent Developments
- 8.7.1. Akzonobel N.V

