|
|
市場調査レポート
商品コード
1750639
データセンター液体冷却の世界市場規模、シェア、動向分析レポート:コンポーネント別、ソリューション別、サービス別、冷却タイプ別、データセンタータイプ別、最終用途別、地域別、セグメント別予測(2025年~2030年)Data Center Liquid Cooling Market Size, Share & Trends Analysis Report By Component, By Solution, By Service, By Type Of Cooling, By Data Center Type, By End-use, By Region, And Segment Forecasts, 2025 - 2030 |
||||||
|
|||||||
カスタマイズ可能
|
|||||||

| データセンター液体冷却の世界市場規模、シェア、動向分析レポート:コンポーネント別、ソリューション別、サービス別、冷却タイプ別、データセンタータイプ別、最終用途別、地域別、セグメント別予測(2025年~2030年) |
|
出版日: 2025年05月30日
発行: Grand View Research
ページ情報: 英文 120 Pages
納期: 2~10営業日
|

全表示
- 概要
- 図表
- 目次
データセンター液体冷却市場の概要
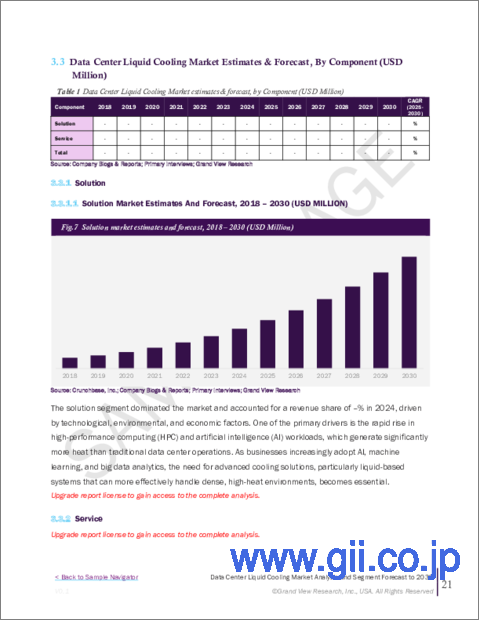
世界のデータセンター液体冷却の市場規模は、2024年に53億8,000万米ドルと推計され、2025年~2030年にCAGR21.6%で成長し、2030年には177億7,000万米ドルに達すると予測されています。この業界は、いくつかの主な要因によって大きな成長を遂げています。主な要因の1つは、エネルギー効率の高いソリューションに対する需要の高まりです。
世界的に生成されるデータ量が増加するにつれ、高密度に配置されたサーバーラックから発生する熱を管理する高度な冷却システムの必要性も高まっています。従来の空冷システムは効率の面で限界に達しており、多くのデータセンターが液体冷却ソリューションの採用に踏み切っています。液体は空気よりも効果的に熱を吸収・移動できるため、放熱性が高く、エネルギー消費量を削減できます。
もう1つの重要な要因は、ハイパフォーマンス・コンピューティング(HPC)用途や人工知能(AI)の利用が増加していることです。これらの用途は高い計算能力を必要とするため、かなりの熱が発生します。液体冷却システムは、このようなシステムの性能と信頼性を維持するために不可欠であり、HPCワークロード、機械学習モデル、AI駆動型用途をホストするデータセンターにとって魅力的な選択肢となっています。ヘルスケア、自動車、金融などの業界では、AI、機械学習、データ分析の需要が高まっており、高度な冷却方法に大きく依存する高密度サーバー環境の必要性が高まっています。
さらに、持続可能性への取り組みがデータセンター液体冷却業界に貢献しています。エネルギー消費が環境に与える影響に対する意識が高まる中、企業は二酸化炭素排出量を削減する方法を模索しています。液体冷却はエネルギー効率が高いため、従来の空冷システムよりも消費電力を抑えることができ、データセンターの持続可能な運用に貢献します。このシフトは、特に環境規制が厳しい地域において、様々な産業でグリーンテクノロジーを採用する広範な動向と一致しています。
例えば、米国エネルギー省(DOE)は2023年5月、データセンター向けの高性能でエネルギー効率の高い冷却ソリューションの開発を目的とした15のプロジェクトに対し、4,000万米ドルの資金提供を行うと発表しました。コンピューター、ストレージシステム、コンピューティングインフラを収容するデータセンターは現在、米国の総電力消費量の約2%を占めています。冷却システムだけで、これらの施設の総エネルギー使用量の最大40%を占めることもあります。今回の資金援助は、エネルギー消費を削減し、データセンターの持続可能性を高めることを目的としています。
液浸冷却やチップ直下冷却など、液体冷却技術の進歩も市場を牽引しています。これらの技術革新は、従来の冷却方法に伴うスペース要件やメンテナンスコストを最小限に抑えながら、熱伝達を最適化するように設計されています。これらの技術がコスト効率と拡張性を高めるにつれて、高性能ワークロードの進化する要求に応えるため、液体冷却ソリューションを採用するデータセンターが増えています。
目次
第1章 調査手法と範囲
第2章 エグゼクティブサマリー
第3章 データセンター液体冷却の変数、動向、範囲
- 市場イントロダクション/系統展望
- 業界バリューチェーン分析
- 市場力学
- 市場促進要因分析
- 市場抑制要因分析
- 業界の機会
- データセンター液体冷却の分析ツール
- ポーターの分析
- PESTEL分析
第4章 データセンター液体冷却市場:コンポーネントの推定・動向分析
- セグメントダッシュボード
- データセンター液体冷却:コンポーネントの変動分析、2024年・2030年
- ソリューション
- サービス
第5章 データセンター液体冷却市場:ソリューションの推定・動向分析
- セグメントダッシュボード
- データセンター液体冷却:ソリューションの変動分析、2024年・2030年
- 直接液体冷却
- 間接液体冷却
第6章 データセンター液体冷却市場:サービスの推定・動向分析
- セグメントダッシュボード
- データセンター液体冷却:サービスの変動分析、2024年・2030年
- 設計とコンサルティング
- インストールと展開
- メンテナンスとサポート
第7章 データセンター液体冷却市場:冷却タイプの推定・動向分析
- セグメントダッシュボード
- データセンター液体冷却:冷却タイプの変動分析、2024年・2030年
- 液浸冷却
- コールドプレート冷却
- スプレー液体冷却
第8章 データセンター液体冷却市場:データセンタータイプの推定・動向分析
- セグメントダッシュボード
- データセンター液体冷却:データセンタータイプの変動分析、2024年・2030年
- ハイパースケールデータセンター
- エンタープライズデータセンター
- コロケーションデータセンター
- エッジデータセンター
- 高性能コンピューティング(HPC)データセンター
第9章 データセンター液体冷却市場:最終用途の推定・動向分析
- セグメントダッシュボード
- データセンター液体冷却:最終用途の変動分析、2024年・2030年
- IT
- 通信
- ヘルスケア
- BFSI
- 小売・Eコマース
- エンターテインメントとメディア
- エネルギー
- その他
第10章 データセンター液体冷却市場:地域の推定・動向分析
- データセンター液体冷却シェア:地域別、2024年・2030年
- 北米
- コンポーネント別、2018年~2030年
- ソリューション別、2018年~2030年
- サービス別、2018年~2030年
- 冷却タイプ別、2018年~2030年
- データセンタータイプ別、2018年~2030年
- 最終用途別、2018年~2030年
- 米国
- カナダ
- メキシコ
- 欧州
- コンポーネント別、2018年~2030年
- ソリューション別、2018年~2030年
- サービス別、2018年~2030年
- 冷却タイプ別、2018年~2030年
- データセンタータイプ別、2018年~2030年
- 最終用途別、2018年~2030年
- 英国
- ドイツ
- フランス
- アジア太平洋
- コンポーネント別、2018年~2030年
- ソリューション別、2018年~2030年
- サービス別、2018年~2030年
- 冷却タイプ別、2018年~2030年
- データセンタータイプ別、2018年~2030年
- 最終用途別、2018年~2030年
- 中国
- インド
- 日本
- オーストラリア
- 韓国
- ラテンアメリカ
- コンポーネント別、2018年~2030年
- ソリューション別、2018年~2030年
- サービス別、2018年~2030年
- 冷却タイプ別、2018年~2030年
- データセンタータイプ別、2018年~2030年
- 最終用途別、2018年~2030年
- ブラジル
- 中東・アフリカ
- コンポーネント別、2018年~2030年
- ソリューション別、2018年~2030年
- サービス別、2018年~2030年
- 冷却タイプ別、2018年~2030年
- データセンタータイプ別、2018年~2030年
- 最終用途別、2018年~2030年
- サウジアラビア
- アラブ首長国連邦
- 南アフリカ
第11章 競合情勢
- 主要市場参入企業による最近の動向と影響分析
- 企業分類
- 企業の市場シェア分析
- 企業ヒートマップ分析
- 戦略マッピング
- 事業拡大
- 合併と買収
- パートナーシップとコラボレーション
- 新製品の発売
- 研究開発
- 企業プロファイル
- Alfa Laval
- Asetek, Inc.
- Asperitas
- COOLIT SYSTEMS
- Dell Inc.
- Fujitsu
- Hitachi, Ltd.
- Iceotope Technologies
- Lenovo Group Limited
- LiquidStack
- Mitsubishi Electric Corporation
- NTT Ltd.
- Schneider Electric
- STULZ GMBH
- Vertiv Group Corp.
List of Tables
- Table 1 List of Abbreviations
- Table 2 Global data center liquid cooling market, 2018 - 2030 (USD Billion)
- Table 3 Global data center liquid cooling market, by region, 2018 - 2030 (USD Billion)
- Table 4 Global data center liquid cooling market, by component, 2018 - 2030 (USD Billion)
- Table 5 Global data center liquid cooling market, by solution, 2018 - 2030 (USD Billion)
- Table 6 Global data center liquid cooling market, by service, 2018 - 2030 (USD Billion)
- Table 7 Global data center liquid cooling market, by type of cooling, 2018 - 2030 (USD Billion)
- Table 8 Global data center liquid cooling market, by data center type, 2018 - 2030 (USD Billion)
- Table 9 Global data center liquid cooling market, by end use, 2018 - 2030 (USD Billion)
- Table 10 Global direct liquid cooling market by region, 2018 - 2030 (USD Billion)
- Table 11 Global indirect liquid cooling market by region, 2018 - 2030 (USD Billion)
- Table 12 Global design and consulting market by region, 2018 - 2030 (USD Billion)
- Table 13 Global installation and deployment market by region, 2018 - 2030 (USD Billion)
- Table 14 Global maintenance and support market by region, 2018 - 2030 (USD Billion)
- Table 15 Global immersion cooling market by region, 2018 - 2030 (USD Billion)
- Table 16 Global cold plate cooling market by region, 2018 - 2030 (USD Billion)
- Table 17 Global spray liquid cooling market by region, 2018 - 2030 (USD Billion)
- Table 18 Global hyperscale data centers market by region, 2018 - 2030 (USD Billion)
- Table 19 Global enterprise data centers market by region, 2018 - 2030 (USD Billion)
- Table 20 Global colocation data centers market by region, 2018 - 2030 (USD Billion)
- Table 21 Global edge data centers market by region, 2018 - 2030 (USD Billion)
- Table 22 Global high-performance computing (HPC) data centers market by region, 2018 - 2030 (USD Billion)
- Table 23 Global IT market by region, 2018 - 2030 (USD Billion)
- Table 24 Global telecom market by region, 2018 - 2030 (USD Billion)
- Table 25 Global healthcare market by region, 2018 - 2030 (USD Billion)
- Table 26 Global BFSI market by region, 2018 - 2030 (USD Billion)
- Table 27 Global retail & e-commerce market by region, 2018 - 2030 (USD Billion)
- Table 28 Global entertainment & media market by region, 2018 - 2030 (USD Billion)
- Table 29 Global energy market by region, 2018 - 2030 (USD Billion)
- Table 30 Global others market by region, 2018 - 2030 (USD Billion)
- Table 31 North America data center liquid cooling market, by component 2018 - 2030 (USD Billion)
- Table 32 North America data center liquid cooling market, by solution 2018 - 2030 (USD Billion)
- Table 33 North America data center liquid cooling market, by service 2018 - 2030 (USD Billion)
- Table 34 North America data center liquid cooling market, by type of cooling 2018 - 2030 (USD Billion)
- Table 35 North America data center liquid cooling market, by data center type 2018 - 2030 (USD Billion)
- Table 36 North America data center liquid cooling market, by end use 2018 - 2030 (USD Billion)
- Table 37 U.S. data center liquid cooling market, by component 2018 - 2030 (USD Billion)
- Table 38 U.S. data center liquid cooling market, by solution 2018 - 2030 (USD Billion)
- Table 39 U.S. data center liquid cooling market, by service 2018 - 2030 (USD Billion)
- Table 40 U.S. data center liquid cooling market, by type of cooling 2018 - 2030 (USD Billion)
- Table 41 U.S. data center liquid cooling market, by data center type 2018 - 2030 (USD Billion)
- Table 42 U.S. data center liquid cooling market, by end use 2018 - 2030 (USD Billion)
- Table 43 Canada data center liquid cooling market, by component 2018 - 2030 (USD Billion)
- Table 44 Canada data center liquid cooling market, by solution 2018 - 2030 (USD Billion)
- Table 45 Canada data center liquid cooling market, by service 2018 - 2030 (USD Billion)
- Table 46 Canada data center liquid cooling market, by type of cooling 2018 - 2030 (USD Billion)
- Table 47 Canada data center liquid cooling market, by data center type 2018 - 2030 (USD Billion)
- Table 48 Canada data center liquid cooling market, by end use 2018 - 2030 (USD Billion)
- Table 49 Mexico data center liquid cooling market, by component 2018 - 2030 (USD Billion)
- Table 50 Mexico data center liquid cooling market, by solution 2018 - 2030 (USD Billion)
- Table 51 Mexico data center liquid cooling market, by service 2018 - 2030 (USD Billion)
- Table 52 Mexico data center liquid cooling market, by type of cooling 2018 - 2030 (USD Billion)
- Table 53 Mexico data center liquid cooling market, by data center type 2018 - 2030 (USD Billion)
- Table 54 Mexico data center liquid cooling market, by end use 2018 - 2030 (USD Billion)
- Table 55 Europe data center liquid cooling market, by component 2018 - 2030 (USD Billion)
- Table 56 Europe data center liquid cooling market, by solution 2018 - 2030 (USD Billion)
- Table 57 Europe data center liquid cooling market, by service 2018 - 2030 (USD Billion)
- Table 58 Europe data center liquid cooling market, by type of cooling 2018 - 2030 (USD Billion)
- Table 59 Europe data center liquid cooling market, by data center type 2018 - 2030 (USD Billion)
- Table 60 Europe data center liquid cooling market, by end use 2018 - 2030 (USD Billion)
- Table 61 UK data center liquid cooling market, by component 2018 - 2030 (USD Billion)
- Table 62 UK data center liquid cooling market, by solution 2018 - 2030 (USD Billion)
- Table 63 UK data center liquid cooling market, by service 2018 - 2030 (USD Billion)
- Table 64 UK data center liquid cooling market, by type of cooling 2018 - 2030 (USD Billion)
- Table 65 UK data center liquid cooling market, by data center type 2018 - 2030 (USD Billion)
- Table 66 UK data center liquid cooling market, by end use 2018 - 2030 (USD Billion)
- Table 67 Germany data center liquid cooling market, by component 2018 - 2030 (USD Billion)
- Table 68 Germany data center liquid cooling market, by solution 2018 - 2030 (USD Billion)
- Table 69 Germany data center liquid cooling market, by service 2018 - 2030 (USD Billion)
- Table 70 Germany data center liquid cooling market, by type of cooling 2018 - 2030 (USD Billion)
- Table 71 Germany data center liquid cooling market, by data center type 2018 - 2030 (USD Billion)
- Table 72 Germany data center liquid cooling market, by end use 2018 - 2030 (USD Billion)
- Table 73 France data center liquid cooling market, by component 2018 - 2030 (USD Billion)
- Table 74 France data center liquid cooling market, by solution 2018 - 2030 (USD Billion)
- Table 75 France data center liquid cooling market, by service 2018 - 2030 (USD Billion)
- Table 76 France data center liquid cooling market, by type of cooling 2018 - 2030 (USD Billion)
- Table 77 France data center liquid cooling market, by data center type 2018 - 2030 (USD Billion)
- Table 78 France data center liquid cooling market, by end use 2018 - 2030 (USD Billion)
- Table 79 Asia Pacific data center liquid cooling market, by component 2018 - 2030 (USD Billion)
- Table 80 Asia Pacific data center liquid cooling market, by solution 2018 - 2030 (USD Billion)
- Table 81 Asia Pacific data center liquid cooling market, by service 2018 - 2030 (USD Billion)
- Table 82 Asia Pacific data center liquid cooling market, by type of cooling 2018 - 2030 (USD Billion)
- Table 83 Asia Pacific data center liquid cooling market, by data center type 2018 - 2030 (USD Billion)
- Table 84 Asia Pacific data center liquid cooling market, by end use 2018 - 2030 (USD Billion)
- Table 85 China data center liquid cooling market, by component 2018 - 2030 (USD Billion)
- Table 86 China data center liquid cooling market, by solution 2018 - 2030 (USD Billion)
- Table 87 China data center liquid cooling market, by service 2018 - 2030 (USD Billion)
- Table 88 China data center liquid cooling market, by type of cooling 2018 - 2030 (USD Billion)
- Table 89 China data center liquid cooling market, by data center type 2018 - 2030 (USD Billion)
- Table 90 China data center liquid cooling market, by end use 2018 - 2030 (USD Billion)
- Table 91 India data center liquid cooling market, by component 2018 - 2030 (USD Billion)
- Table 92 India data center liquid cooling market, by solution 2018 - 2030 (USD Billion)
- Table 93 India data center liquid cooling market, by service 2018 - 2030 (USD Billion)
- Table 94 India data center liquid cooling market, by type of cooling 2018 - 2030 (USD Billion)
- Table 95 India data center liquid cooling market, by data center type 2018 - 2030 (USD Billion)
- Table 96 India data center liquid cooling market, by end use 2018 - 2030 (USD Billion)
- Table 97 Japan data center liquid cooling market, by component 2018 - 2030 (USD Billion)
- Table 98 Japan data center liquid cooling market, by solution 2018 - 2030 (USD Billion)
- Table 99 Japan data center liquid cooling market, by service 2018 - 2030 (USD Billion)
- Table 100 Japan data center liquid cooling market, by type of cooling 2018 - 2030 (USD Billion)
- Table 101 Japan data center liquid cooling market, by data center type 2018 - 2030 (USD Billion)
- Table 102 Japan data center liquid cooling market, by end use 2018 - 2030 (USD Billion)
- Table 103 Australia data center liquid cooling market, by component 2018 - 2030 (USD Billion)
- Table 104 Australia data center liquid cooling market, by solution 2018 - 2030 (USD Billion)
- Table 105 Australia data center liquid cooling market, by service 2018 - 2030 (USD Billion)
- Table 106 Australia data center liquid cooling market, by type of cooling 2018 - 2030 (USD Billion)
- Table 107 Australia data center liquid cooling market, by data center type 2018 - 2030 (USD Billion)
- Table 108 Australia data center liquid cooling market, by end use 2018 - 2030 (USD Billion)
- Table 109 South Korea data center liquid cooling market, by component 2018 - 2030 (USD Billion)
- Table 110 South Korea data center liquid cooling market, by solution 2018 - 2030 (USD Billion)
- Table 111 South Korea data center liquid cooling market, by service 2018 - 2030 (USD Billion)
- Table 112 South Korea data center liquid cooling market, by type of cooling 2018 - 2030 (USD Billion)
- Table 113 South Korea data center liquid cooling market, by data center type 2018 - 2030 (USD Billion)
- Table 114 South Korea data center liquid cooling market, by end use 2018 - 2030 (USD Billion)
- Table 115 Latin America data center liquid cooling market, by component 2018 - 2030 (USD Billion)
- Table 116 Latin America data center liquid cooling market, by solution 2018 - 2030 (USD Billion)
- Table 117 Latin America data center liquid cooling market, by service 2018 - 2030 (USD Billion)
- Table 118 Latin America data center liquid cooling market, by type of cooling 2018 - 2030 (USD Billion)
- Table 119 Latin America data center liquid cooling market, by data center type 2018 - 2030 (USD Billion)
- Table 120 Latin America data center liquid cooling market, by end use 2018 - 2030 (USD Billion)
- Table 121 Brazil data center liquid cooling market, by component 2018 - 2030 (USD Billion)
- Table 122 Brazil data center liquid cooling market, by solution 2018 - 2030 (USD Billion)
- Table 123 Brazil data center liquid cooling market, by service 2018 - 2030 (USD Billion)
- Table 124 Brazil data center liquid cooling market, by type of cooling 2018 - 2030 (USD Billion)
- Table 125 Brazil data center liquid cooling market, by data center type 2018 - 2030 (USD Billion)
- Table 126 Brazil data center liquid cooling market, by end use 2018 - 2030 (USD Billion)
- Table 127 Middle East & Africa data center liquid cooling market, by component 2018 - 2030 (USD Billion)
- Table 128 Middle East & Africa data center liquid cooling market, by solution 2018 - 2030 (USD Billion)
- Table 129 Middle East & Africa data center liquid cooling market, by service 2018 - 2030 (USD Billion)
- Table 130 Middle East & Africa data center liquid cooling market, by type of cooling 2018 - 2030 (USD Billion)
- Table 131 Middle East & Africa data center liquid cooling market, by data center type 2018 - 2030 (USD Billion)
- Table 132 Middle East & Africa data center liquid cooling market, by end use 2018 - 2030 (USD Billion)
- Table 133 UAE data center liquid cooling market, by component 2018 - 2030 (USD Billion)
- Table 134 UAE data center liquid cooling market, by solution 2018 - 2030 (USD Billion)
- Table 135 UAE data center liquid cooling market, by service 2018 - 2030 (USD Billion)
- Table 136 UAE data center liquid cooling market, by type of cooling 2018 - 2030 (USD Billion)
- Table 137 UAE data center liquid cooling market, by data center type 2018 - 2030 (USD Billion)
- Table 138 UAE data center liquid cooling market, by end use 2018 - 2030 (USD Billion)
- Table 139 Saudi Arabia data center liquid cooling market, by component 2018 - 2030 (USD Billion)
- Table 140 Saudi Arabia data center liquid cooling market, by solution 2018 - 2030 (USD Billion)
- Table 141 Saudi Arabia data center liquid cooling market, by service 2018 - 2030 (USD Billion)
- Table 142 Saudi Arabia data center liquid cooling market, by type of cooling 2018 - 2030 (USD Billion)
- Table 143 Saudi Arabia data center liquid cooling market, by data center type 2018 - 2030 (USD Billion)
- Table 144 Saudi Arabia data center liquid cooling market, by end use 2018 - 2030 (USD Billion)
- Table 145 South Africa data center liquid cooling market, by component 2018 - 2030 (USD Billion)
- Table 146 South Africa data center liquid cooling market, by solution 2018 - 2030 (USD Billion)
- Table 147 South Africa data center liquid cooling market, by service 2018 - 2030 (USD Billion)
- Table 148 South Africa data center liquid cooling market, by type of cooling 2018 - 2030 (USD Billion)
- Table 149 South Africa data center liquid cooling market, by data center type 2018 - 2030 (USD Billion)
- Table 150 South Africa data center liquid cooling market, by end use 2018 - 2030 (USD Billion)
List of Figures
- Fig. 1 Data Center Liquid Cooling Market Segmentation
- Fig. 2 Market landscape
- Fig. 3 Information Procurement
- Fig. 4 Data Analysis Models
- Fig. 5 Market Formulation and Validation
- Fig. 6 Data Validating & Publishing
- Fig. 7 Market Snapshot
- Fig. 8 Segment Snapshot
- Fig. 9 Competitive Landscape Snapshot
- Fig. 10 Data Center Liquid Cooling: Industry Value Chain Analysis
- Fig. 11 Data Center Liquid Cooling: Market Dynamics
- Fig. 12 Data Center Liquid Cooling: PORTER's Analysis
- Fig. 13 Data Center Liquid Cooling: PESTEL Analysis
- Fig. 14 Data Center Liquid Cooling Share by Component, 2024 & 2030 (USD Billion)
- Fig. 15 Data Center Liquid Cooling, by Component: Market Share, 2024 & 2030
- Fig. 16 Solution Market Estimates and Forecasts, 2018 - 2030 (Revenue, USD Billion)
- Fig. 17 Service Market Estimates and Forecasts, 2018 - 2030 (Revenue, USD Billion)
- Fig. 18 Data Center Liquid Cooling Share by Solution, 2024 & 2030 (USD Billion)
- Fig. 19 Data Center Liquid Cooling, by Solution: Market Share, 2024 & 2030
- Fig. 20 Direct Liquid Cooling Market Estimates and Forecasts, 2018 - 2030 (Revenue, USD Billion)
- Fig. 21 Indirect Liquid Cooling Market Estimates and Forecasts, 2018 - 2030 (Revenue, USD Billion)
- Fig. 22 Data Center Liquid Cooling Share by Service, 2024 & 2030 (USD Billion)
- Fig. 23 Data Center Liquid Cooling, by Service: Market Share, 2024 & 2030
- Fig. 24 Design and Consulting Market Estimates and Forecasts, 2018 - 2030 (Revenue, USD Billion)
- Fig. 25 Installation and Deployment Market Estimates and Forecasts, 2018 - 2030 (Revenue, USD Billion)
- Fig. 26 Maintenance and Support Market Estimates and Forecasts, 2018 - 2030 (Revenue, USD Billion)
- Fig. 27 Data Center Liquid Cooling Share by Type of Cooling, 2024 & 2030 (USD Billion)
- Fig. 28 Data Center Liquid Cooling, by Type of Cooling: Market Share, 2024 & 2030
- Fig. 29 Immersion Cooling Market Estimates and Forecasts, 2018 - 2030 (Revenue, USD Billion)
- Fig. 30 Cold Plate Cooling Market Estimates and Forecasts, 2018 - 2030 (Revenue, USD Billion)
- Fig. 31 Spray Liquid Cooling Market Estimates and Forecasts, 2018 - 2030 (Revenue, USD Billion)
- Fig. 32 Data Center Liquid Cooling Share by Data Center Type, 2024 & 2030 (USD Billion)
- Fig. 33 Data Center Liquid Cooling, by Data Center Type: Market Share, 2024 & 2030
- Fig. 34 Hyperscale Data Centers Market Estimates and Forecasts, 2018 - 2030 (Revenue, USD Billion)
- Fig. 35 Enterprise Data Centers Market Estimates and Forecasts, 2018 - 2030 (Revenue, USD Billion)
- Fig. 36 Colocation Data Centers Market Estimates and Forecasts, 2018 - 2030 (Revenue, USD Billion)
- Fig. 37 Edge Data Centers Market Estimates and Forecasts, 2018 - 2030 (Revenue, USD Billion)
- Fig. 38 High-Performance Computing (HPC) Data Centers Market Estimates and Forecasts, 2018 - 2030 (Revenue, USD Billion)
- Fig. 39 Data Center Liquid Cooling Share by End Use, 2024 & 2030 (USD Billion)
- Fig. 40 Data Center Liquid Cooling, by End Use: Market Share, 2024 & 2030
- Fig. 41 IT Market Estimates and Forecasts, 2018 - 2030 (Revenue, USD Billion)
- Fig. 42 Telecom Market Estimates and Forecasts, 2018 - 2030 (Revenue, USD Billion)
- Fig. 43 Healthcare Market Estimates and Forecasts, 2018 - 2030 (Revenue, USD Billion)
- Fig. 44 BFSI Market Estimates and Forecasts, 2018 - 2030 (Revenue, USD Billion)
- Fig. 45 Retail & E-commerce Market Estimates and Forecasts, 2018 - 2030 (Revenue, USD Billion)
- Fig. 46 Entertainment & Media Market Estimates and Forecasts, 2018 - 2030 (Revenue, USD Billion)
- Fig. 47 Energy Market Estimates and Forecasts, 2018 - 2030 (Revenue, USD Billion)
- Fig. 48 Others Market Estimates and Forecasts, 2018 - 2030 (Revenue, USD Billion)
- Fig. 49 Regional Marketplace: Key Takeaways
- Fig. 50 North America Data Center Liquid Cooling Market Estimates and Forecasts, 2018 - 2030 (USD Billion)
- Fig. 51 U.S. Data Center Liquid Cooling Market Estimates and Forecasts, 2018 - 2030 (USD Billion)
- Fig. 52 Canada Data Center Liquid Cooling Market Estimates and Forecasts, 2018 - 2030 (USD Billion)
- Fig. 53 Mexico Data Center Liquid Cooling Market Estimates and Forecasts, 2018 - 2030 (USD Billion)
- Fig. 54 Europe Data Center Liquid Cooling Market Estimates and Forecasts, 2018 - 2030 (USD Billion)
- Fig. 55 UK Data Center Liquid Cooling Market Estimates and Forecasts, 2018 - 2030 (USD Billion)
- Fig. 56 Germany Data Center Liquid Cooling Market Estimates and Forecasts, 2018 - 2030 (USD Billion)
- Fig. 57 France Data Center Liquid Cooling Market Estimates and Forecasts, 2018 - 2030 (USD Billion)
- Fig. 58 Asia Pacific Data Center Liquid Cooling Market Estimates and Forecast, 2018 - 2030 (USD Billion)
- Fig. 59 China Data Center Liquid Cooling Market Estimates and Forecasts, 2018 - 2030 (USD Billion)
- Fig. 60 India Data Center Liquid Cooling Market Estimates and Forecasts, 2018 - 2030 (USD Billion)
- Fig. 61 Japan Data Center Liquid Cooling Market Estimates and Forecasts, 2018 - 2030 (USD Billion)
- Fig. 62 Australia Data Center Liquid Cooling Market Estimates and Forecasts, 2018 - 2030 (USD Billion)
- Fig. 63 South Korea Data Center Liquid Cooling Market Estimates and Forecasts, 2018 - 2030 (USD Billion)
- Fig. 64 Latin America Data Center Liquid Cooling Market Estimates and Forecasts, 2018 - 2030 (USD Billion)
- Fig. 65 Brazil Data Center Liquid Cooling Market Estimates and Forecasts, 2018 - 2030 (USD Billion)
- Fig. 66 MEA Data Center Liquid Cooling Market Estimates and Forecasts, 2018 - 2030 (USD Billion)
- Fig. 67 Saudi Arabia Data Center Liquid Cooling Market Estimates and Forecasts, 2018 - 2030 (USD Billion)
- Fig. 68 UAE Data Center Liquid Cooling Market Estimates and Forecasts, 2018 - 2030 (USD Billion)
- Fig. 69 South Africa Data Center Liquid Cooling Market Estimates and Forecasts, 2018 - 2030 (USD Billion)
- Fig. 70 Key Company Categorization
- Fig. 71 Company Market Positioning
- Fig. 72 Key Company Market Share Analysis, 2024
- Fig. 73 Strategic Framework
Data Center Liquid Cooling Market Summary
The global data center liquid cooling market size was estimated at USD 5.38 billion in 2024 and is projected to reach USD 17.77 billion by 2030, growing at a CAGR of 21.6% from 2025 to 2030. The industry has experienced significant growth due to several key drivers. One of the main factors is the growing demand for energy-efficient solutions.
As the volume of data generated globally grows, so does the need for advanced cooling systems to manage the heat generated by densely packed server racks. Traditional air cooling systems are reaching their limitations in terms of efficiency, leading many data centers to adopt liquid cooling solutions. Liquid cooling systems are known for their superior efficiency, as liquids can absorb and transfer heat more effectively than air, allowing for better heat dissipation and reduced energy consumption.
Another key factor is the increasing use of high-performance computing (HPC) applications and artificial intelligence (AI). These applications require high computational power, which in turn generates considerable heat. Liquid cooling systems are essential for maintaining the performance and reliability of such systems, making them an attractive option for data centers that host HPC workloads, machine learning models, and AI-driven applications. The growing demand for AI, machine learning, and data analytics in industries such as healthcare, automotive, and finance is fueling the need for high-density server environments that rely heavily on advanced cooling methods.
Moreover, sustainability initiatives are contributing to the data center liquid cooling industry. With increased awareness of the environmental impact of energy consumption, companies are seeking ways to reduce their carbon footprints. Liquid cooling, due to its energy efficiency, helps in lowering power consumption compared to traditional air cooling systems, contributing to more sustainable operations in data centers. This shift aligns with the broader trend of adopting green technologies in various industries, especially in regions with stringent environmental regulations.
For instance, in May 2023, the U.S. Department of Energy (DOE) announced USD 40 million in funding for 15 projects aimed at developing high-performance, energy-efficient cooling solutions for data centers. Data centers, which house computers, storage systems, and computing infrastructure, currently account for around 2% of total U.S. electricity consumption. Cooling systems alone can represent up to 40% of the total energy usage in these facilities. This funding is designed to help reduce energy consumption and enhance the sustainability of data centers.
The advancement of liquid cooling technologies, including immersion cooling and direct-to-chip cooling, is also driving the market. These innovations are designed to optimize heat transfer while minimizing the space requirements and maintenance costs associated with traditional cooling methods. As these technologies become more cost-effective and scalable, more data centers are adopting liquid cooling solutions to meet the evolving demands of high-performance workloads.
Global Data Center Liquid Cooling Market Report Segmentation
This report forecasts revenue growth at the global, regional, and country levels and provides an analysis of the latest industry trends in each of the sub-segments from 2018 to 2030. For this study, Grand View Research has segmented the global data center liquid cooling market report based on component, solution, service, type of cooling, data center type, end-use, and region.
- Component Outlook (Revenue, USD Billion, 2018 - 2030)
- Solution
- Service
- Solution Outlook (Revenue, USD Billion, 2018 - 2030)
- Direct Liquid Cooling
- Indirect Liquid Cooling
- Service Outlook (Revenue, USD Billion, 2018 - 2030)
- Design and Consulting
- Installation and Deployment
- Maintenance and Support
- Type of Cooling Outlook (Revenue, USD Billion, 2018 - 2030)
- Immersion Cooling
- Cold Plate Cooling
- Spray Liquid Cooling
- Data Center Type Outlook (Revenue, USD Billion, 2018 - 2030)
- Hyperscale Data Centers
- Enterprise Data Centers
- Colocation Data Centers
- Edge Data Centers
- High-Performance Computing (HPC) Data Centers
- End Use Outlook (Revenue, USD Billion, 2018 - 2030)
- IT
- Telecom
- Healthcare
- BFSI
- Retail & E-commerce
- Entertainment & Media
- Energy
- Others
- Regional Outlook (Revenue, USD Billion, 2018 - 2030)
- North America
- U.S.
- Canada
- Mexico
- Europe
- UK
- Germany
- France
- Asia Pacific
- China
- India
- Japan
- South Korea
- Australia
- Latin America
- Brazil
- Middle East & Africa
- UAE
- Saudi Arabia
- South Africa
Table of Contents
Chapter 1. Methodology and Scope
- 1.1. Methodology segmentation & scope
- 1.2. Market Definitions
- 1.3. Research Methodology
- 1.3.1. Information Procurement
- 1.3.2. Information or Data Analysis
- 1.3.3. Market Formulation & Data Visualization
- 1.3.4. Data Validation & Publishing
- 1.4. Research Scope and Assumptions
- 1.4.1. List of Data Sources
Chapter 2. Executive Summary
- 2.1. Market Outlook
- 2.2. Segment Outlook
- 2.3. Competitive Insights
Chapter 3. Data Center Liquid Cooling Variables, Trends & Scope
- 3.1. Market Introduction/Lineage Outlook
- 3.2. Industry Value Chain Analysis
- 3.3. Market Dynamics
- 3.3.1. Market Drivers Analysis
- 3.3.2. Market Restraints Analysis
- 3.3.3. Industry Opportunities
- 3.4. Data Center Liquid Cooling Analysis Tools
- 3.4.1. Porter's Analysis
- 3.4.1.1. Bargaining power of the suppliers
- 3.4.1.2. Bargaining power of the buyers
- 3.4.1.3. Threats of substitution
- 3.4.1.4. Threats from new entrants
- 3.4.2. PESTEL Analysis
- 3.4.2.1. Political landscape
- 3.4.2.2. Economic and Social landscape
- 3.4.2.3. Technological landscape
- 3.4.2.4. Environmental landscape
- 3.4.2.5. Legal landscape
- 3.4.1. Porter's Analysis
Chapter 4. Data Center Liquid Cooling Market: Component Estimates & Trend Analysis
- 4.1. Segment Dashboard
- 4.2. Data Center Liquid Cooling: Component Movement Analysis, 2024 & 2030 (USD Billion)
- 4.3. Solution
- 4.3.1. Market Size Estimates and Forecasts, 2018 - 2030 (USD Billion)
- 4.4. Service
- 4.4.1. Market Size Estimates and Forecasts, 2018 - 2030 (USD Billion)
Chapter 5. Data Center Liquid Cooling Market: Solution Estimates & Trend Analysis
- 5.1. Segment Dashboard
- 5.2. Data Center Liquid Cooling: Solution Movement Analysis, 2024 & 2030 (USD Billion)
- 5.3. Direct Liquid Cooling
- 5.3.1. Market Size Estimates and Forecasts, 2018 - 2030 (USD Billion)
- 5.4. Indirect Liquid Cooling
- 5.4.1. Market Size Estimates and Forecasts, 2018 - 2030 (USD Billion)
Chapter 6. Data Center Liquid Cooling Market: Service Estimates & Trend Analysis
- 6.1. Segment Dashboard
- 6.2. Data Center Liquid Cooling: Service Movement Analysis, 2024 & 2030 (USD Billion)
- 6.3. Design and Consulting
- 6.3.1. Market Size Estimates and Forecasts, 2018 - 2030 (USD Billion)
- 6.4. Installation and Deployment
- 6.4.1. Market Size Estimates and Forecasts, 2018 - 2030 (USD Billion)
- 6.5. Maintenance and Support
- 6.5.1. Market Size Estimates and Forecasts, 2018 - 2030 (USD Billion)
Chapter 7. Data Center Liquid Cooling Market: Type of Cooling Estimates & Trend Analysis
- 7.1. Segment Dashboard
- 7.2. Data Center Liquid Cooling: Type of Cooling Movement Analysis, 2024 & 2030 (USD Billion)
- 7.3. Immersion Cooling
- 7.3.1. Market Size Estimates and Forecasts, 2018 - 2030 (USD Billion)
- 7.4. Cold Plate Cooling
- 7.4.1. Market Size Estimates and Forecasts, 2018 - 2030 (USD Billion)
- 7.5. Spray Liquid Cooling
- 7.5.1. Market Size Estimates and Forecasts, 2018 - 2030 (USD Billion)
Chapter 8. Data Center Liquid Cooling Market: Data Center Type Estimates & Trend Analysis
- 8.1. Segment Dashboard
- 8.2. Data Center Liquid Cooling: Data Center Type Movement Analysis, 2024 & 2030 (USD Billion)
- 8.3. Hyperscale Data Centers
- 8.3.1. Market Size Estimates and Forecasts, 2018 - 2030 (USD Billion)
- 8.4. Enterprise Data Centers
- 8.4.1. Market Size Estimates and Forecasts, 2018 - 2030 (USD Billion)
- 8.5. Colocation Data Centers
- 8.5.1. Market Size Estimates and Forecasts, 2018 - 2030 (USD Billion)
- 8.6. Edge Data Centers
- 8.6.1. Market Size Estimates and Forecasts, 2018 - 2030 (USD Billion)
- 8.7. High-Performance Computing (HPC) Data Centers
- 8.7.1. Market Size Estimates and Forecasts, 2018 - 2030 (USD Billion)
Chapter 9. Data Center Liquid Cooling Market: End Use Estimates & Trend Analysis
- 9.1. Segment Dashboard
- 9.2. Data Center Liquid Cooling: End Use Movement Analysis, 2024 & 2030 (USD Billion)
- 9.3. IT
- 9.3.1. Market Size Estimates and Forecasts, 2018 - 2030 (USD Billion)
- 9.4. Telecom
- 9.4.1. Market Size Estimates and Forecasts, 2018 - 2030 (USD Billion)
- 9.5. Healthcare
- 9.5.1. Market Size Estimates and Forecasts, 2018 - 2030 (USD Billion)
- 9.6. BFSI
- 9.6.1. Market Size Estimates and Forecasts, 2018 - 2030 (USD Billion)
- 9.7. Retail & E-commerce
- 9.7.1. Market Size Estimates and Forecasts, 2018 - 2030 (USD Billion)
- 9.8. Entertainment & Media
- 9.8.1. Market Size Estimates and Forecasts, 2018 - 2030 (USD Billion)
- 9.9. Energy
- 9.9.1. Market Size Estimates and Forecasts, 2018 - 2030 (USD Billion)
- 9.10. Others
- 9.10.1. Market Size Estimates and Forecasts, 2018 - 2030 (USD Billion)
Chapter 10. Data Center Liquid Cooling Market: Regional Estimates & Trend Analysis
- 10.1. Data Center Liquid Cooling Share, By Region, 2024 & 2030, USD Billion
- 10.2. North America
- 10.2.1. Market Estimates and Forecasts, 2018 - 2030 (USD Billion)
- 10.2.2. Market estimates and forecast by component, 2018 - 2030 (Revenue, USD Billion)
- 10.2.3. Market estimates and forecast by solution, 2018 - 2030 (Revenue, USD Billion)
- 10.2.4. Market estimates and forecast by service, 2018 - 2030 (Revenue, USD Billion)
- 10.2.5. Market estimates and forecast by type of cooling, 2018 - 2030 (Revenue, USD Billion)
- 10.2.6. Market estimates and forecast by data center type, 2018 - 2030 (Revenue, USD Billion)
- 10.2.7. Market estimates and forecast by end use, 2018 - 2030 (Revenue, USD Billion)
- 10.2.8. U.S.
- 10.2.8.1. Market Estimates and Forecasts, 2018 - 2030 (USD Billion)
- 10.2.8.2. Market estimates and forecast by component, 2018 - 2030 (Revenue, USD Billion)
- 10.2.8.3. Market estimates and forecast by solution, 2018 - 2030 (Revenue, USD Billion)
- 10.2.8.4. Market estimates and forecast by service, 2018 - 2030 (Revenue, USD Billion)
- 10.2.8.5. Market estimates and forecast by type of cooling, 2018 - 2030 (Revenue, USD Billion)
- 10.2.8.6. Market estimates and forecast by data center type, 2018 - 2030 (Revenue, USD Billion)
- 10.2.8.7. Market estimates and forecast by end use, 2018 - 2030 (Revenue, USD Billion)
- 10.2.9. Canada
- 10.2.9.1. Market Estimates and Forecasts, 2018 - 2030 (USD Billion)
- 10.2.9.2. Market estimates and forecast by component, 2018 - 2030 (Revenue, USD Billion)
- 10.2.9.3. Market estimates and forecast by solution, 2018 - 2030 (Revenue, USD Billion)
- 10.2.9.4. Market estimates and forecast by service, 2018 - 2030 (Revenue, USD Billion)
- 10.2.9.5. Market estimates and forecast by type of cooling, 2018 - 2030 (Revenue, USD Billion)
- 10.2.9.6. Market estimates and forecast by data center type, 2018 - 2030 (Revenue, USD Billion)
- 10.2.9.7. Market estimates and forecast by end use, 2018 - 2030 (Revenue, USD Billion)
- 10.2.10. Mexico
- 10.2.10.1. Market Estimates and Forecasts, 2018 - 2030 (USD Billion)
- 10.2.10.2. Market estimates and forecast by component, 2018 - 2030 (Revenue, USD Billion)
- 10.2.10.3. Market estimates and forecast by solution, 2018 - 2030 (Revenue, USD Billion)
- 10.2.10.4. Market estimates and forecast by service, 2018 - 2030 (Revenue, USD Billion)
- 10.2.10.5. Market estimates and forecast by type of cooling, 2018 - 2030 (Revenue, USD Billion)
- 10.2.10.6. Market estimates and forecast by data center type, 2018 - 2030 (Revenue, USD Billion)
- 10.2.10.7. Market estimates and forecast by end use, 2018 - 2030 (Revenue, USD Billion)
- 10.3. Europe
- 10.3.1. Market Estimates and Forecasts, 2018 - 2030 (USD Billion)
- 10.3.2. Market estimates and forecast by component, 2018 - 2030 (Revenue, USD Billion)
- 10.3.3. Market estimates and forecast by solution, 2018 - 2030 (Revenue, USD Billion)
- 10.3.4. Market estimates and forecast by service, 2018 - 2030 (Revenue, USD Billion)
- 10.3.5. Market estimates and forecast by type of cooling, 2018 - 2030 (Revenue, USD Billion)
- 10.3.6. Market estimates and forecast by data center type, 2018 - 2030 (Revenue, USD Billion)
- 10.3.7. Market estimates and forecast by end use, 2018 - 2030 (Revenue, USD Billion)
- 10.3.8. UK
- 10.3.8.1. Market Estimates and Forecasts, 2018 - 2030 (USD Billion)
- 10.3.8.2. Market estimates and forecast by component, 2018 - 2030 (Revenue, USD Billion)
- 10.3.8.3. Market estimates and forecast by solution, 2018 - 2030 (Revenue, USD Billion)
- 10.3.8.4. Market estimates and forecast by service, 2018 - 2030 (Revenue, USD Billion)
- 10.3.8.5. Market estimates and forecast by type of cooling, 2018 - 2030 (Revenue, USD Billion)
- 10.3.8.6. Market estimates and forecast by data center type, 2018 - 2030 (Revenue, USD Billion)
- 10.3.8.7. Market estimates and forecast by end use, 2018 - 2030 (Revenue, USD Billion)
- 10.3.9. Germany
- 10.3.9.1. Market Estimates and Forecasts, 2018 - 2030 (USD Billion)
- 10.3.9.2. Market estimates and forecast by component, 2018 - 2030 (Revenue, USD Billion)
- 10.3.9.3. Market estimates and forecast by solution, 2018 - 2030 (Revenue, USD Billion)
- 10.3.9.4. Market estimates and forecast by service, 2018 - 2030 (Revenue, USD Billion)
- 10.3.9.5. Market estimates and forecast by type of cooling, 2018 - 2030 (Revenue, USD Billion)
- 10.3.9.6. Market estimates and forecast by data center type, 2018 - 2030 (Revenue, USD Billion)
- 10.3.9.7. Market estimates and forecast by end use, 2018 - 2030 (Revenue, USD Billion)
- 10.3.10. France
- 10.3.10.1. Market Estimates and Forecasts, 2018 - 2030 (USD Billion)
- 10.3.10.2. Market estimates and forecast by component, 2018 - 2030 (Revenue, USD Billion)
- 10.3.10.3. Market estimates and forecast by solution, 2018 - 2030 (Revenue, USD Billion)
- 10.3.10.4. Market estimates and forecast by service, 2018 - 2030 (Revenue, USD Billion)
- 10.3.10.5. Market estimates and forecast by type of cooling, 2018 - 2030 (Revenue, USD Billion)
- 10.3.10.6. Market estimates and forecast by data center type, 2018 - 2030 (Revenue, USD Billion)
- 10.3.10.7. Market estimates and forecast by end use, 2018 - 2030 (Revenue, USD Billion)
- 10.4. Asia Pacific
- 10.4.1. Market Estimates and Forecasts, 2018 - 2030 (USD Billion)
- 10.4.2. Market estimates and forecast by component, 2018 - 2030 (Revenue, USD Billion)
- 10.4.3. Market estimates and forecast by solution, 2018 - 2030 (Revenue, USD Billion)
- 10.4.4. Market estimates and forecast by service, 2018 - 2030 (Revenue, USD Billion)
- 10.4.5. Market estimates and forecast by type of cooling, 2018 - 2030 (Revenue, USD Billion)
- 10.4.6. Market estimates and forecast by data center type, 2018 - 2030 (Revenue, USD Billion)
- 10.4.7. Market estimates and forecast by end use, 2018 - 2030 (Revenue, USD Billion)
- 10.4.8. China
- 10.4.8.1. Market Estimates and Forecasts, 2018 - 2030 (USD Billion)
- 10.4.8.2. Market estimates and forecast by component, 2018 - 2030 (Revenue, USD Billion)
- 10.4.8.3. Market estimates and forecast by solution, 2018 - 2030 (Revenue, USD Billion)
- 10.4.8.4. Market estimates and forecast by service, 2018 - 2030 (Revenue, USD Billion)
- 10.4.8.5. Market estimates and forecast by type of cooling, 2018 - 2030 (Revenue, USD Billion)
- 10.4.8.6. Market estimates and forecast by data center type, 2018 - 2030 (Revenue, USD Billion)
- 10.4.8.7. Market estimates and forecast by end use, 2018 - 2030 (Revenue, USD Billion)
- 10.4.9. India
- 10.4.9.1. Market Estimates and Forecasts, 2018 - 2030 (USD Billion)
- 10.4.9.2. Market estimates and forecast by component, 2018 - 2030 (Revenue, USD Billion)
- 10.4.9.3. Market estimates and forecast by solution, 2018 - 2030 (Revenue, USD Billion)
- 10.4.9.4. Market estimates and forecast by service, 2018 - 2030 (Revenue, USD Billion)
- 10.4.9.5. Market estimates and forecast by type of cooling, 2018 - 2030 (Revenue, USD Billion)
- 10.4.9.6. Market estimates and forecast by data center type, 2018 - 2030 (Revenue, USD Billion)
- 10.4.9.7. Market estimates and forecast by end use, 2018 - 2030 (Revenue, USD Billion)
- 10.4.10. Japan
- 10.4.10.1. Market Estimates and Forecasts, 2018 - 2030 (USD Billion)
- 10.4.10.2. Market estimates and forecast by component, 2018 - 2030 (Revenue, USD Billion)
- 10.4.10.3. Market estimates and forecast by solution, 2018 - 2030 (Revenue, USD Billion)
- 10.4.10.4. Market estimates and forecast by service, 2018 - 2030 (Revenue, USD Billion)
- 10.4.10.5. Market estimates and forecast by type of cooling, 2018 - 2030 (Revenue, USD Billion)
- 10.4.10.6. Market estimates and forecast by data center type, 2018 - 2030 (Revenue, USD Billion)
- 10.4.10.7. Market estimates and forecast by end use, 2018 - 2030 (Revenue, USD Billion)
- 10.4.11. Australia
- 10.4.11.1. Market Estimates and Forecasts, 2018 - 2030 (USD Billion)
- 10.4.11.2. Market estimates and forecast by component, 2018 - 2030 (Revenue, USD Billion)
- 10.4.11.3. Market estimates and forecast by solution, 2018 - 2030 (Revenue, USD Billion)
- 10.4.11.4. Market estimates and forecast by service, 2018 - 2030 (Revenue, USD Billion)
- 10.4.11.5. Market estimates and forecast by type of cooling, 2018 - 2030 (Revenue, USD Billion)
- 10.4.11.6. Market estimates and forecast by data center type, 2018 - 2030 (Revenue, USD Billion)
- 10.4.11.7. Market estimates and forecast by end use, 2018 - 2030 (Revenue, USD Billion)
- 10.4.12. South Korea
- 10.4.12.1. Market Estimates and Forecasts, 2018 - 2030 (USD Billion)
- 10.4.12.2. Market estimates and forecast by component, 2018 - 2030 (Revenue, USD Billion)
- 10.4.12.3. Market estimates and forecast by solution, 2018 - 2030 (Revenue, USD Billion)
- 10.4.12.4. Market estimates and forecast by service, 2018 - 2030 (Revenue, USD Billion)
- 10.4.12.5. Market estimates and forecast by type of cooling, 2018 - 2030 (Revenue, USD Billion)
- 10.4.12.6. Market estimates and forecast by data center type, 2018 - 2030 (Revenue, USD Billion)
- 10.4.12.7. Market estimates and forecast by end use, 2018 - 2030 (Revenue, USD Billion)
- 10.5. Latin America
- 10.5.1. Market Estimates and Forecasts, 2018 - 2030 (USD Billion)
- 10.5.2. Market estimates and forecast by component, 2018 - 2030 (Revenue, USD Billion)
- 10.5.3. Market estimates and forecast by solution, 2018 - 2030 (Revenue, USD Billion)
- 10.5.4. Market estimates and forecast by service, 2018 - 2030 (Revenue, USD Billion)
- 10.5.5. Market estimates and forecast by type of cooling, 2018 - 2030 (Revenue, USD Billion)
- 10.5.6. Market estimates and forecast by data center type, 2018 - 2030 (Revenue, USD Billion)
- 10.5.7. Market estimates and forecast by end use, 2018 - 2030 (Revenue, USD Billion)
- 10.5.8. Brazil
- 10.5.8.1. Market Estimates and Forecasts, 2018 - 2030 (USD Billion)
- 10.5.8.2. Market estimates and forecast by component, 2018 - 2030 (Revenue, USD Billion)
- 10.5.8.3. Market estimates and forecast by solution, 2018 - 2030 (Revenue, USD Billion)
- 10.5.8.4. Market estimates and forecast by service, 2018 - 2030 (Revenue, USD Billion)
- 10.5.8.5. Market estimates and forecast by type of cooling, 2018 - 2030 (Revenue, USD Billion)
- 10.5.8.6. Market estimates and forecast by data center type, 2018 - 2030 (Revenue, USD Billion)
- 10.5.8.7. Market estimates and forecast by end use, 2018 - 2030 (Revenue, USD Billion)
- 10.6. Middle East & Africa
- 10.6.1. Market Estimates and Forecasts, 2018 - 2030 (USD Billion)
- 10.6.2. Market estimates and forecast by component, 2018 - 2030 (Revenue, USD Billion)
- 10.6.3. Market estimates and forecast by solution, 2018 - 2030 (Revenue, USD Billion)
- 10.6.4. Market estimates and forecast by service, 2018 - 2030 (Revenue, USD Billion)
- 10.6.5. Market estimates and forecast by type of cooling, 2018 - 2030 (Revenue, USD Billion)
- 10.6.6. Market estimates and forecast by data center type, 2018 - 2030 (Revenue, USD Billion)
- 10.6.7. Market estimates and forecast by end use, 2018 - 2030 (Revenue, USD Billion)
- 10.6.8. Saudi Arabia
- 10.6.8.1. Market Estimates and Forecasts, 2018 - 2030 (USD Billion)
- 10.6.8.2. Market estimates and forecast by component, 2018 - 2030 (Revenue, USD Billion)
- 10.6.8.3. Market estimates and forecast by solution, 2018 - 2030 (Revenue, USD Billion)
- 10.6.8.4. Market estimates and forecast by service, 2018 - 2030 (Revenue, USD Billion)
- 10.6.8.5. Market estimates and forecast by type of cooling, 2018 - 2030 (Revenue, USD Billion)
- 10.6.8.6. Market estimates and forecast by data center type, 2018 - 2030 (Revenue, USD Billion)
- 10.6.8.7. Market estimates and forecast by end use, 2018 - 2030 (Revenue, USD Billion)
- 10.6.9. UAE
- 10.6.9.1. Market Estimates and Forecasts, 2018 - 2030 (USD Billion)
- 10.6.9.2. Market estimates and forecast by component, 2018 - 2030 (Revenue, USD Billion)
- 10.6.9.3. Market estimates and forecast by solution, 2018 - 2030 (Revenue, USD Billion)
- 10.6.9.4. Market estimates and forecast by service, 2018 - 2030 (Revenue, USD Billion)
- 10.6.9.5. Market estimates and forecast by type of cooling, 2018 - 2030 (Revenue, USD Billion)
- 10.6.9.6. Market estimates and forecast by data center type, 2018 - 2030 (Revenue, USD Billion)
- 10.6.9.7. Market estimates and forecast by end use, 2018 - 2030 (Revenue, USD Billion)
- 10.6.10. South Africa
- 10.6.10.1. Market Estimates and Forecasts, 2018 - 2030 (USD Billion)
- 10.6.10.2. Market estimates and forecast by component, 2018 - 2030 (Revenue, USD Billion)
- 10.6.10.3. Market estimates and forecast by solution, 2018 - 2030 (Revenue, USD Billion)
- 10.6.10.4. Market estimates and forecast by service, 2018 - 2030 (Revenue, USD Billion)
- 10.6.10.5. Market estimates and forecast by type of cooling, 2018 - 2030 (Revenue, USD Billion)
- 10.6.10.6. Market estimates and forecast by data center type, 2018 - 2030 (Revenue, USD Billion)
- 10.6.10.7. Market estimates and forecast by end use, 2018 - 2030 (Revenue, USD Billion)
Chapter 11. Competitive Landscape
- 11.1. Recent Developments & Impact Analysis by Key Market Participants
- 11.2. Company Categorization
- 11.3. Company Market Share Analysis
- 11.4. Company Heat Map Analysis
- 11.5. Strategy Mapping
- 11.5.1. Expansion
- 11.5.2. Mergers & Acquisition
- 11.5.3. Partnerships & Collaborations
- 11.5.4. New Product Launches
- 11.5.5. Research And Development
- 11.6. Company Profiles
- 11.6.1. Alfa Laval
- 11.6.1.1. Participant's Overview
- 11.6.1.2. Financial Performance
- 11.6.1.3. Product Benchmarking
- 11.6.1.4. Recent Developments
- 11.6.2. Asetek, Inc.
- 11.6.2.1. Participant's Overview
- 11.6.2.2. Financial Performance
- 11.6.2.3. Product Benchmarking
- 11.6.2.4. Recent Developments
- 11.6.3. Asperitas
- 11.6.3.1. Participant's Overview
- 11.6.3.2. Financial Performance
- 11.6.3.3. Product Benchmarking
- 11.6.3.4. Recent Developments
- 11.6.4. COOLIT SYSTEMS
- 11.6.4.1. Participant's Overview
- 11.6.4.2. Financial Performance
- 11.6.4.3. Product Benchmarking
- 11.6.4.4. Recent Developments
- 11.6.5. Dell Inc.
- 11.6.5.1. Participant's Overview
- 11.6.5.2. Financial Performance
- 11.6.5.3. Product Benchmarking
- 11.6.5.4. Recent Developments
- 11.6.6. Fujitsu
- 11.6.6.1. Participant's Overview
- 11.6.6.2. Financial Performance
- 11.6.6.3. Product Benchmarking
- 11.6.6.4. Recent Developments
- 11.6.7. Hitachi, Ltd.
- 11.6.7.1. Participant's Overview
- 11.6.7.2. Financial Performance
- 11.6.7.3. Product Benchmarking
- 11.6.7.4. Recent Developments
- 11.6.8. Iceotope Technologies
- 11.6.8.1. Participant's Overview
- 11.6.8.2. Financial Performance
- 11.6.8.3. Product Benchmarking
- 11.6.8.4. Recent Developments
- 11.6.9. Lenovo Group Limited
- 11.6.9.1. Participant's Overview
- 11.6.9.2. Financial Performance
- 11.6.9.3. Product Benchmarking
- 11.6.9.4. Recent Developments
- 11.6.10. LiquidStack
- 11.6.10.1. Participant's Overview
- 11.6.10.2. Financial Performance
- 11.6.10.3. Product Benchmarking
- 11.6.10.4. Recent Developments
- 11.6.11. Mitsubishi Electric Corporation
- 11.6.11.1. Participant's Overview
- 11.6.11.2. Financial Performance
- 11.6.11.3. Product Benchmarking
- 11.6.11.4. Recent Developments
- 11.6.12. NTT Ltd.
- 11.6.12.1. Participant's Overview
- 11.6.12.2. Financial Performance
- 11.6.12.3. Product Benchmarking
- 11.6.12.4. Recent Developments
- 11.6.13. Schneider Electric
- 11.6.13.1. Participant's Overview
- 11.6.13.2. Financial Performance
- 11.6.13.3. Product Benchmarking
- 11.6.13.4. Recent Developments
- 11.6.14. STULZ GMBH
- 11.6.14.1. Participant's Overview
- 11.6.14.2. Financial Performance
- 11.6.14.3. Product Benchmarking
- 11.6.14.4. Recent Developments
- 11.6.15. Vertiv Group Corp.
- 11.6.15.1. Participant's Overview
- 11.6.15.2. Financial Performance
- 11.6.15.3. Product Benchmarking
- 11.6.15.4. Recent Developments
- 11.6.1. Alfa Laval

