|
|
市場調査レポート
商品コード
1774419
AIデータセンター向け液体冷却の世界市場 2025-2029Global Liquid Cooling for AI Data Centers Market 2025-2029 |
||||||

|
|||||||
カスタマイズ可能
|
|||||||

| AIデータセンター向け液体冷却の世界市場 2025-2029 |
|
出版日: 2025年07月12日
発行: TechNavio
ページ情報: 英文 237 Pages
納期: 即納可能
|

全表示
- 概要
- 図表
- 目次
AIデータセンター向け液体冷却市場は2024-2029年に18億7,660万米ドル、予測期間中のCAGRは31.4%で成長すると予測されます。
当レポートでは、AIデータセンター向け液体冷却市場の全体的な分析、市場規模・予測、動向、成長促進要因、課題、約25のベンダーを網羅したベンダー分析などを掲載しています。
現在の市場シナリオ、最新動向と促進要因、市場環境全体に関する最新分析を提供しています。市場を牽引しているのは、AIアクセラレータの熱設計パワーと演算密度の上昇、エネルギー効率、持続可能性、運用経費削減の必要性、主権と企業のAI至上主義への大規模な戦略投資です。
| 市場範囲 | |
|---|---|
| 基準年 | 2025 |
| 終了年 | 2029 |
| 予測期間 | 2025-2029 |
| 成長モメンタム | 加速 |
| 前年比 | 29.5% |
| CAGR | 31.4% |
| 増分額 | 18億7,660万米ドル |
本調査は、業界の主要参加者からのインプットを含め、一次情報と二次情報を客観的に組み合わせて実施しました。レポートには、主要企業の分析に加え、包括的な市場規模データ、地域別分析によるセグメント、ベンダー情勢が含まれています。レポートには過去データと予測データがあります。
本調査では、今後数年間のAIデータセンター向け液体冷却市場の成長を促進する主な要因の1つとして、実用的な展開を目的としたハイブリッド冷却アーキテクチャの台頭を挙げています。また、究極の高密度および持続可能なソリューションとして液浸冷却の機運が高まっており、標準化とエコシステム連携の推進が市場の大きな需要につながります。
目次
第1章 エグゼクティブサマリー
- 市場概要
第2章 Technavio分析
- 価格・ライフサイクル・顧客購入バスケット・採用率・購入基準の分析
- インプットの重要性と差別化の要因
- 混乱の要因
- 促進要因と課題の影響
第3章 市場情勢
- 市場エコシステム
- 市場の特徴
- バリューチェーン分析
第4章 市場規模
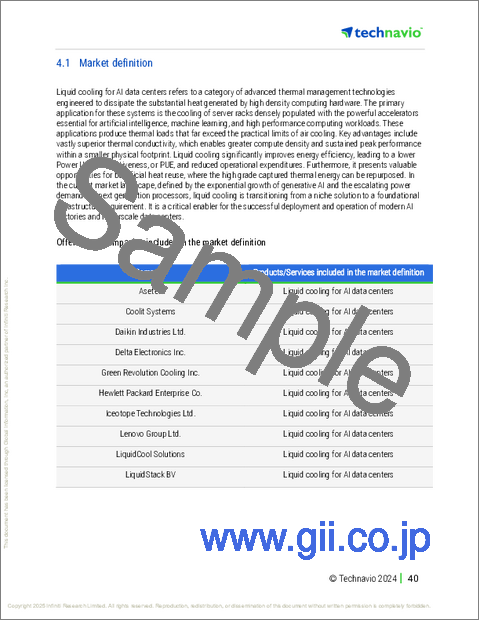
- 市場の定義
- 市場セグメント分析
- 市場規模 2024
- 市場の見通し 2024-2029
第5章 市場規模実績
- AIデータセンター向け液体冷却の世界市場 2019-2023
- タイプ別セグメント分析 2019-2023
- エンドユーザー別セグメント分析 2019-2023
- コンポーネント別セグメント分析 2019-2023
- 地域別セグメント分析 2019-2023
- 国別セグメント分析 2019-2023
第6章 ファイブフォース分析
- ファイブフォースの要約
- 買い手の交渉力
- 供給企業の交渉力
- 新規参入業者の脅威
- 代替品の脅威
- 競争の脅威
- 市況
第7章 市場セグメンテーション:タイプ別
- 市場セグメント
- 比較:タイプ別
- コールドプレート冷却:市場規模と予測 2024-2029
- 浸漬冷却:市場規模と予測 2024-2029
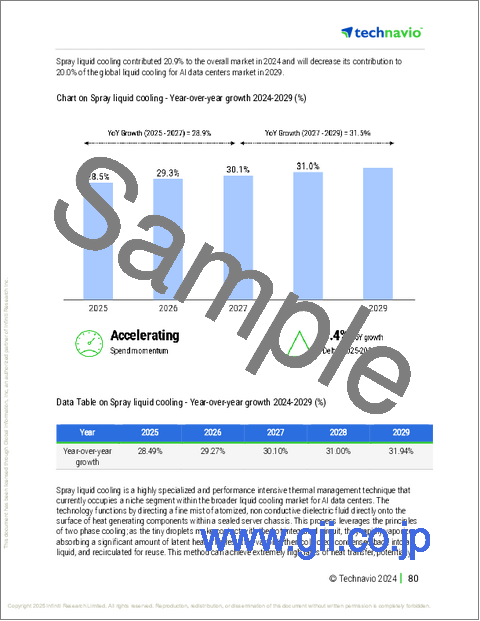
- スプレー液体冷却:市場規模と予測 2024-2029
- 市場機会:タイプ別
第8章 市場セグメンテーション:エンドユーザー別
- 市場セグメント
- 比較:エンドユーザー別
- ハイパースケールデータセンター:市場規模と予測 2024-2029
- コロケーションデータセンター:市場規模と予測 2024-2029
- その他:市場規模と予測 2024-2029
- 市場機会:エンドユーザー別
第9章 市場セグメンテーション:コンポーネント別
- 市場セグメント
- 比較:コンポーネント別
- ソリューション:市場規模と予測 2024-2029
- サービス:市場規模と予測 2024-2029
- 市場機会:コンポーネント別
第10章 顧客情勢
- 顧客情勢の概要
第11章 地域別情勢
- 地域別セグメンテーション
- 地域別比較
- 北米:市場規模と予測 2024-2029
- アジア太平洋:市場規模と予測 2024-2029
- 欧州:市場規模と予測 2024-2029
- 南米:市場規模と予測 2024-2029
- 中東・アフリカ:市場規模と予測 2024-2029
- 米国:市場規模と予測 2024-2029
- 中国:市場規模と予測 2024-2029
- ドイツ:市場規模と予測 2024-2029
- カナダ:市場規模と予測 2024-2029
- 日本:市場規模と予測 2024-2029
- 英国:市場規模と予測 2024-2029
- インド:市場規模と予測 2024-2029
- フランス:市場規模と予測 2024-2029
- オランダ:市場規模と予測 2024-2029
- オーストラリア:市場規模と予測 2024-2029
- 市場機会:地域情勢別
第12章 促進要因・課題・機会・抑制要因
- 市場促進要因
- 市場の課題
- 促進要因と課題の影響
- 市場の機会・抑制要因
第13章 競合情勢
- 概要
- 競合情勢
- 混乱の状況
- 業界のリスク
第14章 競合分析
- 企業プロファイル
- 企業ランキング指数
- 企業の市場ポジショニング
- Asetek
- Coolit Systems
- DAIkin Industries Ltd.
- Delta Electronics Inc.
- Green Revolution Cooling Inc.
- Hewlett Packard Enterprise Co.
- Iceotope Technologies Ltd.
- Lenovo Group Ltd.
- LiquidCool Solutions
- LiquidStack BV
- Rittal GmbH and Co. KG
- Schneider Electric SE
- STULZ GmbH
- Super Micro Computer Inc.
- Vertiv Holdings Co.
第15章 付録
Exhibits:
- Exhibits1: Executive Summary - Chart on Market Overview
- Exhibits2: Executive Summary - Data Table on Market Overview
- Exhibits3: Executive Summary - Chart on Global Market Characteristics
- Exhibits4: Executive Summary - Chart on Market By Geographical Landscape
- Exhibits5: Executive Summary - Chart on Market Segmentation by Type
- Exhibits6: Executive Summary - Chart on Market Segmentation by End-user
- Exhibits7: Executive Summary - Chart on Market Segmentation by Component
- Exhibits8: Executive Summary - Chart on Incremental Growth
- Exhibits9: Executive Summary - Data Table on Incremental Growth
- Exhibits10: Executive Summary - Chart on Company Market Positioning
- Exhibits11: Analysis of price sensitivity, lifecycle, customer purchase basket, adoption rates, and purchase criteria
- Exhibits12: Overview on criticality of inputs and factors of differentiation
- Exhibits13: Overview on factors of disruption
- Exhibits14: Impact of drivers and challenges in 2024 and 2029
- Exhibits15: Parent Market
- Exhibits16: Data Table on - Parent Market
- Exhibits17: Market characteristics analysis
- Exhibits18: Value chain analysis
- Exhibits19: Offerings of companies included in the market definition
- Exhibits20: Market segments
- Exhibits21: Chart on Global - Market size and forecast 2024-2029 ($ million)
- Exhibits22: Data Table on Global - Market size and forecast 2024-2029 ($ million)
- Exhibits23: Chart on Global Market: Year-over-year growth 2024-2029 (%)
- Exhibits24: Data Table on Global Market: Year-over-year growth 2024-2029 (%)
- Exhibits25: Historic Market Size - Data Table on Global Liquid Cooling For AI Data Centers Market 2019 - 2023 ($ million)
- Exhibits26: Historic Market Size - Type Segment 2019 - 2023 ($ million)
- Exhibits27: Historic Market Size - End-user Segment 2019 - 2023 ($ million)
- Exhibits28: Historic Market Size - Component Segment 2019 - 2023 ($ million)
- Exhibits29: Historic Market Size - Geography Segment 2019 - 2023 ($ million)
- Exhibits30: Historic Market Size - Country Segment 2019 - 2023 ($ million)
- Exhibits31: Five forces analysis - Comparison between 2024 and 2029
- Exhibits32: Bargaining power of buyers - Impact of key factors 2024 and 2029
- Exhibits33: Bargaining power of suppliers - Impact of key factors in 2024 and 2029
- Exhibits34: Threat of new entrants - Impact of key factors in 2024 and 2029
- Exhibits35: Threat of substitutes - Impact of key factors in 2024 and 2029
- Exhibits36: Threat of rivalry - Impact of key factors in 2024 and 2029
- Exhibits37: Chart on Market condition - Five forces 2024 and 2029
- Exhibits38: Chart on Type - Market share 2024-2029 (%)
- Exhibits39: Data Table on Type - Market share 2024-2029 (%)
- Exhibits40: Chart on Comparison by Type
- Exhibits41: Data Table on Comparison by Type
- Exhibits42: Chart on Cold plate cooling - Market size and forecast 2024-2029 ($ million)
- Exhibits43: Data Table on Cold plate cooling - Market size and forecast 2024-2029 ($ million)
- Exhibits44: Chart on Cold plate cooling - Year-over-year growth 2024-2029 (%)
- Exhibits45: Data Table on Cold plate cooling - Year-over-year growth 2024-2029 (%)
- Exhibits46: Chart on Immersion cooling - Market size and forecast 2024-2029 ($ million)
- Exhibits47: Data Table on Immersion cooling - Market size and forecast 2024-2029 ($ million)
- Exhibits48: Chart on Immersion cooling - Year-over-year growth 2024-2029 (%)
- Exhibits49: Data Table on Immersion cooling - Year-over-year growth 2024-2029 (%)
- Exhibits50: Chart on Spray liquid cooling - Market size and forecast 2024-2029 ($ million)
- Exhibits51: Data Table on Spray liquid cooling - Market size and forecast 2024-2029 ($ million)
- Exhibits52: Chart on Spray liquid cooling - Year-over-year growth 2024-2029 (%)
- Exhibits53: Data Table on Spray liquid cooling - Year-over-year growth 2024-2029 (%)
- Exhibits54: Market opportunity by Type ($ million)
- Exhibits55: Data Table on Market opportunity by Type ($ million)
- Exhibits56: Chart on End-user - Market share 2024-2029 (%)
- Exhibits57: Data Table on End-user - Market share 2024-2029 (%)
- Exhibits58: Chart on Comparison by End-user
- Exhibits59: Data Table on Comparison by End-user
- Exhibits60: Chart on Hyperscale data centers - Market size and forecast 2024-2029 ($ million)
- Exhibits61: Data Table on Hyperscale data centers - Market size and forecast 2024-2029 ($ million)
- Exhibits62: Chart on Hyperscale data centers - Year-over-year growth 2024-2029 (%)
- Exhibits63: Data Table on Hyperscale data centers - Year-over-year growth 2024-2029 (%)
- Exhibits64: Chart on Colocation data centers - Market size and forecast 2024-2029 ($ million)
- Exhibits65: Data Table on Colocation data centers - Market size and forecast 2024-2029 ($ million)
- Exhibits66: Chart on Colocation data centers - Year-over-year growth 2024-2029 (%)
- Exhibits67: Data Table on Colocation data centers - Year-over-year growth 2024-2029 (%)
- Exhibits68: Chart on Others - Market size and forecast 2024-2029 ($ million)
- Exhibits69: Data Table on Others - Market size and forecast 2024-2029 ($ million)
- Exhibits70: Chart on Others - Year-over-year growth 2024-2029 (%)
- Exhibits71: Data Table on Others - Year-over-year growth 2024-2029 (%)
- Exhibits72: Market opportunity by End-user ($ million)
- Exhibits73: Data Table on Market opportunity by End-user ($ million)
- Exhibits74: Chart on Component - Market share 2024-2029 (%)
- Exhibits75: Data Table on Component - Market share 2024-2029 (%)
- Exhibits76: Chart on Comparison by Component
- Exhibits77: Data Table on Comparison by Component
- Exhibits78: Chart on Solutions - Market size and forecast 2024-2029 ($ million)
- Exhibits79: Data Table on Solutions - Market size and forecast 2024-2029 ($ million)
- Exhibits80: Chart on Solutions - Year-over-year growth 2024-2029 (%)
- Exhibits81: Data Table on Solutions - Year-over-year growth 2024-2029 (%)
- Exhibits82: Chart on Services - Market size and forecast 2024-2029 ($ million)
- Exhibits83: Data Table on Services - Market size and forecast 2024-2029 ($ million)
- Exhibits84: Chart on Services - Year-over-year growth 2024-2029 (%)
- Exhibits85: Data Table on Services - Year-over-year growth 2024-2029 (%)
- Exhibits86: Market opportunity by Component ($ million)
- Exhibits87: Data Table on Market opportunity by Component ($ million)
- Exhibits88: Analysis of price sensitivity, lifecycle, customer purchase basket, adoption rates, and purchase criteria
- Exhibits89: Chart on Market share By Geographical Landscape 2024-2029 (%)
- Exhibits90: Data Table on Market share By Geographical Landscape 2024-2029 (%)
- Exhibits91: Chart on Geographic comparison
- Exhibits92: Data Table on Geographic comparison
- Exhibits93: Chart on North America - Market size and forecast 2024-2029 ($ million)
- Exhibits94: Data Table on North America - Market size and forecast 2024-2029 ($ million)
- Exhibits95: Chart on North America - Year-over-year growth 2024-2029 (%)
- Exhibits96: Data Table on North America - Year-over-year growth 2024-2029 (%)
- Exhibits97: Chart on APAC - Market size and forecast 2024-2029 ($ million)
- Exhibits98: Data Table on APAC - Market size and forecast 2024-2029 ($ million)
- Exhibits99: Chart on APAC - Year-over-year growth 2024-2029 (%)
- Exhibits100: Data Table on APAC - Year-over-year growth 2024-2029 (%)
- Exhibits101: Chart on Europe - Market size and forecast 2024-2029 ($ million)
- Exhibits102: Data Table on Europe - Market size and forecast 2024-2029 ($ million)
- Exhibits103: Chart on Europe - Year-over-year growth 2024-2029 (%)
- Exhibits104: Data Table on Europe - Year-over-year growth 2024-2029 (%)
- Exhibits105: Chart on South America - Market size and forecast 2024-2029 ($ million)
- Exhibits106: Data Table on South America - Market size and forecast 2024-2029 ($ million)
- Exhibits107: Chart on South America - Year-over-year growth 2024-2029 (%)
- Exhibits108: Data Table on South America - Year-over-year growth 2024-2029 (%)
- Exhibits109: Chart on Middle East and Africa - Market size and forecast 2024-2029 ($ million)
- Exhibits110: Data Table on Middle East and Africa - Market size and forecast 2024-2029 ($ million)
- Exhibits111: Chart on Middle East and Africa - Year-over-year growth 2024-2029 (%)
- Exhibits112: Data Table on Middle East and Africa - Year-over-year growth 2024-2029 (%)
- Exhibits113: Chart on US - Market size and forecast 2024-2029 ($ million)
- Exhibits114: Data Table on US - Market size and forecast 2024-2029 ($ million)
- Exhibits115: Chart on US - Year-over-year growth 2024-2029 (%)
- Exhibits116: Data Table on US - Year-over-year growth 2024-2029 (%)
- Exhibits117: Chart on China - Market size and forecast 2024-2029 ($ million)
- Exhibits118: Data Table on China - Market size and forecast 2024-2029 ($ million)
- Exhibits119: Chart on China - Year-over-year growth 2024-2029 (%)
- Exhibits120: Data Table on China - Year-over-year growth 2024-2029 (%)
- Exhibits121: Chart on Germany - Market size and forecast 2024-2029 ($ million)
- Exhibits122: Data Table on Germany - Market size and forecast 2024-2029 ($ million)
- Exhibits123: Chart on Germany - Year-over-year growth 2024-2029 (%)
- Exhibits124: Data Table on Germany - Year-over-year growth 2024-2029 (%)
- Exhibits125: Chart on Canada - Market size and forecast 2024-2029 ($ million)
- Exhibits126: Data Table on Canada - Market size and forecast 2024-2029 ($ million)
- Exhibits127: Chart on Canada - Year-over-year growth 2024-2029 (%)
- Exhibits128: Data Table on Canada - Year-over-year growth 2024-2029 (%)
- Exhibits129: Chart on Japan - Market size and forecast 2024-2029 ($ million)
- Exhibits130: Data Table on Japan - Market size and forecast 2024-2029 ($ million)
- Exhibits131: Chart on Japan - Year-over-year growth 2024-2029 (%)
- Exhibits132: Data Table on Japan - Year-over-year growth 2024-2029 (%)
- Exhibits133: Chart on UK - Market size and forecast 2024-2029 ($ million)
- Exhibits134: Data Table on UK - Market size and forecast 2024-2029 ($ million)
- Exhibits135: Chart on UK - Year-over-year growth 2024-2029 (%)
- Exhibits136: Data Table on UK - Year-over-year growth 2024-2029 (%)
- Exhibits137: Chart on India - Market size and forecast 2024-2029 ($ million)
- Exhibits138: Data Table on India - Market size and forecast 2024-2029 ($ million)
- Exhibits139: Chart on India - Year-over-year growth 2024-2029 (%)
- Exhibits140: Data Table on India - Year-over-year growth 2024-2029 (%)
- Exhibits141: Chart on France - Market size and forecast 2024-2029 ($ million)
- Exhibits142: Data Table on France - Market size and forecast 2024-2029 ($ million)
- Exhibits143: Chart on France - Year-over-year growth 2024-2029 (%)
- Exhibits144: Data Table on France - Year-over-year growth 2024-2029 (%)
- Exhibits145: Chart on The Netherlands - Market size and forecast 2024-2029 ($ million)
- Exhibits146: Data Table on The Netherlands - Market size and forecast 2024-2029 ($ million)
- Exhibits147: Chart on The Netherlands - Year-over-year growth 2024-2029 (%)
- Exhibits148: Data Table on The Netherlands - Year-over-year growth 2024-2029 (%)
- Exhibits149: Chart on Australia - Market size and forecast 2024-2029 ($ million)
- Exhibits150: Data Table on Australia - Market size and forecast 2024-2029 ($ million)
- Exhibits151: Chart on Australia - Year-over-year growth 2024-2029 (%)
- Exhibits152: Data Table on Australia - Year-over-year growth 2024-2029 (%)
- Exhibits153: Market opportunity By Geographical Landscape ($ million)
- Exhibits154: Data Tables on Market opportunity By Geographical Landscape ($ million)
- Exhibits155: Impact of drivers and challenges in 2024 and 2029
- Exhibits156: Overview on criticality of inputs and factors of differentiation
- Exhibits157: Overview on factors of disruption
- Exhibits158: Impact of key risks on business
- Exhibits159: Companies covered
- Exhibits160: Company ranking index
- Exhibits161: Matrix on companies position and classification
- Exhibits162: Asetek - Overview
- Exhibits163: Asetek - Product / Service
- Exhibits164: Asetek - Key offerings
- Exhibits165: SWOT
- Exhibits166: Coolit Systems - Overview
- Exhibits167: Coolit Systems - Product / Service
- Exhibits168: Coolit Systems - Key offerings
- Exhibits169: SWOT
- Exhibits170: Daikin Industries Ltd. - Overview
- Exhibits171: Daikin Industries Ltd. - Business segments
- Exhibits172: Daikin Industries Ltd. - Key news
- Exhibits173: Daikin Industries Ltd. - Key offerings
- Exhibits174: Daikin Industries Ltd. - Segment focus
- Exhibits175: SWOT
- Exhibits176: Delta Electronics Inc. - Overview
- Exhibits177: Delta Electronics Inc. - Business segments
- Exhibits178: Delta Electronics Inc. - Key news
- Exhibits179: Delta Electronics Inc. - Key offerings
- Exhibits180: Delta Electronics Inc. - Segment focus
- Exhibits181: SWOT
- Exhibits182: Green Revolution Cooling Inc. - Overview
- Exhibits183: Green Revolution Cooling Inc. - Product / Service
- Exhibits184: Green Revolution Cooling Inc. - Key offerings
- Exhibits185: SWOT
- Exhibits186: Hewlett Packard Enterprise Co. - Overview
- Exhibits187: Hewlett Packard Enterprise Co. - Business segments
- Exhibits188: Hewlett Packard Enterprise Co. - Key news
- Exhibits189: Hewlett Packard Enterprise Co. - Key offerings
- Exhibits190: Hewlett Packard Enterprise Co. - Segment focus
- Exhibits191: SWOT
- Exhibits192: Iceotope Technologies Ltd. - Overview
- Exhibits193: Iceotope Technologies Ltd. - Product / Service
- Exhibits194: Iceotope Technologies Ltd. - Key offerings
- Exhibits195: SWOT
- Exhibits196: Lenovo Group Ltd. - Overview
- Exhibits197: Lenovo Group Ltd. - Business segments
- Exhibits198: Lenovo Group Ltd. - Key news
- Exhibits199: Lenovo Group Ltd. - Key offerings
- Exhibits200: Lenovo Group Ltd. - Segment focus
- Exhibits201: SWOT
- Exhibits202: LiquidCool Solutions - Overview
- Exhibits203: LiquidCool Solutions - Product / Service
- Exhibits204: LiquidCool Solutions - Key offerings
- Exhibits205: SWOT
- Exhibits206: LiquidStack BV - Overview
- Exhibits207: LiquidStack BV - Product / Service
- Exhibits208: LiquidStack BV - Key offerings
- Exhibits209: SWOT
- Exhibits210: Rittal GmbH and Co. KG - Overview
- Exhibits211: Rittal GmbH and Co. KG - Product / Service
- Exhibits212: Rittal GmbH and Co. KG - Key offerings
- Exhibits213: SWOT
- Exhibits214: Schneider Electric SE - Overview
- Exhibits215: Schneider Electric SE - Business segments
- Exhibits216: Schneider Electric SE - Key news
- Exhibits217: Schneider Electric SE - Key offerings
- Exhibits218: Schneider Electric SE - Segment focus
- Exhibits219: SWOT
- Exhibits220: STULZ GmbH - Overview
- Exhibits221: STULZ GmbH - Product / Service
- Exhibits222: STULZ GmbH - Key offerings
- Exhibits223: SWOT
- Exhibits224: Super Micro Computer Inc. - Overview
- Exhibits225: Super Micro Computer Inc. - Business segments
- Exhibits226: Super Micro Computer Inc. - Key news
- Exhibits227: Super Micro Computer Inc. - Key offerings
- Exhibits228: Super Micro Computer Inc. - Segment focus
- Exhibits229: SWOT
- Exhibits230: Vertiv Holdings Co. - Overview
- Exhibits231: Vertiv Holdings Co. - Business segments
- Exhibits232: Vertiv Holdings Co. - Key offerings
- Exhibits233: Vertiv Holdings Co. - Segment focus
- Exhibits234: SWOT
- Exhibits235: Inclusions checklist
- Exhibits236: Exclusions checklist
- Exhibits237: Currency conversion rates for US$
- Exhibits238: Research methodology
- Exhibits239: Information sources
- Exhibits240: Data validation
- Exhibits241: Validation techniques employed for market sizing
- Exhibits242: Data synthesis
- Exhibits243: 360 degree market analysis
- Exhibits244: List of abbreviations
The liquid cooling for ai data centers market is forecasted to grow by USD 1,876.6 mn during 2024-2029, accelerating at a CAGR of 31.4% during the forecast period. The report on the liquid cooling for ai data centers market provides a holistic analysis, market size and forecast, trends, growth drivers, and challenges, as well as vendor analysis covering around 25 vendors.
The report offers an up-to-date analysis regarding the current market scenario, the latest trends and drivers, and the overall market environment. The market is driven by escalating thermal design power and compute density of ai accelerators, imperative for energy efficiency, sustainability, and operational expenditure reduction, and massive strategic investments in sovereign and corporate ai supremacy.
| Market Scope | |
|---|---|
| Base Year | 2025 |
| End Year | 2029 |
| Series Year | 2025-2029 |
| Growth Momentum | Accelerate |
| YOY 2025 | 29.5% |
| CAGR | 31.4% |
| Incremental Value | $1,876.6 mn |
The study was conducted using an objective combination of primary and secondary information including inputs from key participants in the industry. The report contains a comprehensive market size data, segment with regional analysis and vendor landscape in addition to an analysis of the key companies. Reports have historic and forecast data.
Technavio's liquid cooling for ai data centers market is segmented as below:
By Type
- Cold plate cooling
- Immersion cooling
- Spray liquid cooling
By End-user
- Hyperscale data centers
- Colocation data centers
- Others
By Component
- Solutions
- Services
By Geographical Landscape
- North America
- APAC
- Europe
- South America
- Middle East and Africa
This study identifies the rise of hybrid cooling architectures for pragmatic deployment as one of the prime reasons driving the liquid cooling for ai data centers market growth during the next few years. Also, growing momentum for immersion cooling as the ultimate density and sustainability solution and drive toward standardization and ecosystem collaboration will lead to sizable demand in the market.
The report on the liquid cooling for ai data centers market covers the following areas:
- Liquid Cooling For AI Data Centers Market sizing
- Liquid Cooling For AI Data Centers Market forecast
- Liquid Cooling For AI Data Centers Market industry analysis
The robust vendor analysis is designed to help clients improve their market position, and in line with this, this report provides a detailed analysis of several leading liquid cooling for ai data centers market vendors that include Asetek, Coolit Systems, Daikin Industries Ltd., Delta Electronics Inc., Green Revolution Cooling Inc., Hewlett Packard Enterprise Co., Iceotope Technologies Ltd., Lenovo Group Ltd., LiquidCool Solutions, LiquidStack BV, Nortek, Rittal GmbH and Co. KG, Schneider Electric SE, STULZ GmbH, Submer Technologies SL, Super Micro Computer Inc., Vertiv Holdings Co., and ZutaCore, Inc.. Also, the liquid cooling for ai data centers market analysis report includes information on upcoming trends and challenges that will influence market growth. This is to help companies strategize and leverage all forthcoming growth opportunities.
The publisher presents a detailed picture of the market by the way of study, synthesis, and summation of data from multiple sources by an analysis of key parameters such as profit, pricing, competition, and promotions. It presents various market facets by identifying the key industry influencers. The data presented is comprehensive, reliable, and a result of extensive primary and secondary research. The market research reports provide a complete competitive landscape and an in-depth vendor selection methodology and analysis using qualitative and quantitative research to forecast accurate market growth.
Table of Contents
1 Executive Summary
- 1.1 Market overview
- Executive Summary - Chart on Market Overview
- Executive Summary - Data Table on Market Overview
- Executive Summary - Chart on Global Market Characteristics
- Executive Summary - Chart on Market By Geographical Landscape
- Executive Summary - Chart on Market Segmentation by Type
- Executive Summary - Chart on Market Segmentation by End-user
- Executive Summary - Chart on Market Segmentation by Component
- Executive Summary - Chart on Incremental Growth
- Executive Summary - Data Table on Incremental Growth
- Executive Summary - Chart on Company Market Positioning
2 Technavio Analysis
- 2.1 Analysis of price sensitivity, lifecycle, customer purchase basket, adoption rates, and purchase criteria
- Analysis of price sensitivity, lifecycle, customer purchase basket, adoption rates, and purchase criteria
- 2.2 Criticality of inputs and Factors of differentiation
- Overview on criticality of inputs and factors of differentiation
- 2.3 Factors of disruption
- Overview on factors of disruption
- 2.4 Impact of drivers and challenges
- Impact of drivers and challenges in 2024 and 2029
3 Market Landscape
- 3.1 Market ecosystem
- Parent Market
- Data Table on - Parent Market
- 3.2 Market characteristics
- Market characteristics analysis
- 3.3 Value chain analysis
- Value chain analysis
4 Market Sizing
- 4.1 Market definition
- Offerings of companies included in the market definition
- 4.2 Market segment analysis
- Market segments
- 4.3 Market size 2024
- 4.4 Market outlook: Forecast for 2024-2029
- Chart on Global - Market size and forecast 2024-2029 ($ million)
- Data Table on Global - Market size and forecast 2024-2029 ($ million)
- Chart on Global Market: Year-over-year growth 2024-2029 (%)
- Data Table on Global Market: Year-over-year growth 2024-2029 (%)
5 Historic Market Size
- 5.1 Global Liquid Cooling For AI Data Centers Market 2019 - 2023
- Historic Market Size - Data Table on Global Liquid Cooling For AI Data Centers Market 2019 - 2023 ($ million)
- 5.2 Type segment analysis 2019 - 2023
- Historic Market Size - Type Segment 2019 - 2023 ($ million)
- 5.3 End-user segment analysis 2019 - 2023
- Historic Market Size - End-user Segment 2019 - 2023 ($ million)
- 5.4 Component segment analysis 2019 - 2023
- Historic Market Size - Component Segment 2019 - 2023 ($ million)
- 5.5 Geography segment analysis 2019 - 2023
- Historic Market Size - Geography Segment 2019 - 2023 ($ million)
- 5.6 Country segment analysis 2019 - 2023
- Historic Market Size - Country Segment 2019 - 2023 ($ million)
6 Five Forces Analysis
- 6.1 Five forces summary
- Five forces analysis - Comparison between 2024 and 2029
- 6.2 Bargaining power of buyers
- Bargaining power of buyers - Impact of key factors 2024 and 2029
- 6.3 Bargaining power of suppliers
- Bargaining power of suppliers - Impact of key factors in 2024 and 2029
- 6.4 Threat of new entrants
- Threat of new entrants - Impact of key factors in 2024 and 2029
- 6.5 Threat of substitutes
- Threat of substitutes - Impact of key factors in 2024 and 2029
- 6.6 Threat of rivalry
- Threat of rivalry - Impact of key factors in 2024 and 2029
- 6.7 Market condition
- Chart on Market condition - Five forces 2024 and 2029
7 Market Segmentation by Type
- 7.1 Market segments
- Chart on Type - Market share 2024-2029 (%)
- Data Table on Type - Market share 2024-2029 (%)
- 7.2 Comparison by Type
- Chart on Comparison by Type
- Data Table on Comparison by Type
- 7.3 Cold plate cooling - Market size and forecast 2024-2029
- Chart on Cold plate cooling - Market size and forecast 2024-2029 ($ million)
- Data Table on Cold plate cooling - Market size and forecast 2024-2029 ($ million)
- Chart on Cold plate cooling - Year-over-year growth 2024-2029 (%)
- Data Table on Cold plate cooling - Year-over-year growth 2024-2029 (%)
- 7.4 Immersion cooling - Market size and forecast 2024-2029
- Chart on Immersion cooling - Market size and forecast 2024-2029 ($ million)
- Data Table on Immersion cooling - Market size and forecast 2024-2029 ($ million)
- Chart on Immersion cooling - Year-over-year growth 2024-2029 (%)
- Data Table on Immersion cooling - Year-over-year growth 2024-2029 (%)
- 7.5 Spray liquid cooling - Market size and forecast 2024-2029
- Chart on Spray liquid cooling - Market size and forecast 2024-2029 ($ million)
- Data Table on Spray liquid cooling - Market size and forecast 2024-2029 ($ million)
- Chart on Spray liquid cooling - Year-over-year growth 2024-2029 (%)
- Data Table on Spray liquid cooling - Year-over-year growth 2024-2029 (%)
- 7.6 Market opportunity by Type
- Market opportunity by Type ($ million)
- Data Table on Market opportunity by Type ($ million)
8 Market Segmentation by End-user
- 8.1 Market segments
- Chart on End-user - Market share 2024-2029 (%)
- Data Table on End-user - Market share 2024-2029 (%)
- 8.2 Comparison by End-user
- Chart on Comparison by End-user
- Data Table on Comparison by End-user
- 8.3 Hyperscale data centers - Market size and forecast 2024-2029
- Chart on Hyperscale data centers - Market size and forecast 2024-2029 ($ million)
- Data Table on Hyperscale data centers - Market size and forecast 2024-2029 ($ million)
- Chart on Hyperscale data centers - Year-over-year growth 2024-2029 (%)
- Data Table on Hyperscale data centers - Year-over-year growth 2024-2029 (%)
- 8.4 Colocation data centers - Market size and forecast 2024-2029
- Chart on Colocation data centers - Market size and forecast 2024-2029 ($ million)
- Data Table on Colocation data centers - Market size and forecast 2024-2029 ($ million)
- Chart on Colocation data centers - Year-over-year growth 2024-2029 (%)
- Data Table on Colocation data centers - Year-over-year growth 2024-2029 (%)
- 8.5 Others - Market size and forecast 2024-2029
- Chart on Others - Market size and forecast 2024-2029 ($ million)
- Data Table on Others - Market size and forecast 2024-2029 ($ million)
- Chart on Others - Year-over-year growth 2024-2029 (%)
- Data Table on Others - Year-over-year growth 2024-2029 (%)
- 8.6 Market opportunity by End-user
- Market opportunity by End-user ($ million)
- Data Table on Market opportunity by End-user ($ million)
9 Market Segmentation by Component
- 9.1 Market segments
- Chart on Component - Market share 2024-2029 (%)
- Data Table on Component - Market share 2024-2029 (%)
- 9.2 Comparison by Component
- Chart on Comparison by Component
- Data Table on Comparison by Component
- 9.3 Solutions - Market size and forecast 2024-2029
- Chart on Solutions - Market size and forecast 2024-2029 ($ million)
- Data Table on Solutions - Market size and forecast 2024-2029 ($ million)
- Chart on Solutions - Year-over-year growth 2024-2029 (%)
- Data Table on Solutions - Year-over-year growth 2024-2029 (%)
- 9.4 Services - Market size and forecast 2024-2029
- Chart on Services - Market size and forecast 2024-2029 ($ million)
- Data Table on Services - Market size and forecast 2024-2029 ($ million)
- Chart on Services - Year-over-year growth 2024-2029 (%)
- Data Table on Services - Year-over-year growth 2024-2029 (%)
- 9.5 Market opportunity by Component
- Market opportunity by Component ($ million)
- Data Table on Market opportunity by Component ($ million)
10 Customer Landscape
- 10.1 Customer landscape overview
- Analysis of price sensitivity, lifecycle, customer purchase basket, adoption rates, and purchase criteria
11 Geographic Landscape
- 11.1 Geographic segmentation
- Chart on Market share By Geographical Landscape 2024-2029 (%)
- Data Table on Market share By Geographical Landscape 2024-2029 (%)
- 11.2 Geographic comparison
- Chart on Geographic comparison
- Data Table on Geographic comparison
- 11.3 North America - Market size and forecast 2024-2029
- Chart on North America - Market size and forecast 2024-2029 ($ million)
- Data Table on North America - Market size and forecast 2024-2029 ($ million)
- Chart on North America - Year-over-year growth 2024-2029 (%)
- Data Table on North America - Year-over-year growth 2024-2029 (%)
- 11.4 APAC - Market size and forecast 2024-2029
- Chart on APAC - Market size and forecast 2024-2029 ($ million)
- Data Table on APAC - Market size and forecast 2024-2029 ($ million)
- Chart on APAC - Year-over-year growth 2024-2029 (%)
- Data Table on APAC - Year-over-year growth 2024-2029 (%)
- 11.5 Europe - Market size and forecast 2024-2029
- Chart on Europe - Market size and forecast 2024-2029 ($ million)
- Data Table on Europe - Market size and forecast 2024-2029 ($ million)
- Chart on Europe - Year-over-year growth 2024-2029 (%)
- Data Table on Europe - Year-over-year growth 2024-2029 (%)
- 11.6 South America - Market size and forecast 2024-2029
- Chart on South America - Market size and forecast 2024-2029 ($ million)
- Data Table on South America - Market size and forecast 2024-2029 ($ million)
- Chart on South America - Year-over-year growth 2024-2029 (%)
- Data Table on South America - Year-over-year growth 2024-2029 (%)
- 11.7 Middle East and Africa - Market size and forecast 2024-2029
- Chart on Middle East and Africa - Market size and forecast 2024-2029 ($ million)
- Data Table on Middle East and Africa - Market size and forecast 2024-2029 ($ million)
- Chart on Middle East and Africa - Year-over-year growth 2024-2029 (%)
- Data Table on Middle East and Africa - Year-over-year growth 2024-2029 (%)
- 11.8 US - Market size and forecast 2024-2029
- Chart on US - Market size and forecast 2024-2029 ($ million)
- Data Table on US - Market size and forecast 2024-2029 ($ million)
- Chart on US - Year-over-year growth 2024-2029 (%)
- Data Table on US - Year-over-year growth 2024-2029 (%)
- 11.9 China - Market size and forecast 2024-2029
- Chart on China - Market size and forecast 2024-2029 ($ million)
- Data Table on China - Market size and forecast 2024-2029 ($ million)
- Chart on China - Year-over-year growth 2024-2029 (%)
- Data Table on China - Year-over-year growth 2024-2029 (%)
- 11.10 Germany - Market size and forecast 2024-2029
- Chart on Germany - Market size and forecast 2024-2029 ($ million)
- Data Table on Germany - Market size and forecast 2024-2029 ($ million)
- Chart on Germany - Year-over-year growth 2024-2029 (%)
- Data Table on Germany - Year-over-year growth 2024-2029 (%)
- 11.11 Canada - Market size and forecast 2024-2029
- Chart on Canada - Market size and forecast 2024-2029 ($ million)
- Data Table on Canada - Market size and forecast 2024-2029 ($ million)
- Chart on Canada - Year-over-year growth 2024-2029 (%)
- Data Table on Canada - Year-over-year growth 2024-2029 (%)
- 11.12 Japan - Market size and forecast 2024-2029
- Chart on Japan - Market size and forecast 2024-2029 ($ million)
- Data Table on Japan - Market size and forecast 2024-2029 ($ million)
- Chart on Japan - Year-over-year growth 2024-2029 (%)
- Data Table on Japan - Year-over-year growth 2024-2029 (%)
- 11.13 UK - Market size and forecast 2024-2029
- Chart on UK - Market size and forecast 2024-2029 ($ million)
- Data Table on UK - Market size and forecast 2024-2029 ($ million)
- Chart on UK - Year-over-year growth 2024-2029 (%)
- Data Table on UK - Year-over-year growth 2024-2029 (%)
- 11.14 India - Market size and forecast 2024-2029
- Chart on India - Market size and forecast 2024-2029 ($ million)
- Data Table on India - Market size and forecast 2024-2029 ($ million)
- Chart on India - Year-over-year growth 2024-2029 (%)
- Data Table on India - Year-over-year growth 2024-2029 (%)
- 11.15 France - Market size and forecast 2024-2029
- Chart on France - Market size and forecast 2024-2029 ($ million)
- Data Table on France - Market size and forecast 2024-2029 ($ million)
- Chart on France - Year-over-year growth 2024-2029 (%)
- Data Table on France - Year-over-year growth 2024-2029 (%)
- 11.16 The Netherlands - Market size and forecast 2024-2029
- Chart on The Netherlands - Market size and forecast 2024-2029 ($ million)
- Data Table on The Netherlands - Market size and forecast 2024-2029 ($ million)
- Chart on The Netherlands - Year-over-year growth 2024-2029 (%)
- Data Table on The Netherlands - Year-over-year growth 2024-2029 (%)
- 11.17 Australia - Market size and forecast 2024-2029
- Chart on Australia - Market size and forecast 2024-2029 ($ million)
- Data Table on Australia - Market size and forecast 2024-2029 ($ million)
- Chart on Australia - Year-over-year growth 2024-2029 (%)
- Data Table on Australia - Year-over-year growth 2024-2029 (%)
- 11.18 Market opportunity By Geographical Landscape
- Market opportunity By Geographical Landscape ($ million)
- Data Tables on Market opportunity By Geographical Landscape ($ million)
12 Drivers, Challenges, and Opportunity/Restraints
- 12.1 Market drivers
- 12.2 Market challenges
- 12.3 Impact of drivers and challenges
- Impact of drivers and challenges in 2024 and 2029
- 12.4 Market opportunities/restraints
13 Competitive Landscape
- 13.1 Overview
- 13.2 Competitive Landscape
- Overview on criticality of inputs and factors of differentiation
- 13.3 Landscape disruption
- Overview on factors of disruption
- 13.4 Industry risks
- Impact of key risks on business
14 Competitive Analysis
- 14.1 Companies profiled
- Companies covered
- 14.2 Company ranking index
- Company ranking index
- 14.3 Market positioning of companies
- Matrix on companies position and classification
- 14.4 Asetek
- Asetek - Overview
- Asetek - Product / Service
- Asetek - Key offerings
- SWOT
- 14.5 Coolit Systems
- Coolit Systems - Overview
- Coolit Systems - Product / Service
- Coolit Systems - Key offerings
- SWOT
- 14.6 Daikin Industries Ltd.
- Daikin Industries Ltd. - Overview
- Daikin Industries Ltd. - Business segments
- Daikin Industries Ltd. - Key news
- Daikin Industries Ltd. - Key offerings
- Daikin Industries Ltd. - Segment focus
- SWOT
- 14.7 Delta Electronics Inc.
- Delta Electronics Inc. - Overview
- Delta Electronics Inc. - Business segments
- Delta Electronics Inc. - Key news
- Delta Electronics Inc. - Key offerings
- Delta Electronics Inc. - Segment focus
- SWOT
- 14.8 Green Revolution Cooling Inc.
- Green Revolution Cooling Inc. - Overview
- Green Revolution Cooling Inc. - Product / Service
- Green Revolution Cooling Inc. - Key offerings
- SWOT
- 14.9 Hewlett Packard Enterprise Co.
- Hewlett Packard Enterprise Co. - Overview
- Hewlett Packard Enterprise Co. - Business segments
- Hewlett Packard Enterprise Co. - Key news
- Hewlett Packard Enterprise Co. - Key offerings
- Hewlett Packard Enterprise Co. - Segment focus
- SWOT
- 14.10 Iceotope Technologies Ltd.
- Iceotope Technologies Ltd. - Overview
- Iceotope Technologies Ltd. - Product / Service
- Iceotope Technologies Ltd. - Key offerings
- SWOT
- 14.11 Lenovo Group Ltd.
- Lenovo Group Ltd. - Overview
- Lenovo Group Ltd. - Business segments
- Lenovo Group Ltd. - Key news
- Lenovo Group Ltd. - Key offerings
- Lenovo Group Ltd. - Segment focus
- SWOT
- 14.12 LiquidCool Solutions
- LiquidCool Solutions - Overview
- LiquidCool Solutions - Product / Service
- LiquidCool Solutions - Key offerings
- SWOT
- 14.13 LiquidStack BV
- LiquidStack BV - Overview
- LiquidStack BV - Product / Service
- LiquidStack BV - Key offerings
- SWOT
- 14.14 Rittal GmbH and Co. KG
- Rittal GmbH and Co. KG - Overview
- Rittal GmbH and Co. KG - Product / Service
- Rittal GmbH and Co. KG - Key offerings
- SWOT
- 14.15 Schneider Electric SE
- Schneider Electric SE - Overview
- Schneider Electric SE - Business segments
- Schneider Electric SE - Key news
- Schneider Electric SE - Key offerings
- Schneider Electric SE - Segment focus
- SWOT
- 14.16 STULZ GmbH
- STULZ GmbH - Overview
- STULZ GmbH - Product / Service
- STULZ GmbH - Key offerings
- SWOT
- 14.17 Super Micro Computer Inc.
- Super Micro Computer Inc. - Overview
- Super Micro Computer Inc. - Business segments
- Super Micro Computer Inc. - Key news
- Super Micro Computer Inc. - Key offerings
- Super Micro Computer Inc. - Segment focus
- SWOT
- 14.18 Vertiv Holdings Co.
- Vertiv Holdings Co. - Overview
- Vertiv Holdings Co. - Business segments
- Vertiv Holdings Co. - Key offerings
- Vertiv Holdings Co. - Segment focus
- SWOT
15 Appendix
- 15.1 Scope of the report
- 15.2 Inclusions and exclusions checklist
- Inclusions checklist
- Exclusions checklist
- 15.3 Currency conversion rates for US$
- Currency conversion rates for US$
- 15.4 Research methodology
- Research methodology
- 15.5 Data procurement
- Information sources
- 15.6 Data validation
- Data validation
- 15.7 Validation techniques employed for market sizing
- Validation techniques employed for market sizing
- 15.8 Data synthesis
- Data synthesis
- 15.9 360 degree market analysis
- 360 degree market analysis
- 15.10 List of abbreviations
- List of abbreviations
