|
|
市場調査レポート
商品コード
1678465
ペット向けリハビリテーションサービスの世界市場規模、シェア、動向分析レポート:動物別、治療法別、適応症別、最終用途別、地域別、セグメント別予測(2025年~2030年)Companion Animal Rehabilitation Services Market Size, Share & Trends Analysis Report By Animal, By Therapy, By Indication, By End-use, By Region, And Segment Forecasts, 2025 - 2030 |
||||||
|
|||||||
カスタマイズ可能
|
|||||||

| ペット向けリハビリテーションサービスの世界市場規模、シェア、動向分析レポート:動物別、治療法別、適応症別、最終用途別、地域別、セグメント別予測(2025年~2030年) |
|
出版日: 2025年02月04日
発行: Grand View Research
ページ情報: 英文 130 Pages
納期: 2~10営業日
|

全表示
- 概要
- 図表
- 目次
ペット向けリハビリテーションサービス市場の成長と動向:
Grand View Research, Inc.の最新レポートによると、世界のペット向けリハビリテーションサービスの市場規模は、2025年~2030年に11.77%のCAGRを記録し、2030年までに12億1,985万米ドルに達すると推定されています。
動物リハビリテーターの数の増加、ペットの整形外科的および筋骨格系の問題の有病率の増加、ペットの飼育率の大幅な上昇、ペットの人間化動向の上昇、薬物を使用しない非侵襲的なリハビリ治療の利点に関する飼い主の意識の高まりは、市場成長を促進する要因の一部です。
リハビリテーションサービスは、ペットに、協調性とバランスの改善、可動域の拡大、筋力の増加、肥満のペットの減量、手術後の痛みや炎症の軽減など、多くの利点を提供するために、非常に考慮されています。ペットの犬猫におけるリハビリテーションの主な目的は、治癒を早め、痛みや不快感を軽減し、健康状態を改善することです。いくつかのペットケアセンターでは、動物が怪我や慢性疾患、手術から回復するのを助けるために、幅広いプログラムを備えた高度なリハビリテーションサービスを提供しています。
ペットのリハビリテーション治療は、ニッチなサービスから人気のある獣医学的治療オプションになるために、過去数年間で進化してきました。これは、指示された運動でペットの全体的な健康と運動能力を向上させるために、非侵襲的な技術の範囲を利用しています。先進経済諸国と新興経済諸国の両方において、その利用可能性と認知度が高まっているため、リハビリテーションサービスは、人間と同様に動物においてもかなり提供されています。スポーツ活動に従事している犬や馬は、患者のコンプライアンスが高く、リハビリテーションサービスの恩恵を受けていることが広く知られています。ペットのリハビリテーション治療は、より長い間、業界にありましたが、最近、単独で、またはいくつかの他の治療と一緒に、利益を最大化するために、その治療の進歩により需要が増加しています。
米国獣医科大学が2022年2月に発表した論文によると、国内の総ペット個体数の半数以上が老年期にあると推定されています。これらの動物の多くは、予想される寿命の終わりに達すると、運動能力の問題や関節炎のような他の慢性疾患を抱えていると考えられています。そのため、ほとんどのペットの飼い主は、シニアのペットが動き回ったり、起き上がったりするときに少し硬くなり始めたら、リハビリテーションという選択肢を好みます。バレー・アニマル・リハビリテーションによると、高齢のペットは運動能力が低下するため太りやすく、肥満や心臓病、糖尿病になりやすいとのことです。ハイドロセラピーなどのリハビリ技術は、動物が体重を減らし、そのような致命的な状態を早期に予防するのに役立ちます。
COVID-19の大流行時には、ペットケアへのアクセスが制限されたリハビリセンターの閉鎖により、市場はマイナスの影響を受けました。全国的なロックダウンと移動制限の発表により、ペットのリハビリ業者と動物の飼い主は、2020年の間に非侵襲的な療法を得る上で障害に直面することになりました。しかし、翌年には規制が緩和され、ペットの飼育率や所有率も上昇したため、市場は急速に回復しました。
加えて、ペット向けリハビリテーションサービス市場は、先進地域におけるペット理学療法センターの大きな存在によってさらに促進されています。例えば、米国のBeach Animal Rehabilitation Centerは、水中や地上のトレッドミル、鍼治療、犬猫のためのガイド付きエクササイズなど、トップクラスのリハビリ療法を提供しています。同様に、市場の他のいくつかの企業は、痛みのない生活の恩恵を受け、ペットの幸福を高めるために努力しています。
ペット向けリハビリテーションサービス市場レポートのハイライト
- 動物別では、犬セグメントが2024年に54.73%の最大市場シェアを占め、これは犬の整形外科的疾患や加齢関連疾患の有病率の高さ、および世界的な飼育数の増加によって促進されました。
- 猫セグメントは、予測期間中に12.64%の最速CAGRを記録すると予想され、猫特有の健康ニーズの意識の高まりと猫の慢性疾患の有病率の上昇に起因します。
- 最終用途別では、獣医リハビリセンター&病院セグメントは2024年に市場を独占しました。
- レスキュー&シェルター施設セグメントは、予測期間中に12.52%の最速CAGRで成長すると予測されています。
- 2024年には、北米が40.90%の収益シェアで最大のシェアを占めました。
目次
第1章 調査手法と範囲
第2章 エグゼクティブサマリー
第3章 ペット向けリハビリテーションサービス市場の変数、動向、範囲
- 市場系統の見通し
- 市場力学
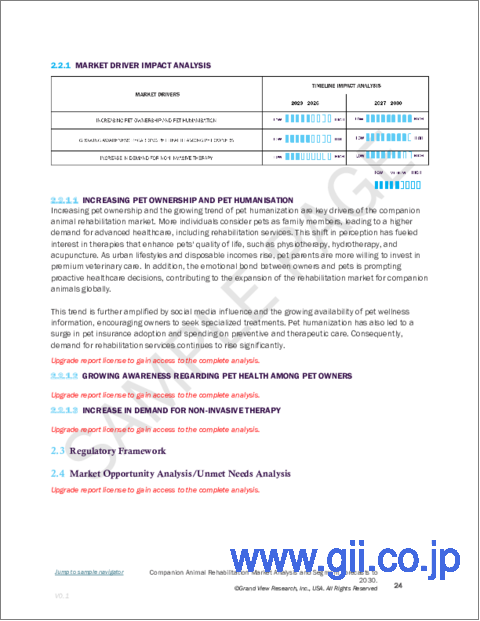
- 市場促進要因分析
- 市場抑制要因分析
- ビジネス環境分析
- 業界分析:ポーターのファイブフォース分析
- PESTLE分析
第4章 ペット向けリハビリテーションサービス市場:動物のビジネス分析
- 動物の市場シェア(2024年・2030年)
- 動物のセグメントダッシュボード
- 市場規模と予測および動向分析:動物別(2018年~2030年)
- 犬
- 猫
- その他
第5章 ペット向けリハビリテーションサービス市場:治療法のビジネス分析
- 治療法の市場シェア(2024年・2030年)
- 治療法のセグメントダッシュボード
- 市場規模と予測および動向分析:治療法別(2018年~2030年)
- 治療的エクササイズ
- 手技療法
- ハイドロセラピー
- 温熱療法と冷熱療法
- 電気療法
- 鍼
- 衝撃波療法
- その他の治療法
第6章 ペット向けリハビリテーションサービス市場:適応症のビジネス分析
- 適応症の市場シェア(2024年・2030年)
- 適応症のセグメントダッシュボード
- 市場規模と予測および動向分析:適応症別(2018年~2030年)
- 手術後
- 外傷性傷害
- 急性疾患と慢性疾患
- 発達異常
- その他の適応症
第7章 ペット向けリハビリテーションサービス市場:最終用途のビジネス分析
- 最終用途の市場シェア(2024年・2030年)
- 最終用途のセグメントダッシュボード
- 市場規模と予測および動向分析:最終用途別(2018年~2030年)
- 獣医リハビリセンター&病院
- レスキュー&シェルター施設
- その他
第8章 ペット向けリハビリテーションサービス市場:動物、治療法、適応症、最終用途別の地域推定・動向分析
- 地域別市場シェア分析(2024年・2030年)
- 地域市場ダッシュボード
- 市場規模、予測動向分析(2018年~2030年)
- 北米
- 米国
- カナダ
- メキシコ
- 欧州
- 英国
- ドイツ
- フランス
- イタリア
- スペイン
- ノルウェー
- デンマーク
- スウェーデン
- アジア太平洋
- 日本
- 中国
- インド
- 韓国
- オーストラリア
- タイ
- ラテンアメリカ
- ブラジル
- アルゼンチン
- 中東・アフリカ
- 南アフリカ
- サウジアラビア
- アラブ首長国連邦
- クウェート
第9章 競合情勢
- 参入企業の概要
- 企業の市況分析
- 企業分類
- 戦略マッピング
- 企業プロファイル/上場企業
- Back on Track Veterinary Rehabilitation Center, LLC
- Animal Acupuncture and Rehabilitation Center
- BARC
- Treasure Coast Animal Rehab &Fitness
- Animal Rehab Center of Michigan
- Blue Springs Animal Rehabilitation Center
- Essex Animal Hospital
- Triangle Veterinary Referral Hospital
- Butter Wick Animal Rehab
- Animal Rehab and Conditioning Center
第10章 重要なポイント
List of Tables
- Table 1 List of Secondary Sources
- Table 2 List of Abbreviations
- Table 3 Global Companion Animal Rehabilitation Services Market, By Therapy, 2018 - 2030 (USD Million)
- Table 4 Global Companion Animal Rehabilitation Services Market, By Animal, 2018 - 2030 (USD Million)
- Table 5 Global Companion Animal Rehabilitation Services Market, By Indication, 2018 - 2030 (USD Million)
- Table 6 Global Companion Animal Rehabilitation Services Market, By End Use, 2018 - 2030 (USD Million)
- Table 7 Global Companion Animal Rehabilitation Services Market, By Region, 2018 - 2030 (USD Million)
- Table 8 North America Companion Animal Rehabilitation Services Market, By Country, 2018 - 2030 (USD Million)
- Table 9 North America Companion Animal Rehabilitation Services Market, By Therapy, 2018 - 2030 (USD Million)
- Table 10 North America Companion Animal Rehabilitation Services Market, By Animal, 2018 - 2030 (USD Million)
- Table 11 North America Companion Animal Rehabilitation Services Market, By Indication, 2018 - 2030 (USD Million)
- Table 12 North America Companion Animal Rehabilitation Services Market, By End Use, 2018 - 2030 (USD Million)
- Table 13 U.S. Companion Animal Rehabilitation Services Market, By Therapy, 2018 - 2030 (USD Million)
- Table 14 U.S. Companion Animal Rehabilitation Services Market, By Animal, 2018 - 2030 (USD Million)
- Table 15 U.S. Companion Animal Rehabilitation Services Market, By Indication, 2018 - 2030 (USD Million)
- Table 16 U.S. Companion Animal Rehabilitation Services Market, By End Use, 2018 - 2030 (USD Million)
- Table 17 Canada Companion Animal Rehabilitation Services Market, By Therapy, 2018 - 2030 (USD Million)
- Table 18 Canada Companion Animal Rehabilitation Services Market, By Animal, 2018 - 2030 (USD Million)
- Table 19 Canada Companion Animal Rehabilitation Services Market, By Indication, 2018 - 2030 (USD Million)
- Table 20 Canada Companion Animal Rehabilitation Services Market, By End Use, 2018 - 2030 (USD Million)
- Table 21 Mexico Companion Animal Rehabilitation Services Market, By Therapy, 2018 - 2030 (USD Million)
- Table 22 Mexico Companion Animal Rehabilitation Services Market, By Animal, 2018 - 2030 (USD Million)
- Table 23 Mexico Companion Animal Rehabilitation Services Market, By Indication, 2018 - 2030 (USD Million)
- Table 24 Mexico Companion Animal Rehabilitation Services Market, By End Use, 2018 - 2030 (USD Million)
- Table 25 Europe Companion Animal Rehabilitation Services Market, By Country, 2018 - 2030 (USD Million)
- Table 26 Europe Companion Animal Rehabilitation Services Market, By Therapy, 2018 - 2030 (USD Million)
- Table 27 Europe Companion Animal Rehabilitation Services Market, By Animal, 2018 - 2030 (USD Million)
- Table 28 Europe Companion Animal Rehabilitation Services Market, By Indication, 2018 - 2030 (USD Million)
- Table 29 Europe Companion Animal Rehabilitation Services Market, By End Use, 2018 - 2030 (USD Million)
- Table 30 Germany Companion Animal Rehabilitation Services Market, By Therapy, 2018 - 2030 (USD Million)
- Table 31 Germany Companion Animal Rehabilitation Services Market, By Animal, 2018 - 2030 (USD Million)
- Table 32 Germany Companion Animal Rehabilitation Services Market, By Indication, 2018 - 2030 (USD Million)
- Table 33 Germany Companion Animal Rehabilitation Services Market, By End Use, 2018 - 2030 (USD Million)
- Table 34 UK Companion Animal Rehabilitation Services Market, By Therapy, 2018 - 2030 (USD Million)
- Table 35 UK Companion Animal Rehabilitation Services Market, By Animal, 2018 - 2030 (USD Million)
- Table 36 UK Companion Animal Rehabilitation Services Market, By Indication, 2018 - 2030 (USD Million)
- Table 37 UK Companion Animal Rehabilitation Services Market, By End Use, 2018 - 2030 (USD Million)
- Table 38 France Companion Animal Rehabilitation Services Market, By Therapy, 2018 - 2030 (USD Million)
- Table 39 France Companion Animal Rehabilitation Services Market, By Animal, 2018 - 2030 (USD Million)
- Table 40 France Companion Animal Rehabilitation Services Market, By Indication, 2018 - 2030 (USD Million)
- Table 41 France Companion Animal Rehabilitation Services Market, By End Use, 2018 - 2030 (USD Million)
- Table 42 Italy Companion Animal Rehabilitation Services Market, By Therapy, 2018 - 2030 (USD Million)
- Table 43 Italy Companion Animal Rehabilitation Services Market, By Animal, 2018 - 2030 (USD Million)
- Table 44 Italy Companion Animal Rehabilitation Services Market, By Indication, 2018 - 2030 (USD Million)
- Table 45 Italy Companion Animal Rehabilitation Services Market, By End Use, 2018 - 2030 (USD Million)
- Table 46 Spain Companion Animal Rehabilitation Services Market, By Therapy, 2018 - 2030 (USD Million)
- Table 47 Spain Companion Animal Rehabilitation Services Market, By Animal, 2018 - 2030 (USD Million)
- Table 48 Spain Companion Animal Rehabilitation Services Market, By Indication, 2018 - 2030 (USD Million)
- Table 49 Spain Companion Animal Rehabilitation Services Market, By End Use, 2018 - 2030 (USD Million)
- Table 50 Denmark Companion Animal Rehabilitation Services Market, By Therapy, 2018 - 2030 (USD Million)
- Table 51 Denmark Companion Animal Rehabilitation Services Market, By Animal, 2018 - 2030 (USD Million)
- Table 52 Denmark Companion Animal Rehabilitation Services Market, By Indication, 2018 - 2030 (USD Million)
- Table 53 Denmark Companion Animal Rehabilitation Services Market, By End Use, 2018 - 2030 (USD Million)
- Table 54 Sweden Companion Animal Rehabilitation Services Market, By Therapy, 2018 - 2030 (USD Million)
- Table 55 Sweden Companion Animal Rehabilitation Services Market, By Animal, 2018 - 2030 (USD Million)
- Table 56 Sweden Companion Animal Rehabilitation Services Market, By Indication, 2018 - 2030 (USD Million)
- Table 57 Sweden Companion Animal Rehabilitation Services Market, By End Use, 2018 - 2030 (USD Million)
- Table 58 Norway Companion Animal Rehabilitation Services Market, By Therapy, 2018 - 2030 (USD Million)
- Table 59 Norway Companion Animal Rehabilitation Services Market, By Animal, 2018 - 2030 (USD Million)
- Table 60 Norway Companion Animal Rehabilitation Services Market, By Indication, 2018 - 2030 (USD Million)
- Table 61 Norway Companion Animal Rehabilitation Services Market, By End Use, 2018 - 2030 (USD Million)
- Table 62 Asia Pacific Companion Animal Rehabilitation Services Market, By Country, 2018 - 2030 (USD Million)
- Table 63 Asia Pacific Companion Animal Rehabilitation Services Market, By Therapy, 2018 - 2030 (USD Million)
- Table 64 Asia Pacific Companion Animal Rehabilitation Services Market, By Animal, 2018 - 2030 (USD Million)
- Table 65 Asia Pacific Companion Animal Rehabilitation Services Market, By Indication, 2018 - 2030 (USD Million)
- Table 66 Asia Pacific Companion Animal Rehabilitation Services Market, By End Use, 2018 - 2030 (USD Million)
- Table 67 China Companion Animal Rehabilitation Services Market, By Therapy, 2018 - 2030 (USD Million)
- Table 68 China Companion Animal Rehabilitation Services Market, By Animal, 2018 - 2030 (USD Million)
- Table 69 China Companion Animal Rehabilitation Services Market, By Indication, 2018 - 2030 (USD Million)
- Table 70 China Companion Animal Rehabilitation Services Market, By End Use, 2018 - 2030 (USD Million)
- Table 71 Japan Companion Animal Rehabilitation Services Market, By Therapy, 2018 - 2030 (USD Million)
- Table 72 Japan Companion Animal Rehabilitation Services Market, By Animal, 2018 - 2030 (USD Million)
- Table 73 Japan Companion Animal Rehabilitation Services Market, By Indication, 2018 - 2030 (USD Million)
- Table 74 Japan Companion Animal Rehabilitation Services Market, By End Use, 2018 - 2030 (USD Million)
- Table 75 India Companion Animal Rehabilitation Services Market, By Therapy, 2018 - 2030 (USD Million)
- Table 76 India Companion Animal Rehabilitation Services Market, By Animal, 2018 - 2030 (USD Million)
- Table 77 India Companion Animal Rehabilitation Services Market, By Indication, 2018 - 2030 (USD Million)
- Table 78 India Companion Animal Rehabilitation Services Market, By End Use, 2018 - 2030 (USD Million)
- Table 79 South Korea Companion Animal Rehabilitation Services Market, By Therapy, 2018 - 2030 (USD Million)
- Table 80 South Korea Companion Animal Rehabilitation Services Market, By Animal, 2018 - 2030 (USD Million)
- Table 81 South Korea Companion Animal Rehabilitation Services Market, By Indication, 2018 - 2030 (USD Million)
- Table 82 South Korea Companion Animal Rehabilitation Services Market, By End Use, 2018 - 2030 (USD Million)
- Table 83 Australia Companion Animal Rehabilitation Services Market, By Therapy, 2018 - 2030 (USD Million)
- Table 84 Australia Companion Animal Rehabilitation Services Market, By Animal, 2018 - 2030 (USD Million)
- Table 85 Australia Companion Animal Rehabilitation Services Market, By Indication, 2018 - 2030 (USD Million)
- Table 86 Australia Companion Animal Rehabilitation Services Market, By End Use, 2018 - 2030 (USD Million)
- Table 87 Thailand Companion Animal Rehabilitation Services Market, By Therapy, 2018 - 2030 (USD Million)
- Table 88 Thailand Companion Animal Rehabilitation Services Market, By Animal, 2018 - 2030 (USD Million)
- Table 89 Thailand Companion Animal Rehabilitation Services Market, By Indication, 2018 - 2030 (USD Million)
- Table 90 Thailand Companion Animal Rehabilitation Services Market, By End Use, 2018 - 2030 (USD Million)
- Table 91 Latin America Companion Animal Rehabilitation Services Market, By Country, 2018 - 2030 (USD Million)
- Table 92 Latin America Companion Animal Rehabilitation Services Market, By Therapy, 2018 - 2030 (USD Million)
- Table 93 Latin America Companion Animal Rehabilitation Services Market, By Animal, 2018 - 2030 (USD Million)
- Table 94 Latin America Companion Animal Rehabilitation Services Market, By Indication, 2018 - 2030 (USD Million)
- Table 95 Latin America Companion Animal Rehabilitation Services Market, By End Use, 2018 - 2030 (USD Million)
- Table 96 Brazil Companion Animal Rehabilitation Services Market, By Therapy, 2018 - 2030 (USD Million)
- Table 97 Brazil Companion Animal Rehabilitation Services Market, By Animal, 2018 - 2030 (USD Million)
- Table 98 Brazil Companion Animal Rehabilitation Services Market, By Indication, 2018 - 2030 (USD Million)
- Table 99 Brazil Companion Animal Rehabilitation Services Market, By End Use, 2018 - 2030 (USD Million)
- Table 100 Argentina Companion Animal Rehabilitation Services Market, By Therapy, 2018 - 2030 (USD Million)
- Table 101 Argentina Companion Animal Rehabilitation Services Market, By Animal, 2018 - 2030 (USD Million)
- Table 102 Argentina Companion Animal Rehabilitation Services Market, By Indication, 2018 - 2030 (USD Million)
- Table 103 Argentina Companion Animal Rehabilitation Services Market, By End Use, 2018 - 2030 (USD Million)
- Table 104 Middle East & Africa Companion Animal Rehabilitation Services Market, By Country, 2018 - 2030 (USD Million)
- Table 105 Middle East & Africa Companion Animal Rehabilitation Services Market, By Therapy, 2018 - 2030 (USD Million)
- Table 106 Middle East & Africa Companion Animal Rehabilitation Services Market, By Animal, 2018 - 2030 (USD Million)
- Table 107 Middle East & Africa Companion Animal Rehabilitation Services Market, By Indication, 2018 - 2030 (USD Million)
- Table 108 Middle East & Africa Companion Animal Rehabilitation Services Market, By End Use, 2018 - 2030 (USD Million)
- Table 109 South Africa Companion Animal Rehabilitation Services Market, By Therapy, 2018 - 2030 (USD Million)
- Table 110 South Africa Companion Animal Rehabilitation Services Market, By Animal, 2018 - 2030 (USD Million)
- Table 111 South Africa Companion Animal Rehabilitation Services Market, By Indication, 2018 - 2030 (USD Million)
- Table 112 South Africa Companion Animal Rehabilitation Services Market, By End Use, 2018 - 2030 (USD Million)
- Table 113 Saudi Arabia Companion Animal Rehabilitation Services Market, By Therapy, 2018 - 2030 (USD Million)
- Table 114 Saudi Arabia Companion Animal Rehabilitation Services Market, By Animal, 2018 - 2030 (USD Million)
- Table 115 Saudi Arabia Companion Animal Rehabilitation Services Market, By Indication, 2018 - 2030 (USD Million)
- Table 116 Saudi Arabia Companion Animal Rehabilitation Services Market, By End Use, 2018 - 2030 (USD Million)
- Table 117 UAE Companion Animal Rehabilitation Services Market, By Therapy, 2018 - 2030 (USD Million)
- Table 118 UAE Companion Animal Rehabilitation Services Market, By Animal, 2018 - 2030 (USD Million)
- Table 119 UAE Companion Animal Rehabilitation Services Market, By Indication, 2018 - 2030 (USD Million)
- Table 120 UAE Companion Animal Rehabilitation Services Market, By End Use, 2018 - 2030 (USD Million)
- Table 121 Kuwait Companion Animal Rehabilitation Services Market, By Therapy, 2018 - 2030 (USD Million)
- Table 122 Kuwait Companion Animal Rehabilitation Services Market, By Animal, 2018 - 2030 (USD Million)
- Table 123 Kuwait Companion Animal Rehabilitation Services Market, By Indication, 2018 - 2030 (USD Million)
- Table 124 Kuwait Companion Animal Rehabilitation Services Market, By End Use, 2018 - 2030 (USD Million)
List of Figures
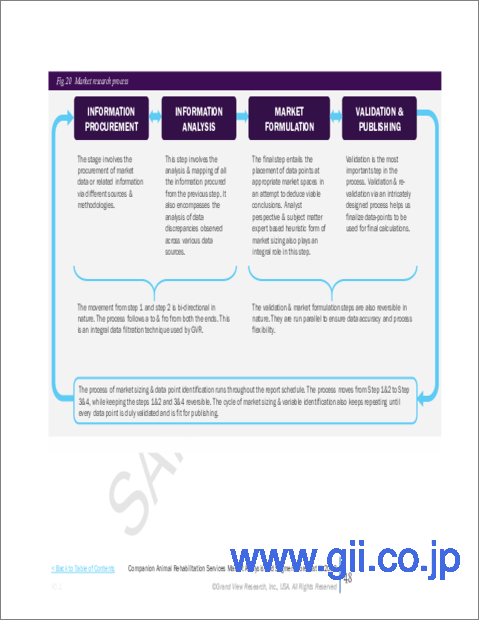
- Fig. 1 Market research process
- Fig. 2 Information Procurement
- Fig. 3 Primary Research Pattern
- Fig. 4 Market Research Approaches
- Fig. 5 Value Chain-Based Sizing & Forecasting
- Fig. 6 Market Formulation & Validation
- Fig. 7 Companion Animal Rehabilitation Services Market, Market Segmentation
- Fig. 8 Market Driver Relevance Analysis (Current & Future Impact)
- Fig. 9 Market Restraint Relevance Analysis (Current & Future Impact)
- Fig. 10 Market Challenge Relevance Analysis (Current & Future Impact)
- Fig. 11 SWOT Analysis, By Factor (Political & Legal, Economic and Technological)
- Fig. 12 Porter's Five Forces Analysis
- Fig. 13 Regional Marketplace: Key Takeaways
- Fig. 14 Global Companion Animal Rehabilitation Services Market, for Animal, 2018 - 2030 (USD Million)
- Fig. 15 Global Companion Animal Rehabilitation Services Market, for Dogs, 2018 - 2030 (USD Million)
- Fig. 16 Global Companion Animal Rehabilitation Services Market, for Cats, 2018 - 2030 (USD Million)
- Fig. 17 Global Companion Animal Rehabilitation Services Market, for Others, 2018 - 2030 (USD Million)
- Fig. 18 Global Companion Animal Rehabilitation Services Market, for Therapy, 2018 - 2030 (USD Million)
- Fig. 19 Global Companion Animal Rehabilitation Services Market, for Therapeutic Exercises, 2018 - 2030 (USD Million)
- Fig. 20 Global Companion Animal Rehabilitation Services Market, for Manual Therapy, 2018 - 2030 (USD Million)
- Fig. 21 Global Companion Animal Rehabilitation Services Market, for Hydrotherapy, 2018 - 2030 (USD Million)
- Fig. 22 Global Companion Animal Rehabilitation Services Market, for Hot & Cold Therapies, 2018 - 2030 (USD Million)
- Fig. 23 Global Companion Animal Rehabilitation Services Market, for Electro Therapies, 2018 - 2030 (USD Million)
- Fig. 24 Global Companion Animal Rehabilitation Services Market, for Acupuncture, 2018 - 2030 (USD Million)
- Fig. 25 Global Companion Animal Rehabilitation Services Market, for Shockwave Therapy, 2018 - 2030 (USD Million)
- Fig. 26 Global Companion Animal Rehabilitation Services Market, for Other Therapies, 2018 - 2030 (USD Million)
- Fig. 27 Global Companion Animal Rehabilitation Services Market, for Indication, 2018 - 2030 (USD Million)
- Fig. 28 Global Companion Animal Rehabilitation Services Market, for Post-Surgery, 2018 - 2030 (USD Million)
- Fig. 29 Global Companion Animal Rehabilitation Services Market, for Traumatic Injuries, 2018 - 2030 (USD Million)
- Fig. 30 Global Companion Animal Rehabilitation Services Market, for Acute & Chronic Diseases, 2018 - 2030 (USD Million)
- Fig. 31 Global Companion Animal Rehabilitation Services Market, for Developmental Abnormality, 2018 - 2030 (USD Million)
- Fig. 32 Global Companion Animal Rehabilitation Services Market, for Other Indications, 2018 - 2030 (USD Million)
- Fig. 33 Global Companion Animal Rehabilitation Services Market, for End Use, 2018 - 2030 (USD Million)
- Fig. 34 Global Companion Animal Rehabilitation Services Market, for Veterinary Rehab Centers & Hospitals, 2018 - 2030 (USD Million)
- Fig. 35 Global Companion Animal Rehabilitation Services Market, for Rescue & Shelter Homes, 2018 - 2030 (USD Million)
- Fig. 36 Global Companion Animal Rehabilitation Services Market, for Others, 2018 - 2030 (USD Million)
- Fig. 37 Regional Outlook, 2024 & 2030
- Fig. 38 North America Companion Animal Rehabilitation Services Market, 2018 - 2030 (USD Million)
- Fig. 39 U.S. Companion Animal Rehabilitation Services Market, 2018 - 2030 (USD Million)
- Fig. 40 Canada Companion Animal Rehabilitation Services Market, 2018 - 2030 (USD Million)
- Fig. 41 Mexico Companion Animal Rehabilitation Services Market, 2018 - 2030 (USD Million)
- Fig. 42 Europe Companion Animal Rehabilitation Services Market, 2018 - 2030 (USD Million)
- Fig. 43 Germany Companion Animal Rehabilitation Services Market, 2018 - 2030 (USD Million)
- Fig. 44 UK Companion Animal Rehabilitation Services Market, 2018 - 2030 (USD Million)
- Fig. 45 France Companion Animal Rehabilitation Services Market, 2018 - 2030 (USD Million)
- Fig. 46 Italy Companion Animal Rehabilitation Services Market, 2018 - 2030 (USD Million)
- Fig. 47 Spain Companion Animal Rehabilitation Services Market, 2018 - 2030 (USD Million)
- Fig. 48 Denmark Companion Animal Rehabilitation Services Market, 2018 - 2030 (USD Million)
- Fig. 49 Sweden Companion Animal Rehabilitation Services Market, 2018 - 2030 (USD Million)
- Fig. 50 Norway Companion Animal Rehabilitation Services Market, 2018 - 2030 (USD Million)
- Fig. 51 Asia Pacific Companion Animal Rehabilitation Services Market, 2018 - 2030 (USD Million)
- Fig. 52 Japan Companion Animal Rehabilitation Services Market, 2018 - 2030 (USD Million)
- Fig. 53 China Companion Animal Rehabilitation Services Market, 2018 - 2030 (USD Million)
- Fig. 54 India Companion Animal Rehabilitation Services Market, 2018 - 2030 (USD Million)
- Fig. 55 Australia Companion Animal Rehabilitation Services Market, 2018 - 2030 (USD Million)
- Fig. 56 South Korea Companion Animal Rehabilitation Services Market, 2018 - 2030 (USD Million)
- Fig. 57 Thailand Companion Animal Rehabilitation Services Market, 2018 - 2030 (USD Million)
- Fig. 58 Latin America Companion Animal Rehabilitation Services Market, 2018 - 2030 (USD Million)
- Fig. 59 Brazil Companion Animal Rehabilitation Services Market, 2018 - 2030 (USD Million)
- Fig. 60 Middle East and Africa Companion Animal Rehabilitation Services Market, 2018 - 2030 (USD Million)
- Fig. 61 South Africa Companion Animal Rehabilitation Services Market, 2018 - 2030 (USD Million)
- Fig. 62 Saudi Arabia Companion Animal Rehabilitation Services Market, 2018 - 2030 (USD Million)
- Fig. 63 UAE Companion Animal Rehabilitation Services Market, 2018 - 2030 (USD Million)
- Fig. 64 Kuwait Companion Animal Rehabilitation Services Market, 2018 - 2030 (USD Million)
- Fig. 65 Company categorization
- Fig. 66 Company market position analysis
- Fig. 67 Strategic framework
Companion Animal Rehabilitation Services Market Growth & Trends:
The global companion animal rehabilitation services market size is estimated to reach USD 1,219.85 million by 2030, registering a CAGR of 11.77% from 2025 to 2030, according to a new report by Grand View Research, Inc. The rise in number of veterinary rehabilitators, growing prevalence of orthopedic and musculoskeletal problems in pet animals, significant pet ownership rates, rising pet humanization trends, and increased awareness among pet parents regarding the advantages of drug-free and non-invasive rehabilitation treatments are some of the factors driving the market growth.
Rehabilitation services are highly considered for companion animals to provide them numerous benefits such as improved coordination & balance, increased range of motion, increased muscle strength, weight loss for obese pets, and reduced pain or inflammation post-surgery, among others. The major goal of physical rehabilitation in pet cats and dogs is to speed healing, decrease pain or discomfort, and improve their well-being. Several pet care centers are offering advanced rehab services with a wide range of programs, to aid animals to recover from injury, chronic diseases, and surgery.
Pet rehabilitation therapies have evolved in the past few years, from being a niche service to becoming a popular veterinary treatment option. It utilizes a range of non-invasive techniques to improve pets' overall health and mobility with directed exercises. Due to its growing availability & awareness in both developed & emerging economies, rehabilitation services are offered significantly in animals similar to humans. Dogs and horses involved in sporting activities are widely known to be benefited from rehabilitation services with high patient compliance. Although pet rehabilitation therapies have been in the industry for a longer time, the demand has recently increased due to its advancing treatments, independently or together with several other therapies, to maximize the benefits.
As per an article published in February 2022 by the College of Veterinary Medicines in the U.S., over half of the total pet population in the country is estimated to be geriatric. A sizeable portion of these animals is considered to have mobility issues and other chronic conditions like arthritis as they reach the end of their expected lifespan. Therefore, most pet parents prefer the option of rehabilitation when their senior pets start to become a little stiffer while moving around or getting up. According to The Valley Animal Rehabilitation, elderly pets are more prone to gain weight owing to their low mobility, thereby leading to obesity, heart problems, or diabetes. Rehab techniques such as hydrotherapy can help animals lose weight and prevent such deadly conditions at early stages.
The market was negatively impacted during the COVID-19 pandemic owing to the closure of rehab centers with limited access to pet care. The announcement of nationwide lockdowns and movement restrictions led pet rehabilitators and animal owners to face obstacles in obtaining non-invasive therapies during the year 2020. However, the market quickly recovered in the following year with ease of restrictions coupled with increased pet adoption & ownership rates.
Additionally, the market for companion animal rehabilitation services is further propelled by the large presence of pet physical therapy centers in developed regions. For instance, Beach Animal Rehabilitation Center in the U.S. offers top-rated rehabilitation therapies such as underwater or ground treadmills, acupuncture, and guided exercises for cats and dogs. Similarly, several other players in the market are striving to enhance the well-being of companion animals, benefiting from a pain-free life.
Companion Animal Rehabilitation Services Market Report Highlights:
- By animal, the dogs segment held the largest market share of 54.73% in 2024, driven by the high prevalence of orthopedic and age-related conditions in dogs, as well as their increasing adoption worldwide.
- The cats segment is expected to register the fastest CAGR of 12.64% during the forecast period, attributed to the increasing awareness of feline-specific health needs and a rising prevalence of chronic conditions among cats.
- Based on end-use, the veterinary rehab centers & hospitals segment dominated the market in 2024, due to a growing number of veterinary rehab centers and hospitals worldwide with advanced cutting-edge infrastructures.
- The rescue & shelter homes segment is projected to grow at the fastest CAGR of 12.52% over the forecast period, driven by the increasing intake of animals and their prolonged stays in shelters.
- In 2024, the North America region held the largest share with a revenue share of 40.90%.
Table of Contents
Chapter 1. Methodology and Scope
- 1.1. Market Segmentation & Scope
- 1.2. Segment Definitions
- 1.2.1. Animal
- 1.2.2. Therapy
- 1.2.3. Indication
- 1.2.4. End Use
- 1.3. Estimates and Forecast Timeline
- 1.4. Research Methodology
- 1.5. Information Procurement
- 1.5.1. Purchased Database
- 1.5.2. GVR's Internal Database
- 1.5.3. Secondary Sources
- 1.5.4. Primary Research
- 1.6. Information Analysis
- 1.6.1. Data Analysis Models
- 1.7. Market Formulation & Data Visualization
- 1.8. Model Details
- 1.8.1. Commodity Flow Analysis
- 1.9. List of Secondary Sources
- 1.10. Objectives
Chapter 2. Executive Summary
- 2.1. Market Snapshot
- 2.2. Segment Snapshot
- 2.3. Competitive Landscape Snapshot
Chapter 3. Companion Animal Rehabilitation Services Market Variables, Trends, & Scope
- 3.1. Market Lineage Outlook
- 3.2. Market Dynamics
- 3.2.1. Market Driver Analysis
- 3.2.2. Market Restraint Analysis
- 3.3. Business Environment Analysis
- 3.3.1. Industry Analysis - Porter's Five Forces Analysis
- 3.3.1.1. Supplier power
- 3.3.1.2. Buyer power
- 3.3.1.3. Substitution threat
- 3.3.1.4. Threat of new entrant
- 3.3.1.5. Competitive rivalry
- 3.3.2. PESTLE Analysis
- 3.3.1. Industry Analysis - Porter's Five Forces Analysis
Chapter 4. Companion Animal Rehabilitation Services Market: Animal Business Analysis
- 4.1. Animal Market Share, 2024 & 2030
- 4.2. Animal Segment Dashboard
- 4.3. Market Size & Forecasts and Trend Analysis, by Animal, 2018 to 2030 (USD Million)
- 4.4. Dogs
- 4.4.1. Market estimates and forecasts 2018 to 2030 (USD Million)
- 4.5. Cats
- 4.5.1. Market estimates and forecasts 2018 to 2030 (USD Million)
- 4.6. Others
- 4.6.1. Market estimates and forecasts 2018 to 2030 (USD Million)
Chapter 5. Companion Animal Rehabilitation Services Market: Therapy Business Analysis
- 5.1. Therapy Market Share, 2024 & 2030
- 5.2. Therapy Segment Dashboard
- 5.3. Market Size & Forecasts and Trend Analysis, by Therapy, 2018 to 2030 (USD Million)
- 5.4. Therapeutic Exercises
- 5.4.1. Market estimates and forecasts 2018 to 2030 (USD Million)
- 5.5. Manual Therapy
- 5.5.1. Market estimates and forecasts 2018 to 2030 (USD Million)
- 5.6. Hydrotherapy
- 5.6.1. Market estimates and forecasts 2018 to 2030 (USD Million)
- 5.7. Hot & Cold Therapies
- 5.7.1. Market estimates and forecasts 2018 to 2030 (USD Million)
- 5.8. Electro Therapies
- 5.8.1. Market estimates and forecasts 2018 to 2030 (USD Million)
- 5.9. Acupuncture
- 5.9.1. Market estimates and forecasts 2018 to 2030 (USD Million)
- 5.10. Shockwave Therapy
- 5.10.1. Market estimates and forecasts 2018 to 2030 (USD Million)
- 5.11. Other Therapies
- 5.11.1. Market estimates and forecasts 2018 to 2030 (USD Million)
Chapter 6. Companion Animal Rehabilitation Services Market: Indication Business Analysis
- 6.1. Indication Market Share, 2024 & 2030
- 6.2. Indication Segment Dashboard
- 6.3. Market Size & Forecasts and Trend Analysis, by Indication, 2018 to 2030 (USD Million)
- 6.4. Post-Surgery
- 6.4.1. Market estimates and forecasts 2018 to 2030 (USD Million)
- 6.5. Traumatic Injuries
- 6.5.1. Market estimates and forecasts 2018 to 2030 (USD Million)
- 6.6. Acute & Chronic Diseases
- 6.6.1. Market estimates and forecasts 2018 to 2030 (USD Million)
- 6.7. Developmental Abnormality
- 6.7.1. Market estimates and forecasts 2018 to 2030 (USD Million)
- 6.8. Other Indications
- 6.8.1. Market estimates and forecasts 2018 to 2030 (USD Million)
Chapter 7. Companion Animal Rehabilitation Services Market: End Use Business Analysis
- 7.1. End Use Market Share, 2024 & 2030
- 7.2. End Use Segment Dashboard
- 7.3. Market Size & Forecasts and Trend Analysis, by End Use, 2018 to 2030 (USD Million)
- 7.4. Veterinary Rehab Centers & Hospitals
- 7.4.1. Market estimates and forecasts 2018 to 2030 (USD Million)
- 7.5. Rescue & Shelter Homes
- 7.5.1. Market estimates and forecasts 2018 to 2030 (USD Million)
- 7.6. Others
- 7.6.1. Market estimates and forecasts 2018 to 2030 (USD Million)
Chapter 8. Companion Therapy Rehabilitation Services Market: Regional Estimates & Trend Analysis by Animal, Therapy, Indication, and End Use
- 8.1. Regional Market Share Analysis, 2024 & 2030
- 8.2. Regional Market Dashboard
- 8.3. Market Size, & Forecasts Trend Analysis, 2018 to 2030:
- 8.4. North America
- 8.4.1. North America companion animal rehabilitation services market estimates and forecasts, 2018 - 2030 (USD Million)
- 8.4.2. U.S.
- 8.4.2.1. Key country dynamics
- 8.4.2.2. U.S. companion animal rehabilitation services market estimates and forecasts, 2018 - 2030 (USD Million)
- 8.4.3. Canada
- 8.4.3.1. Key country dynamics
- 8.4.3.2. Canada companion animal rehabilitation services market estimates and forecasts, 2018 - 2030 (USD Million)
- 8.4.4. Mexico
- 8.4.4.1. Key country dynamics
- 8.4.4.2. Mexico companion animal rehabilitation services market estimates and forecasts, 2018 - 2030 (USD Million)
- 8.5. Europe
- 8.5.1. Europe companion animal rehabilitation services market estimates and forecasts, 2018 - 2030 (USD Million)
- 8.5.2. UK
- 8.5.2.1. Key country dynamics
- 8.5.2.2. UK companion animal rehabilitation services market estimates and forecasts, 2018 - 2030 (USD Million)
- 8.5.3. Germany
- 8.5.3.1. Key country dynamics
- 8.5.3.2. Germany companion animal rehabilitation services market estimates and forecasts, 2018 - 2030 (USD Million)
- 8.5.4. France
- 8.5.4.1. Key country dynamics
- 8.5.4.2. France companion animal rehabilitation services market estimates and forecasts, 2018 - 2030 (USD Million)
- 8.5.5. Italy
- 8.5.5.1. Key country dynamics
- 8.5.5.2. Italy companion animal rehabilitation services market estimates and forecasts, 2018 - 2030 (USD Million)
- 8.5.6. Spain
- 8.5.6.1. Key country dynamics
- 8.5.6.2. Spain companion animal rehabilitation services market estimates and forecasts, 2018 - 2030 (USD Million)
- 8.5.7. Norway
- 8.5.7.1. Key country dynamics
- 8.5.7.2. Norway companion animal rehabilitation services market estimates and forecasts, 2018 - 2030 (USD Million)
- 8.5.8. Denmark
- 8.5.8.1. Key country dynamics
- 8.5.8.2. Denmark companion animal rehabilitation services market estimates and forecasts, 2018 - 2030 (USD Million)
- 8.5.9. Sweden
- 8.5.9.1. Key country dynamics
- 8.5.9.2. Sweden companion animal rehabilitation services market estimates and forecasts, 2018 - 2030 (USD Million)
- 8.6. Asia Pacific
- 8.6.1. Asia Pacific companion animal rehabilitation services market estimates and forecasts, 2018 - 2030 (USD Million)
- 8.6.2. Japan
- 8.6.2.1. Key country dynamics
- 8.6.2.2. Japan companion animal rehabilitation services market estimates and forecasts, 2018 - 2030 (USD Million)
- 8.6.3. China
- 8.6.3.1. Key country dynamics
- 8.6.3.2. China companion animal rehabilitation services market estimates and forecasts, 2018 - 2030 (USD Million)
- 8.6.4. India
- 8.6.4.1. Key country dynamics
- 8.6.4.2. India companion animal rehabilitation services market estimates and forecasts, 2018 - 2030 (USD Million)
- 8.6.5. South Korea
- 8.6.5.1. Key country dynamics
- 8.6.5.2. South Korea companion animal rehabilitation services market estimates and forecasts, 2018 - 2030 (USD Million)
- 8.6.6. Australia
- 8.6.6.1. Key country dynamics
- 8.6.6.2. Australia companion animal rehabilitation services market estimates and forecasts, 2018 - 2030 (USD Million)
- 8.6.7. Thailand
- 8.6.7.1. Key country dynamics
- 8.6.7.2. Thailand companion animal rehabilitation services market estimates and forecasts, 2018 - 2030 (USD Million)
- 8.7. Latin America
- 8.7.1. Latin America companion animal rehabilitation services market estimates and forecasts, 2018 - 2030 (USD Million)
- 8.7.2. Brazil
- 8.7.2.1. Key country dynamics
- 8.7.2.2. Brazil companion animal rehabilitation services market estimates and forecasts, 2018 - 2030 (USD Million)
- 8.7.3. Argentina
- 8.7.3.1. Key country dynamics
- 8.7.3.2. Argentina companion animal rehabilitation services market estimates and forecasts, 2018 - 2030 (USD Million)
- 8.8. MEA
- 8.8.1. MEA companion animal rehabilitation services market estimates and forecasts, 2018 - 2030 (USD Million)
- 8.8.2. South Africa
- 8.8.2.1. Key country dynamics
- 8.8.2.2. South Africa companion animal rehabilitation services market estimates and forecasts, 2018 - 2030 (USD Million)
- 8.8.3. Saudi Arabia
- 8.8.3.1. Key country dynamics
- 8.8.3.2. Saudi Arabia companion animal rehabilitation services market estimates and forecasts, 2018 - 2030 (USD Million)
- 8.8.4. UAE
- 8.8.4.1. Key country dynamics
- 8.8.4.2. UAE companion animal rehabilitation services market estimates and forecasts, 2018 - 2030 (USD Million)
- 8.8.5. Kuwait
- 8.8.5.1. Key country dynamics
- 8.8.5.2. Kuwait companion animal rehabilitation services market estimates and forecasts, 2018 - 2030 (USD Million)
Chapter 9. Competitive Landscape
- 9.1. Participant Overview
- 9.2. Company Market Position Analysis
- 9.3. Company Categorization
- 9.4. Strategy Mapping
- 9.5. Company Profiles/Listing
- 9.5.1. Back on Track Veterinary Rehabilitation Center, LLC
- 9.5.1.1. Overview
- 9.5.1.2. Financial performance
- 9.5.1.3. Product benchmarking
- 9.5.1.4. Strategic initiatives
- 9.5.2. Animal Acupuncture and Rehabilitation Center
- 9.5.2.1. Overview
- 9.5.2.2. Financial performance
- 9.5.2.3. Product benchmarking
- 9.5.2.4. Strategic initiatives
- 9.5.3. BARC
- 9.5.3.1. Overview
- 9.5.3.2. Financial performance
- 9.5.3.3. Product benchmarking
- 9.5.3.4. Strategic initiatives
- 9.5.4. Treasure Coast Animal Rehab & Fitness
- 9.5.4.1. Overview
- 9.5.4.2. Financial performance
- 9.5.4.3. Product benchmarking
- 9.5.4.4. Strategic initiatives
- 9.5.5. Animal Rehab Center of Michigan
- 9.5.5.1. Overview
- 9.5.5.2. Financial performance
- 9.5.5.3. Product benchmarking
- 9.5.5.4. Strategic initiatives
- 9.5.6. Blue Springs Animal Rehabilitation Center
- 9.5.6.1. Overview
- 9.5.6.2. Financial performance
- 9.5.6.3. Product benchmarking
- 9.5.6.4. Strategic initiatives
- 9.5.7. Essex Animal Hospital
- 9.5.7.1. Overview
- 9.5.7.2. Financial performance
- 9.5.7.3. Product benchmarking
- 9.5.7.4. Strategic initiatives
- 9.5.8. Triangle Veterinary Referral Hospital
- 9.5.8.1. Overview
- 9.5.8.2. Financial performance
- 9.5.8.3. Product benchmarking
- 9.5.8.4. Strategic initiatives
- 9.5.9. Butter Wick Animal Rehab
- 9.5.9.1. Overview
- 9.5.9.2. Financial performance
- 9.5.9.3. Product benchmarking
- 9.5.9.4. Strategic initiatives
- 9.5.10. Animal Rehab and Conditioning Center
- 9.5.10.1. Overview
- 9.5.10.2. Financial performance
- 9.5.10.3. Product benchmarking
- 9.5.10.4. Strategic initiatives
- 9.5.1. Back on Track Veterinary Rehabilitation Center, LLC

