|
|
市場調査レポート
商品コード
1630978
PRC (Post-consumer Recycled) プラスチックの世界市場:市場規模・シェア・動向分析 (原料別・種類別・地域別・セグメント別、2025年~2030年)Post-consumer Recycled Plastics Market Size, Share & Trends Analysis Report By Source (Bottles, Non-bottle Rigid), By Type (Polyethylene, Polypropylene, Polyvinyl Chloride), By Region, And Segment Forecasts, 2025 - 2030 |
||||||
|
|||||||
カスタマイズ可能
|
|||||||

| PRC (Post-consumer Recycled) プラスチックの世界市場:市場規模・シェア・動向分析 (原料別・種類別・地域別・セグメント別、2025年~2030年) |
|
出版日: 2024年12月02日
発行: Grand View Research
ページ情報: 英文 100 Pages
納期: 2~10営業日
|

全表示
- 概要
- 図表
- 目次
PRCプラスチック市場の成長と動向:
Grand View Research, Inc.の最新レポートによると、世界のPRC (ポストコンシューマーリサイクル) プラスチックの市場規模は、2025年から2030年にかけて10.4%のCAGRを記録し、2030年までに216億4,000万米ドルに達すると予測されています。
環境問題への関心の高まり、都市化の進展、工業化、プラスチック樹脂の製造におけるカーボンフットプリントの削減への関心の高まりが、市場を牽引すると予想されます。
PRCプラスチックの需要は、包装用途や、電気・電子、飲食品、自動車、繊維など様々な産業で大きく増加すると予想されます。日用消費財 (FMCG) と食品・飲料が、PRCプラスチックの需要を牽引している主な分野です。また、PRCプラスチックは様々なプラスチックの生産に使用されています。環境問題への関心の高まりと、二酸化炭素排出量を削減するための様々な政府規制が、PRCプラスチックの需要を促進すると予想されます。
世界市場は種類別に、ポリエチレンテレフタレート (PET)、ポリプロピレン (PP)、ポリスチレン (PS)、ポリエチレン (PE)、ポリ塩化ビニル (PVC)、ポリウレタン (PUR) に区分されます。ポリエチレンは著名な原料セグメントであり、2019年の世界売上高の20.0%超のシェアを占めました。ポリスチレンセグメントは、幅広い産業で使用されるフィルム、シート、発泡体などの包装製品の需要が高いため、今後大きな成長が見込まれます。
消費者再生プラスチック市場:分析概要
- ボトル分野は、2024年に75.4%の最大売上高シェアを獲得し、市場で支配的な地位を占めました。
- ポリエチレン (PE) は市場をリードし、2024年には20.1%の最大収益シェアを占めました。この成長は、パッケージング、特に軟質・硬質フォーマットでの広範な用途によるものです。
- アジア太平洋のPRCプラスチック市場は世界市場を独占し、2024年には45.1%の最大の売上シェアを占めました。
目次
第1章 分析方法・範囲
第2章 エグゼクティブサマリー
第3章 PRCプラスチック市場:変動要因・傾向・範囲
- 世界のPRCプラスチック市場の見通し
- 業界のバリューチェーン分析
- 技術の概要
- 平均価格動向の分析
- 需給ギャップ分析 (2024年)
- 規制枠組み
- 政策と助成金プラン
- 標準とコンプライアンス
- 規制の影響分析
- 市場力学
- 市場促進要因の分析
- 市場抑制要因の分析
- 業界の課題
- ポーターのファイブフォース分析
- サプライヤーの力
- 買い手の力
- 代替の脅威
- 新規参入からの脅威
- 競争企業間の敵対関係
- PESTEL分析
- 政治的要因
- 経済的要因
- 社会的要因
- 技術的要因
- 環境的要因
- 法的要因
第4章 PRCプラスチック市場:原料別の展望・推定・予測
- PRCプラスチック市場:変動分析、原料別 (2024年・2030年)
- ボトル
- ボトル以外の固形物
- その他
第5章 PRCプラスチック市場:種類別の展望・推定・予測
- PRCプラスチック市場:変動分析、種類別 (2024年・2030年)
- ポリプロピレン (PP)
- ポリスチレン (PS)
- ポリエチレン (PE)
- ポリ塩化ビニル (PVC)
- ポリウレタン (PUR)
- ポリエチレンテレフタレート (PET)
- その他
第6章 PRCプラスチック市場:地域別の展望・推定・予測
- 地域別のスナップショット
- PRCプラスチック市場:変動分析、地域別 (2024年・2030年)
- 北米
- 市場の推計・予測 (2018~2030年)
- 原料別 (2018~2030年)
- 種類別 (2018~2030年)
- 米国
- カナダ
- メキシコ
- 欧州
- 市場推計・予測 (2018~2030年)
- 原料別 (2018~2030年)
- 種類別 (2018~2030年)
- ドイツ
- 英国
- フランス
- イタリア
- アジア太平洋
- 市場推計・予測 (2018~2030年)
- 原料別 (2018~2030年)
- 種類別 (2018~2030年)
- 中国
- インド
- 日本
- マレーシア
- ラテンアメリカ
- 市場推計・予測 (2018~2030年)
- 原料別 (2018~2030年)
- 種類別 (2018~2030年)
- ブラジル
- 中東・アフリカ
- 市場推計・予測 (2018~2030年)
- 原料別 (2018~2030年)
- 種類別 (2018~2030年)
- サウジアラビア
第7章 競合情勢
- 最新動向と影響分析:主な市場参入企業別
- ベンダー情勢
- 企業分類
- 主な流通業者・チャネルパートナーの一覧
- 潜在的顧客/エンドユーザーの一覧
- 競争のダイナミクス
- 競合ベンチマーキング
- 戦略マッピング
- ヒートマップ分析
- 企業プロファイル/上場企業
- BASF SE
- SABIC
- Evonik Industries AG
- Sumitomo Chemical Co., Ltd.
- Arkema
- LyondellBasell Industries NV
- Celanese Corporation
- Eastman Chemical Company
- Chevron Phillips Chemical Company
- SUEZ SA
- Exxon Mobil Corporation
- Covestro AG
List of Tables
- Table 1 List Of Abbreviations
- Table 2 Post-consumer Recycled Plastics Market Estimates And Forecasts, By Source, 2018 - 2030 (Kilotons) (USD Million)
- Table 3 Bottles Market Estimates And Forecasts, 2018 - 2030 (Kilotons) (USD Million)
- Table 4 Non-bottle Rigid Market Estimates And Forecasts, 2018 - 2030 (Kilotons) (USD Million)
- Table 5 Others Market Estimates And Forecasts, 2018 - 2030 (Kilotons) (USD Million)
- Table 6 Post-consumer Recycled Plastics Market Estimates And Forecasts, By Type, 2018 - 2030 (Kilotons) (USD Million)
- Table 7 Polypropylene (PP) Market Estimates And Forecasts, 2018 - 2030 (Kilotons) (USD Million)
- Table 8 Polystyrene (PS) Market Estimates And Forecasts, 2018 - 2030 (Kilotons) (USD Million)
- Table 9 Polyethylene (PE) Market Estimates And Forecasts, 2018 - 2030 (Kilotons) (USD Million)
- Table 10 Polyvinyl Chloride (PVC) Market Estimates And Forecasts, 2018 - 2030 (Kilotons) (USD Million)
- Table 11 Polyurethane (PUR) Market Estimates And Forecasts, 2018 - 2030 (Kilotons) (USD Million)
- Table 12 Polyethylene Terephthalate (PET) Market Estimates And Forecasts, 2018 - 2030 (Kilotons) (USD Million)
- Table 13 Others Market Estimates And Forecasts, 2018 - 2030 (Kilotons) (USD Million)
- Table 14 Post-consumer Recycled Plastics Market Estimates And Forecasts, By Region, 2018 - 2030 (Kilotons) (USD Million)
- Table 15 North America Post-consumer Recycled Plastics Market Estimates And Forecasts, By Country, 2018 - 2030 (Kilotons) (USD Million)
- Table 16 North America Post-consumer Recycled Plastics Market Estimates And Forecasts, By Source, 2018 - 2030 (Kilotons) (USD Million)
- Table 17 North America Post-consumer Recycled Plastics Market Estimates And Forecasts, By Type, 2018 - 2030 (Kilotons) (USD Million)
- Table 18 U.S. Post-consumer Recycled Plastics Market Estimates And Forecasts, By Source, 2018 - 2030 (Kilotons) (USD Million)
- Table 19 U.S. Post-consumer Recycled Plastics Market Estimates And Forecasts, By Type, 2018 - 2030 (Kilotons) (USD Million)
- Table 20 Canada Post-consumer Recycled Plastics Market Estimates And Forecasts, By Source, 2018 - 2030 (Kilotons) (USD Million)
- Table 21 Canada Post-consumer Recycled Plastics Market Estimates And Forecasts, By Type, 2018 - 2030 (Kilotons) (USD Million)
- Table 22 Mexico Post-consumer Recycled Plastics Market Estimates And Forecasts, By Source, 2018 - 2030 (Kilotons) (USD Million)
- Table 23 Mexico Post-consumer Recycled Plastics Market Estimates And Forecasts, By Type, 2018 - 2030 (Kilotons) (USD Million)
- Table 24 Europe Post-consumer Recycled Plastics Market Estimates And Forecasts, By Country, 2018 - 2030 (Kilotons) (USD Million)
- Table 25 Europe Post-consumer Recycled Plastics Market Estimates And Forecasts, By Source, 2018 - 2030 (Kilotons) (USD Million)
- Table 26 Europe Post-consumer Recycled Plastics Market Estimates And Forecasts, By Type, 2018 - 2030 (Kilotons) (USD Million)
- Table 27 Germany Post-consumer Recycled Plastics Market Estimates And Forecasts, By Source, 2018 - 2030 (Kilotons) (USD Million)
- Table 28 Germany Post-consumer Recycled Plastics Market Estimates And Forecasts, By Type, 2018 - 2030 (Kilotons) (USD Million)
- Table 29 UK Post-consumer Recycled Plastics Market Estimates And Forecasts, By Source, 2018 - 2030 (Kilotons) (USD Million)
- Table 30 UK Post-consumer Recycled Plastics Market Estimates And Forecasts, By Type, 2018 - 2030 (Kilotons) (USD Million)
- Table 31 France Post-consumer Recycled Plastics Market Estimates And Forecasts, By Source, 2018 - 2030 (Kilotons) (USD Million)
- Table 32 France Post-consumer Recycled Plastics Market Estimates And Forecasts, By Type, 2018 - 2030 (Kilotons) (USD Million)
- Table 33 Italy Post-consumer Recycled Plastics Market Estimates And Forecasts, By Source, 2018 - 2030 (Kilotons) (USD Million)
- Table 34 Italy Post-consumer Recycled Plastics Market Estimates And Forecasts, By Type, 2018 - 2030 (Kilotons) (USD Million)
- Table 35 Asia Pacific Post-consumer Recycled Plastics Market Estimates And Forecasts, By Country, 2018 - 2030 (Kilotons) (USD Million)
- Table 36 Asia Pacific Post-consumer Recycled Plastics Market Estimates And Forecasts, By Source, 2018 - 2030 (Kilotons) (USD Million)
- Table 37 Asia Pacific Post-consumer Recycled Plastics Market Estimates And Forecasts, By Type, 2018 - 2030 (Kilotons) (USD Million)
- Table 38 China Post-consumer Recycled Plastics Market Estimates And Forecasts, By Source, 2018 - 2030 (Kilotons) (USD Million)
- Table 39 China Post-consumer Recycled Plastics Market Estimates And Forecasts, By Type, 2018 - 2030 (Kilotons) (USD Million)
- Table 40 India Post-consumer Recycled Plastics Market Estimates And Forecasts, By Source, 2018 - 2030 (Kilotons) (USD Million)
- Table 41 India Post-consumer Recycled Plastics Market Estimates And Forecasts, By Type, 2018 - 2030 (Kilotons) (USD Million)
- Table 42 Japan Post-consumer Recycled Plastics Market Estimates And Forecasts, By Source, 2018 - 2030 (Kilotons) (USD Million)
- Table 43 Japan Post-consumer Recycled Plastics Market Estimates And Forecasts, By Type, 2018 - 2030 (Kilotons) (USD Million)
- Table 44 Malaysia Post-consumer Recycled Plastics Market Estimates And Forecasts, By Source, 2018 - 2030 (Kilotons) (USD Million)
- Table 45 Malaysia Post-consumer Recycled Plastics Market Estimates And Forecasts, By Type, 2018 - 2030 (Kilotons) (USD Million)
- Table 46 Latin America Post-consumer Recycled Plastics Market Estimates And Forecasts, By Country, 2018 - 2030 (Kilotons) (USD Million)
- Table 47 Latin America Post-consumer Recycled Plastics Market Estimates And Forecasts, By Source, 2018 - 2030 (Kilotons) (USD Million)
- Table 48 Latin America Post-consumer Recycled Plastics Market Estimates And Forecasts, By Type, 2018 - 2030 (Kilotons) (USD Million)
- Table 49 Brazil Post-consumer Recycled Plastics Market Estimates And Forecasts, By Source, 2018 - 2030 (Kilotons) (USD Million)
- Table 50 Brazil Post-consumer Recycled Plastics Market Estimates And Forecasts, By Type, 2018 - 2030 (Kilotons) (USD Million)
- Table 51 Middle East & Africa Post-consumer Recycled Plastics Market Estimates And Forecasts, By Source, 2018 - 2030 (Kilotons) (USD Million)
- Table 52 Middle East & Africa Post-consumer Recycled Plastics Market Estimates And Forecasts, By Country, 2018 - 2030 (Kilotons) (USD Million)
- Table 53 Middle East & Africa Post-consumer Recycled Plastics Market Estimates And Forecasts, By Type, 2018 - 2030 (Kilotons) (USD Million)
- Table 54 Saudi Arabia Post-consumer Recycled Plastics Market Estimates And Forecasts, By Source, 2018 - 2030 (Kilotons) (USD Million)
- Table 55 Saudi Arabia Post-consumer Recycled Plastics Market Estimates And Forecasts, By Type, 2018 - 2030 (Kilotons) (USD Million)
List of Figures
- Fig. 1 Market Segmentation
- Fig. 2 Information Procurement
- Fig. 3 Data Analysis Models
- Fig. 4 Market Formulation and Validation
- Fig. 5 Market Snapshot
- Fig. 6 Segmental Outlook- Source, Type, and Region
- Fig. 7 Competitive Outlook
- Fig. 8 Value Chain Analysis
- Fig. 9 Market Dynamics
- Fig. 10 Porter's Analysis
- Fig. 11 PESTEL analysis
- Fig. 12 Post-consumer Recycled Plastics Market, By Source: Key Takeaways
- Fig. 13 Post-consumer Recycled Plastics Market, By Source: Market Share, 2024 & 2030
- Fig. 14 Post-consumer Recycled Plastics Market, By Type: Key Takeaways
- Fig. 15 Post-consumer Recycled Plastics Market, By Type: Market Share, 2024 & 2030
- Fig. 16 Post-consumer Recycled Plastics Market, By Region: Key Takeaways
- Fig. 17 Post-consumer Recycled Plastics Market, By Region: Market Share, 2024 & 2030
Post-consumer Recycled Plastics Market Growth & Trends:
The global post-consumer recycled plastics market size is expected to reach USD 21.64 billion by 2030, registering a CAGR of 10.4% from 2025 to 2030, according to a new report by Grand View Research, Inc. Increasing environmental concerns, growing urbanization, industrialization, and rising concerns to reduce the carbon footprint in the manufacturing of plastic resin are expected to drive the market
Demand for post-consumer recycled plastics is expected to increase majorly in the packaging application and various industries, including electrical and electronics, food and beverages, automotive, and textiles. Fast-moving consumer goods (FMCG) and food and beverage are the primary sectors driving the demand for post-consumer recycled plastics. In addition, post-consumer recycled plastics are used in the production of various plastics. Rising environmental concerns and various government regulations to reduce the carbon footprint are expected to drive the demand for post-consumer recycled plastic.
The global market is segmented based on type as polyethylene terephthalate (PET), polypropylene (PP), polystyrene (PS), polyethylene (PE), polyvinyl chloride (PVC), and polyurethane (PUR). Polyethylene was the prominent source segment and accounted for over 20.0% share of the global revenue in the year 2019. The polystyrene segment is expected to witness significant growth in the future due to the high demand for packaging products, such as films, sheets, and foam, which are used in a wide range of industries.
Post-consumer Recycled Plastics Market Report Highlights:
- The bottles segment held the dominant position in the market, with the largest revenue share of 75.4% in 2024, owing to the extensive use of plastic bottles across various industries, particularly in food and beverage packaging.
- Polyethylene (PE) led the market and accounted for the largest revenue share of 20.1% in 2024. This growth is attributed to its widespread application in packaging, particularly in flexible and rigid formats.
- The Asia Pacific post-consumer recycled plastics market dominated the global market and accounted for the largest revenue share of 45.1% in 2024.
Table of Contents
Chapter 1. Methodology and Scope
- 1.1. Market Segmentation & Scope
- 1.2. Market Definition
- 1.3. Information Procurement
- 1.3.1. Purchased Database
- 1.3.2. GVR's Internal Database
- 1.3.3. Secondary Sources & Third-Party Perspectives
- 1.3.4. Primary Research
- 1.4. Information Analysis
- 1.4.1. Data Analysis Models
- 1.5. Market Formulation & Data Visualization
- 1.6. Data Validation & Publishing
Chapter 2. Executive Summary
- 2.1. Market Insights
- 2.2. Segmental Outlook
- 2.3. Competitive Outlook
Chapter 3. Post-consumer Recycled Plastics Market Variables, Trends & Scope
- 3.1. Global Post-consumer Recycled Plastics Market Outlook
- 3.2. Industry Value Chain Analysis
- 3.3. Technology Overview
- 3.4. Average Price Trend Analysis
- 3.5. Supply-Demand Gap Analysis, 2024
- 3.6. Regulatory Framework
- 3.6.1. Policies and Incentive Plans
- 3.6.2. Standards and Compliances
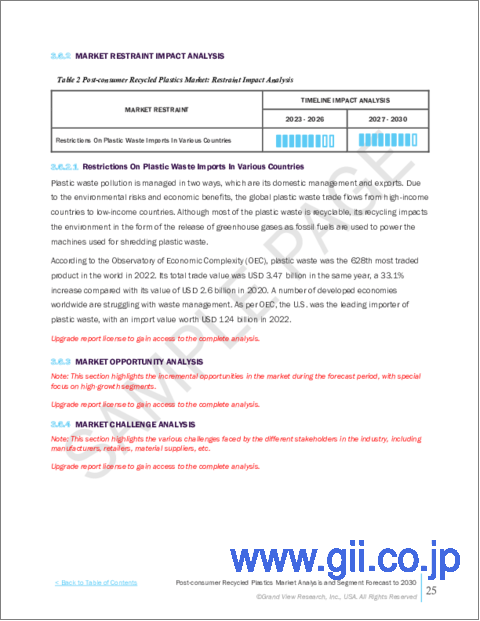
- 3.6.3. Regulatory Impact Analysis
- 3.7. Market Dynamics
- 3.7.1. Market Driver Analysis
- 3.7.2. Market Restraint Analysis
- 3.7.3. Industry Challenges
- 3.8. Porter's Five Forces Analysis
- 3.8.1. Supplier Power
- 3.8.2. Buyer Power
- 3.8.3. Substitution Threat
- 3.8.4. Threat From New Entrant
- 3.8.5. Competitive Rivalry
- 3.9. PESTEL Analysis
- 3.9.1. Political Landscape
- 3.9.2. Economic Landscape
- 3.9.3. Social Landscape
- 3.9.4. Technological Landscape
- 3.9.5. Environmental Landscape
- 3.9.6. Legal Landscape
Chapter 4. Post-consumer Recycled Plastics Market: Source Outlook Estimates & Forecasts
- 4.1. Post-consumer Recycled Plastics Market: Source Movement Analysis, 2024 & 2030
- 4.1.1. Bottles
- 4.1.1.1. Market Estimates and Forecast, 2018 - 2030 (Kilotons) (USD Million)
- 4.1.2. Non-bottle Rigid
- 4.1.2.1. Market Estimates and Forecast, 2018 - 2030 (Kilotons) (USD Million)
- 4.1.3. Others
- 4.1.3.1. Market Estimates and Forecast, 2018 - 2030 (Kilotons) (USD Million)
- 4.1.1. Bottles
Chapter 5. Post-consumer Recycled Plastics Market: Type Outlook Estimates & Forecasts
- 5.1. Post-consumer Recycled Plastics Market: Type Movement Analysis, 2024 & 2030
- 5.1.1. Polypropylene (PP)
- 5.1.1.1. Market Estimates and Forecast, 2018 - 2030 (Kilotons) (USD Million)
- 5.1.2. Polystyrene (PS)
- 5.1.2.1. Market Estimates and Forecast, 2018 - 2030 (Kilotons) (USD Million)
- 5.1.3. Polyethylene (PE)
- 5.1.3.1. Market Estimates and Forecast, 2018 - 2030 (Kilotons) (USD Million)
- 5.1.4. Polyvinyl Chloride (PVC)
- 5.1.4.1. Market Estimates and Forecast, 2018 - 2030 (Kilotons) (USD Million)
- 5.1.5. Polyurethane (PUR)
- 5.1.5.1. Market Estimates and Forecast, 2018 - 2030 (Kilotons) (USD Million)
- 5.1.6. Polyethylene Terephthalate (PET)
- 5.1.6.1. Market Estimates and Forecast, 2018 - 2030 (Kilotons) (USD Million)
- 5.1.7. Others
- 5.1.7.1. Market Estimates and Forecast, 2018 - 2030 (Kilotons) (USD Million)
- 5.1.1. Polypropylene (PP)
Chapter 6. Post-consumer Recycled Plastics Market Regional Outlook Estimates & Forecasts
- 6.1. Regional Snapshot
- 6.2. Post-consumer Recycled Plastics Market: Regional Movement Analysis, 2024 & 2030
- 6.3. North America
- 6.3.1. Market Estimates and Forecast, 2018 - 2030 (Kilotons) (USD Million)
- 6.3.2. Market Estimates and Forecast, By Source, 2018 - 2030 (Kilotons) (USD Million)
- 6.3.3. Market Estimates and Forecast, By Type, 2018 - 2030 (Kilotons) (USD Million)
- 6.3.4. U.S.
- 6.3.4.1. Market Estimates and Forecast, 2018 - 2030 (Kilotons) (USD Million)
- 6.3.4.2. Market Estimates and Forecast, By Source, 2018 - 2030 (Kilotons) (USD Million)
- 6.3.4.3. Market Estimates and Forecast, By Type, 2018 - 2030 (Kilotons) (USD Million)
- 6.3.5. Canada
- 6.3.5.1. Market Estimates and Forecast, 2018 - 2030 (Kilotons) (USD Million)
- 6.3.5.2. Market Estimates and Forecast, By Source, 2018 - 2030 (Kilotons) (USD Million)
- 6.3.5.3. Market Estimates and Forecast, By Type, 2018 - 2030 (Kilotons) (USD Million)
- 6.3.6. Mexico
- 6.3.6.1. Market Estimates and Forecast, 2018 - 2030 (Kilotons) (USD Million)
- 6.3.6.2. Market Estimates and Forecast, By Source, 2018 - 2030 (Kilotons) (USD Million)
- 6.3.6.3. Market Estimates and Forecast, By Type, 2018 - 2030 (Kilotons) (USD Million)
- 6.4. Europe
- 6.4.1. Market Estimates and Forecast, 2018 - 2030 (Kilotons) (USD Million)
- 6.4.2. Market Estimates and Forecast, By Source, 2018 - 2030 (Kilotons) (USD Million)
- 6.4.3. Market Estimates and Forecast, By Type, 2018 - 2030 (Kilotons) (USD Million)
- 6.4.4. Germany
- 6.4.4.1. Market Estimates and Forecast, 2018 - 2030 (Kilotons) (USD Million)
- 6.4.4.2. Market Estimates and Forecast, By Source, 2018 - 2030 (Kilotons) (USD Million)
- 6.4.4.3. Market Estimates and Forecast, By Type, 2018 - 2030 (Kilotons) (USD Million)
- 6.4.5. UK
- 6.4.5.1. Market Estimates and Forecast, 2018 - 2030 (Kilotons) (USD Million)
- 6.4.5.2. Market Estimates and Forecast, By Source, 2018 - 2030 (Kilotons) (USD Million)
- 6.4.5.3. Market Estimates and Forecast, By Type, 2018 - 2030 (Kilotons) (USD Million)
- 6.4.6. France
- 6.4.6.1. Market Estimates and Forecast, 2018 - 2030 (Kilotons) (USD Million)
- 6.4.6.2. Market Estimates and Forecast, By Source, 2018 - 2030 (Kilotons) (USD Million)
- 6.4.6.3. Market Estimates and Forecast, By Type, 2018 - 2030 (Kilotons) (USD Million)
- 6.4.7. Italy
- 6.4.7.1. Market Estimates and Forecast, 2018 - 2030 (Kilotons) (USD Million)
- 6.4.7.2. Market Estimates and Forecast, By Source, 2018 - 2030 (Kilotons) (USD Million)
- 6.4.7.3. Market Estimates and Forecast, By Type, 2018 - 2030 (Kilotons) (USD Million)
- 6.5. Asia Pacific
- 6.5.1. Market Estimates and Forecast, 2018 - 2030 (Kilotons) (USD Million)
- 6.5.2. Market Estimates and Forecast, By Source, 2018 - 2030 (Kilotons) (USD Million)
- 6.5.3. Market Estimates and Forecast, By Type, 2018 - 2030 (Kilotons) (USD Million)
- 6.5.4. China
- 6.5.4.1. Market Estimates and Forecast, 2018 - 2030 (Kilotons) (USD Million)
- 6.5.4.2. Market Estimates and Forecast, By Source, 2018 - 2030 (Kilotons) (USD Million)
- 6.5.4.3. Market Estimates and Forecast, By Type, 2018 - 2030 (Kilotons) (USD Million)
- 6.5.5. India
- 6.5.5.1. Market Estimates and Forecast, 2018 - 2030 (Kilotons) (USD Million)
- 6.5.5.2. Market Estimates and Forecast, By Source, 2018 - 2030 (Kilotons) (USD Million)
- 6.5.5.3. Market Estimates and Forecast, By Type, 2018 - 2030 (Kilotons) (USD Million)
- 6.5.6. Japan
- 6.5.6.1. Market Estimates and Forecast, 2018 - 2030 (Kilotons) (USD Million)
- 6.5.6.2. Market Estimates and Forecast, By Source, 2018 - 2030 (Kilotons) (USD Million)
- 6.5.6.3. Market Estimates and Forecast, By Type, 2018 - 2030 (Kilotons) (USD Million)
- 6.5.7. Malaysia
- 6.5.7.1. Market Estimates and Forecast, 2018 - 2030 (Kilotons) (USD Million)
- 6.5.7.2. Market Estimates and Forecast, By Source, 2018 - 2030 (Kilotons) (USD Million)
- 6.5.7.3. Market Estimates and Forecast, By Type, 2018 - 2030 (Kilotons) (USD Million)
- 6.6. Latin America
- 6.6.1. Market Estimates and Forecast, 2018 - 2030 (Kilotons) (USD Million)
- 6.6.2. Market Estimates and Forecast, By Source, 2018 - 2030 (Kilotons) (USD Million)
- 6.6.3. Market Estimates and Forecast, By Type, 2018 - 2030 (Kilotons) (USD Million)
- 6.6.4. Brazil
- 6.6.4.1. Market Estimates and Forecast, 2018 - 2030 (Kilotons) (USD Million)
- 6.6.4.2. Market Estimates and Forecast, By Source, 2018 - 2030 (Kilotons) (USD Million)
- 6.6.4.3. Market Estimates and Forecast, By Type, 2018 - 2030 (Kilotons) (USD Million)
- 6.7. Middle East & Africa
- 6.7.1. Market Estimates and Forecast, 2018 - 2030 (Kilotons) (USD Million)
- 6.7.2. Market Estimates and Forecast, By Source, 2018 - 2030 (Kilotons) (USD Million)
- 6.7.3. Market Estimates and Forecast, By Type, 2018 - 2030 (Kilotons) (USD Million)
- 6.7.4. Saudi Arabia
- 6.7.4.1. Market Estimates and Forecast, 2018 - 2030 (Kilotons) (USD Million)
- 6.7.4.2. Market Estimates and Forecast, By Source, 2018 - 2030 (Kilotons) (USD Million)
- 6.7.4.3. Market Estimates and Forecast, By Type, 2018 - 2030 (Kilotons) (USD Million)
Chapter 7. Competitive Landscape
- 7.1. Recent Developments & Impact Analysis, By Key Market Participants
- 7.2. Vendor Landscape
- 7.2.1. Company Categorization
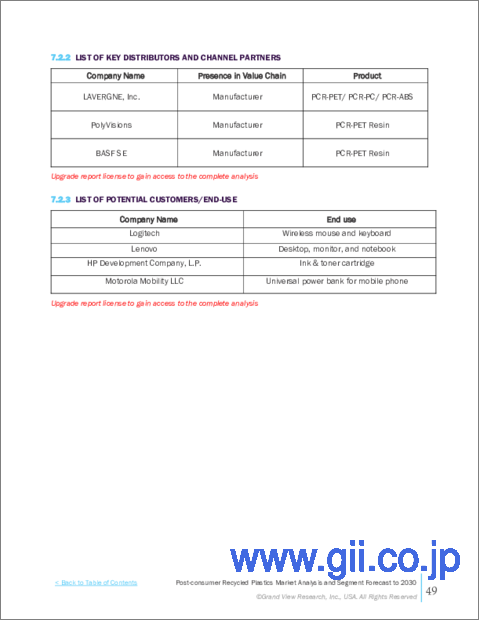
- 7.2.2. List Of Key Distributors and Channel Partners
- 7.2.3. List Of Potential Customers/End-users
- 7.3. Competitive Dynamics
- 7.3.1. Competitive Benchmarking
- 7.3.2. Strategy Mapping
- 7.3.3. Heat Map Analysis
- 7.4. Company Profiles/Listing
- 7.4.1. BASF SE
- 7.4.1.1. Participant's Overview
- 7.4.1.2. Financial Performance
- 7.4.1.3. Product Benchmarking
- 7.4.1.4. Strategic Initiatives
- 7.4.2. SABIC
- 7.4.2.1. Participant's Overview
- 7.4.2.2. Financial Performance
- 7.4.2.3. Product Benchmarking
- 7.4.2.4. Strategic Initiatives
- 7.4.3. Evonik Industries AG
- 7.4.3.1. Participant's Overview
- 7.4.3.2. Financial Performance
- 7.4.3.3. Product Benchmarking
- 7.4.3.4. Strategic Initiatives
- 7.4.4. Sumitomo Chemical Co., Ltd.
- 7.4.4.1. Participant's Overview
- 7.4.4.2. Financial Performance
- 7.4.4.3. Product Benchmarking
- 7.4.4.4. Strategic Initiatives
- 7.4.5. Arkema
- 7.4.5.1. Participant's Overview
- 7.4.5.2. Financial Performance
- 7.4.5.3. Product Benchmarking
- 7.4.5.4. Strategic Initiatives
- 7.4.6. LyondellBasell Industries N.V.
- 7.4.6.1. Participant's Overview
- 7.4.6.2. Financial Performance
- 7.4.6.3. Product Benchmarking
- 7.4.6.4. Strategic Initiatives
- 7.4.7. Celanese Corporation
- 7.4.7.1. Participant's Overview
- 7.4.7.2. Financial Performance
- 7.4.7.3. Product Benchmarking
- 7.4.7.4. Strategic Initiatives
- 7.4.8. Eastman Chemical Company
- 7.4.8.1. Participant's Overview
- 7.4.8.2. Financial Performance
- 7.4.8.3. Product Benchmarking
- 7.4.8.4. Strategic Initiatives
- 7.4.9. Chevron Phillips Chemical Company
- 7.4.9.1. Participant's Overview
- 7.4.9.2. Financial Performance
- 7.4.9.3. Product Benchmarking
- 7.4.9.4. Strategic Initiatives
- 7.4.10. SUEZ SA
- 7.4.10.1. Participant's Overview
- 7.4.10.2. Financial Performance
- 7.4.10.3. Product Benchmarking
- 7.4.10.4. Strategic Initiatives
- 7.4.11. Exxon Mobil Corporation
- 7.4.11.1. Participant's Overview
- 7.4.11.2. Financial Performance
- 7.4.11.3. Product Benchmarking
- 7.4.11.4. Strategic Initiatives
- 7.4.12. Covestro AG
- 7.4.12.1. Participant's Overview
- 7.4.12.2. Financial Performance
- 7.4.12.3. Product Benchmarking
- 7.4.12.4. Strategic Initiatives
- 7.4.1. BASF SE
