|
|
市場調査レポート
商品コード
1611725
米国の冷凍食品市場規模、シェア、動向分析レポート:製品別、流通チャネル別、地域別、セグメント別予測、2025~2030年U.S. Frozen Food Market Size, Share & Trends Analysis Report By Product (Frozen Meals, Meat/Poultry/Seafood, Desserts, Fruits & Vegetables, Snacks, Baked Goods), By Distribution Channel, By Region, And Segment Forecasts, 2025 - 2030 |
||||||
|
|||||||
カスタマイズ可能
|
|||||||

| 米国の冷凍食品市場規模、シェア、動向分析レポート:製品別、流通チャネル別、地域別、セグメント別予測、2025~2030年 |
|
出版日: 2024年11月19日
発行: Grand View Research
ページ情報: 英文 107 Pages
納期: 2~10営業日
|

全表示
- 概要
- 図表
- 目次
米国の冷凍食品市場の成長と動向
Grand View Research, Inc.の最新レポートによると、米国の冷凍食品市場規模は2030年に1,326億7,000万米ドルに達すると推定され、2025~2030年にかけてCAGR 8.1%で拡大すると予測されています。
米国における冷凍食品市場の需要は、消費者のライフスタイルの変化、食品保存技術の向上、利便性と栄養への嗜好の高まりなどの要因によって増加しています。多くの米国人が忙しい生活を送り、食事の準備に費やす時間が少なくなっているため、冷凍食品は味や栄養面で妥協することなく、手早く利用できる選択肢を提供しています。共働き世帯の増加や労働時間の延長も、すぐに食べられて調理が簡単な食事の選択肢に対する需要を高めており、冷凍食品部門はこれに効果的に対応しています。
健康動向はこの市場にさらなる影響を与えており、各社はオーガニック、植物性、グルテンフリー、低カロリーなど、食生活の嗜好に対応した冷凍食品を発売しています。こうした多様性は、便利でありながら栄養価の高い食事の選択肢を求める健康志向の消費者にアピールしています。冷凍技術の革新も冷凍食品の品質と栄養保持力を高め、食品の品質を気にする消費者にとってより魅力的なものとなっています。
さらに、サプライチェーンが進歩し、eコマースチャネルで冷凍食品が入手できるようになったことで、消費者は幅広い製品に簡単にアクセスできるようになりました。COVID-19の大流行は、消費者が保存期間の長い保存可能な選択肢を求め、その利便性と食品廃棄の可能性を減らすために冷凍食品を好むようになり、このシフトを加速させました。消費者が食品の選択において利便性と品質の両方を優先させるため、こうした動向は米国の冷凍食品市場の成長を引き続き促進すると予想されます。
米国の冷凍食品市場レポートハイライト
- 米国の冷凍スナックは2025~2030年にかけてCAGR 11.6%の成長が見込まれます。多忙なスケジュール、利便性、eコマースの拡大、ライフスタイルの変化が冷凍スナックの需要を促進しています。キャリアアップの機会を求めて都市部に移り住む人が増え、ペースの速いライフスタイルが冷凍スナックのような便利な代替食品へのニーズを高めています。
- オンラインチャネルを通じた販売は、2025~2030年にかけてCAGR 12.3%の成長が見込まれます。インターネット普及率の上昇はデジタル時代の到来に貢献し、消費者は好みの冷凍食品をオンラインで注文しやすくなっています。オンラインストアはしばしば特別キャンペーン、割引、ロイヤルティプログラムを提供し、冷凍食品を節約したい消費者を引きつける。これらの店舗はまた、より幅広い顧客層にリーチし、個々の嗜好に対応し、よりシームレスなショッピング体験のために顧客データを保存する能力を持っています。
目次
第1章 調査手法と範囲
第2章 エグゼクティブサマリー
第3章 米国の冷凍食品市場の変数、動向、範囲
- 市場系統の展望
- 世界の冷凍食品市場規模、2018~2030年
- 浸透と成長の展望マッピング
- 産業バリューチェーン分析
- 原料の動向展望
- 製造と技術の動向
- 販売/小売チャネル分析
- 利益率分析
- 市場力学
- 市場促進要因分析
- 市場抑制要因分析
- 市場機会
- 市場課題
- 産業分析-ポーターのファイブフォース分析
- 市場参入戦略
第4章 米国の冷凍食品市場: 消費者行動分析
- 人口統計分析
- 消費者の動向と嗜好
- 購買行動に影響を与える要因
- 消費者向けサービスの採用動向
- 主要観察と発見
第5章 米国の冷凍食品市場:製品別、推定・動向分析
- 米国の冷凍食品市場、製品別:主要ポイント
- 製品変動分析と市場シェア、2024年と2030年
- 製品別、2018~2030年
- 冷凍食品
- 肉類/鶏肉/魚介類
- デザート
- 果物と野菜
- スナック
- 焼き菓子
第6章 米国の冷凍食品市場:流通チャネル別、推定・動向分析
- 米国の冷凍食品市場、流通チャネル別:主要ポイント
- 流通チャネル変動分析と市場シェア、2024年と2030年
- 流通チャネル別、2018~2030年
- 伝統的食料品店
- ハイパーマーケットとスーパーマーケット
- ディスカウントストア
- クラブストア
- オンライン
- その他
第7章 米国の冷凍食品市場: 州別、推定・動向分析
- 米国の冷凍食品市場:国別展望
- 州の変動分析と市場シェア、2024年と2030年
- 国別・州別、2018~2030年
- 米国
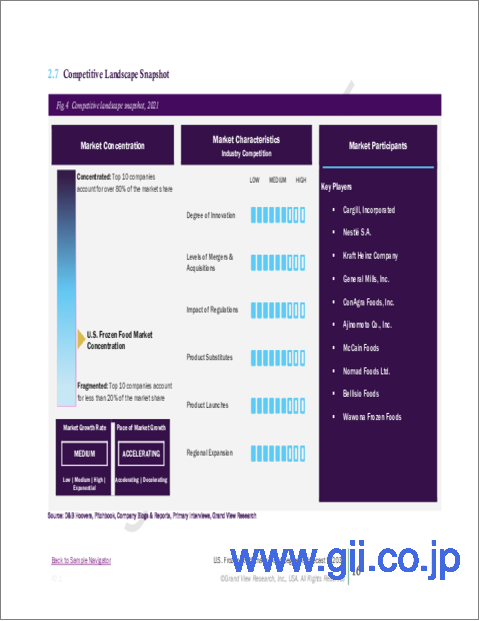
第8章 競合分析
- 主要市場参入企業による最近の動向と影響分析
- 企業分類
- 参入企業概要
- 製品ポートフォリオ
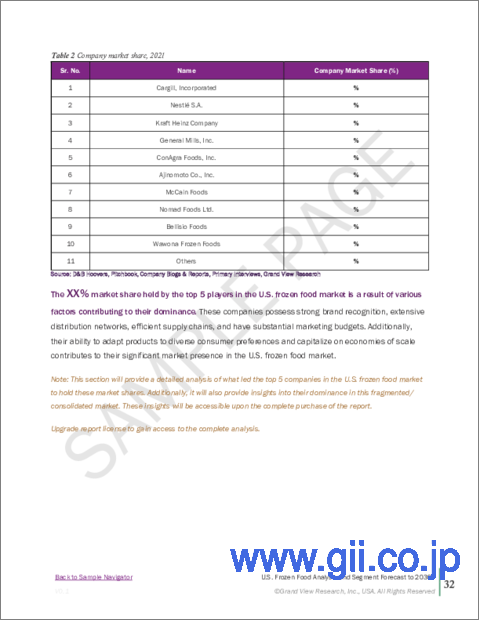
- 企業市場シェア分析、2024年(%)
- 企業ヒートマップ分析
- 戦略マッピング
- 企業プロファイル
- Unilever PLC
- Nestle SA
- General Mills, Inc.
- Nomad Foods Ltd.
- Tyson Foods Inc.
- Conagra Brands Inc.
- Wawona Frozen Foods
- Bellisio Parent, LLC
- McCain Foods
- The Kraft Heinz Company
List of Tables
- Table 1. U.S. frozen food market - Key market driver analysis
- Table 2. U.S. frozen food market - Key market restraint analysis
- Table 3. U.S. frozen food market estimates & forecast, by product (USD Million)
- Table 4. U.S. frozen food market estimates & forecast, by distribution channel (USD Million)
- Table 5. Southeast U.S. macro-economic outlay
- Table 6. Southeast U.S. frozen food market estimates and forecast, 2018 - 2030 (USD Million)
- Table 7. Southeast U.S. frozen food market revenue estimates and forecast by product, 2018 - 2030 (USD Million)
- Table 8. Southeast U.S. frozen food market revenue estimates and forecast by distribution channel, 2018 - 2030 (USD Million)
- Table 9. Northeast U.S. macro-economic outlay
- Table 10. Northeast U.S. frozen food market estimates and forecast, 2018 - 2030 (USD Million)
- Table 11. Northeast U.S. frozen food market revenue estimates and forecast by product, 2018 - 2030 (USD Million)
- Table 12. Northeast U.S. frozen food market revenue estimates and forecast by distribution channel, 2018 - 2030 (USD Million)
- Table 13. Great Lakes U.S. macro-economic outlay
- Table 14. Great Lakes U.S. frozen food market estimates and forecast, 2018 - 2030 (USD Million)
- Table 15. Great Lakes U.S. frozen food market revenue estimates and forecast by product, 2018 - 2030 (USD Million)
- Table 16. Great Lakes U.S. frozen food market revenue estimates and forecast by distribution channel, 2018 - 2030 (USD Million)
- Table 17. Mid-South U.S. macro-economic outlay
- Table 18. Mid-South U.S. frozen food market estimates and forecast, 2018 - 2030 (USD Million)
- Table 19. Mid-South U.S. frozen food market revenue estimates and forecast by product, 2018 - 2030 (USD Million)
- Table 20. Mid-South U.S. frozen food market revenue estimates and forecast by distribution channel, 2018 - 2030 (USD Million)
- Table 21. South Central macro-economic outlay
- Table 22. South Central U.S. frozen food market estimates and forecast, 2018 - 2030 (USD Million)
- Table 23. South Central U.S. frozen food market revenue estimates and forecast by product, 2018 - 2030 (USD Million)
- Table 24. South Central U.S. frozen food market revenue estimates and forecast by distribution channel, 2018 - 2030 (USD Million)
- Table 25. West macro-economic outlay
- Table 26. West U.S. frozen food market estimates and forecast, 2018 - 2030 (USD Million)
- Table 27. West U.S. frozen food market revenue estimates and forecast by product, 2018 - 2030 (USD Million)
- Table 28. West U.S. frozen food market revenue estimates and forecast by distribution channel, 2018 - 2030 (USD Million)
- Table 29. California macro-economic outlay
- Table 30. California U.S. frozen food market estimates and forecast, 2018 - 2030 (USD Million)
- Table 31. California U.S. frozen food market revenue estimates and forecast by product, 2018 - 2030 (USD Million)
- Table 32. California U.S. frozen food market revenue estimates and forecast by distribution channel, 2018 - 2030 (USD Million)
- Table 33. Plains macro-economic outlay
- Table 34. Plains U.S. frozen food market estimates and forecast, 2018 - 2030 (USD Million)
- Table 35. Plains U.S. frozen food market revenue estimates and forecast by product, 2018 - 2030 (USD Million)
- Table 36. Plains U.S. frozen food market revenue estimates and forecast by distribution channel, 2018 - 2030 (USD Million)
- Table 37. Recent developments & impact analysis, by key market participants
- Table 38. Company market share, 2024
- Table 39. Company heat map analysis
- Table 40. Companies undergoing key strategies
List of Figures
- Fig. 1 U.S. frozen food market segmentation
- Fig. 2 Information procurement
- Fig. 3 Primary research pattern
- Fig. 4 Primary research approaches
- Fig. 5 Primary research process
- Fig. 6 Market snapshot
- Fig. 7 Product snapshot
- Fig. 8 Distribution channel snapshot
- Fig. 9 Regional snapshot
- Fig. 10 Competitive landscape snapshot
- Fig. 11 U.S. frozen food market size, 2018 to 2030 (USD Million)
- Fig. 12 U.S. frozen food market: Penetration & growth prospect mapping
- Fig. 13 U.S. frozen food market: Value chain analysis
- Fig. 14 U.S. frozen food market: Profit margin analysis
- Fig. 15 U.S. frozen food market: Market dynamics
- Fig. 16 U.S. frozen food market: Porter's five forces analysis
- Fig. 17 Factors influencing buying decisions for U.S. frozen food
- Fig. 18 U.S. frozen food market, by product: Key Takeaways
- Fig. 19 U.S. frozen food market: Product movement analysis, 2024 & 2030 (%)
- Fig. 20 U.S. frozen meals market estimates and forecast, 2018 - 2030 (USD Million)
- Fig. 21 U.S. frozen meat/ poultry/seafood market estimates and forecast, 2018 - 2030 (USD Million)
- Fig. 22 U.S. frozen desserts market estimates and forecast, 2018 - 2030 (USD Million)
- Fig. 23 U.S. frozen fruits & vegetables market estimates and forecast, 2018 - 2030 (USD Million)
- Fig. 24 U.S. frozen snacks market estimates and forecast, 2018 - 2030 (USD Million)
- Fig. 25 U.S. frozen baked goods market estimates and forecast, 2018 - 2030 (USD Million)
- Fig. 26 U.S. frozen food market, by distribution channel: Key Takeaways
- Fig. 27 U.S. frozen food market: Distribution channel movement analysis, 2024 & 2030 (%)
- Fig. 28 U.S. frozen food market estimates and forecast through traditional grocery stores, 2018 - 2030 (USD Million)
- Fig. 29 U.S. frozen food market estimates and forecast through hypermarkets & supermarkets, 2018 - 2030 (USD Million)
- Fig. 30 U.S. frozen food market estimates and forecast through club stores, 2018 - 2030 (USD Million)
- Fig. 31 U.S. frozen food market estimates and forecast through discount stores, 2018 - 2030 (USD Million)
- Fig. 32 U.S. frozen food market estimates and forecast through online stores, 2018 - 2030 (USD Million)
- Fig. 33 U.S. frozen food market estimates and forecast through other stores, 2018 - 2030 (USD Million)
- Fig. 34 U.S. Frozen Food market: Regional outlook, 2024 & 2030 (USD Million)
- Fig. 35 Country marketplace: Key takeaways
- Fig. 36 U.S. frozen food market estimates and forecast, 2018 - 2030 (USD Million)
- Fig. 37 Southeast U.S. frozen food market estimates and forecast, 2018 - 2030 (USD Million)
- Fig. 38 Northeast U.S. frozen food market estimates and forecast, 2018 - 2030 (USD Million)
- Fig. 39 Great Lakes U.S. frozen food market estimates and forecast, 2018 - 2030 (USD Million)
- Fig. 40 Mid-South U.S. frozen food market estimates and forecast, 2018 - 2030 (USD Million)
- Fig. 41 West U.S. frozen food market estimates and forecast, 2018 - 2030 (USD Million)
- Fig. 42 California U.S. frozen food market estimates and forecast, 2018 - 2030 (USD Million)
- Fig. 43 Plain U.S. frozen food market estimates and forecast, 2018 - 2030 (USD Million)
- Fig. 44 South Central U.S. frozen food market estimates and forecast, 2018 - 2030 (USD Million)
- Fig. 45 Key company categorization
- Fig. 46 Company market share analysis, 2024
- Fig. 47 Strategic framework of U.S. frozen food market
U.S. Frozen Food Market Growth & Trends:
The U.S. frozen food market size is estimated to reach USD 132.67 billion in 2030 and is anticipated to expand at a CAGR of 8.1% from 2025 to 2030, according to a new report by Grand View Research, Inc. The market demand for frozen food in the U.S. is increasing, driven by factors such as changing consumer lifestyles, improved technology in food preservation, and a growing preference for convenience and nutrition. As many Americans lead busy lives with less time for meal preparation, frozen foods offer a quick, accessible option without compromising on taste or nutrition. The rise in dual-income households and longer working hours have also bolstered demand for ready-to-eat and easy-to-prepare meal options, which the frozen food segment caters to effectively.
Health trends have further impacted this market, with companies introducing frozen foods that cater to dietary preferences, including organic, plant-based, gluten-free, and low-calorie options. This variety appeals to health-conscious consumers looking for convenient yet nutritious meal choices. Innovations in freezing technology have also enhanced the quality and nutritional retention of frozen foods, making them more appealing to consumers concerned about food quality?.
In addition, supply chain advancements and expanded availability of frozen food in e-commerce channels have made it easier for consumers to access a wide range of products. The COVID-19 pandemic accelerated this shift as consumers sought out shelf-stable options with longer storage lives, favoring frozen food for its convenience and reduced food waste potential. These trends are expected to keep driving growth in the U.S. frozen food market as consumers prioritize both convenience and quality in their food choices.
U.S. Frozen Food Market Report Highlights:
- U.S. frozen snacks is expected to growth with a CAGR of 11.6% from 2025 to 2030. Busy schedules, convenience, the expansion of e-commerce, and changing lifestyles are driving the demand for frozen snacks. As more people move into urban areas seeking career growth opportunities, fast-paced lifestyles are increasing the need for convenient food alternatives like frozen snacks.
- Sales through online channels are expected to grow at a CAGR of 12.3% from 2025 to 2030. This rise in internet penetration has contributed to the digital era, making consumers more comfortable placing online orders for their preferred frozen food products. Online stores often offer special promotions, discounts, and loyalty programs, which attract consumers looking to save money on frozen foods. These stores also have the ability to reach a wider customer base, cater to individual preferences, and store customer data for a more seamless shopping experience.
Table of Contents
Chapter 1. Methodology and Scope
- 1.1. Market Segmentation & Scope
- 1.2. Market Definition
- 1.3. Information Procurement
- 1.3.1. Purchased Database
- 1.3.2. GVR's Internal Database
- 1.3.3. Secondary Sources & Third-Party Perspectives
- 1.3.4. Primary Research
- 1.4. Information Analysis
- 1.4.1. Data Analysis Models
- 1.5. Market Formulation & Data Visualization
- 1.6. Data Validation & Publishing
Chapter 2. Executive Summary
- 2.1. Market Outlook
- 2.2. Product Outlook
- 2.3. Distribution Channel Outlook
- 2.4. Competitive Landscape Outlook
Chapter 3. U.S. Frozen Food Market Variables, Trends & Scope
- 3.1. Market Lineage Outlook
- 3.1.1. Global Frozen Food Market Size, 2018 - 2030 (USD Million)
- 3.2. Penetration & Growth Prospect Mapping
- 3.3. Industry Value Chain Analysis
- 3.3.1. Raw Material Trends Outlooks
- 3.3.2. Manufacturing and Technology Trends
- 3.3.3. Sales/ Retail Channel Analysis
- 3.3.4. Profit Margin Analysis
- 3.4. Market Dynamics
- 3.4.1. Market Driver Analysis
- 3.4.2. Market Restraint Analysis
- 3.4.3. Market Opportunities
- 3.4.4. Market Challenges
- 3.5. Industry Analysis - Porter's Five Forces Analysis
- 3.6. Market Entry Strategies
Chapter 4. U.S. Frozen Food Market: Consumer Behavior Analysis
- 4.1. Demographic Analysis
- 4.2. Consumer Trends & Preferences
- 4.3. Factors Influencing Buying Behavior
- 4.4. Consumer Service Adoption Trends
- 4.5. Key Observations & Findings
Chapter 5. U.S. Frozen Food Market: Product Estimates & Trend Analysis
- 5.1. U.S. Frozen Food Market, by Product: Key Takeaways
- 5.2. Product Movement Analysis & Market Share, 2024 & 2030
- 5.3. Market Estimates & Forecasts, by Product, 2018 - 2030 (USD Million)
- 5.3.1. Frozen Meals
- 5.3.1.1. Market estimates and forecast, 2018 - 2030 (USD Million)
- 5.3.1.2. Breakfast Food
- 5.3.1.2.1. Market estimates and forecast, 2018 - 2030 (USD Million)
- 5.3.1.3. Dinners/Entrees
- 5.3.1.3.1. Market estimates and forecast, 2018 - 2030 (USD Million)
- 5.3.1.4. Pizza
- 5.3.1.4.1. Market estimates and forecast, 2018 - 2030 (USD Million)
- 5.3.2. Meat/Poultry /Seafood
- 5.3.2.1. Market estimates and forecast, 2018 - 2030 (USD Million)
- 5.3.2.2. Seafood
- 5.3.2.2.1. Market estimates and forecast, 2018 - 2030 (USD Million)
- 5.3.2.3. Processed Poultry
- 5.3.2.3.1. Market estimates and forecast, 2018 - 2030 (USD Million)
- 5.3.2.4. Poultry
- 5.3.2.4.1. Market estimates and forecast, 2018 - 2030 (USD Million)
- 5.3.2.5. Meat
- 5.3.2.5.1. Market estimates and forecast, 2018 - 2030 (USD Million)
- 5.3.3. Desserts
- 5.3.3.1. Market estimates and forecast, 2018 - 2030 (USD Million)
- 5.3.3.2. Ice cream/Sherbet
- 5.3.3.2.1. Market estimates and forecast, 2018 - 2030 (USD Million)
- 5.3.3.3. Novelties
- 5.3.3.3.1. Market estimates and forecast, 2018 - 2030 (USD Million)
- 5.3.3.4. Desserts/Toppings
- 5.3.3.4.1. Market estimates and forecast, 2018 - 2030 (USD Million)
- 5.3.4. Fruits & Vegetables
- 5.3.4.1. Market estimates and forecast, 2018 - 2030 (USD Million)
- 5.3.4.2. Fruits
- 5.3.4.2.1. Market estimates and forecast, 2018 - 2030 (USD Million)
- 5.3.4.2.2. Strawberries
- 5.3.4.2.2.1. Market estimates and forecast, 2018 - 2030 (USD Million)
- 5.3.4.2.3. Raspberries
- 5.3.4.2.3.1. Market estimates and forecast, 2018 - 2030 (USD Million)
- 5.3.4.2.4. Blueberries
- 5.3.4.2.4.1. Market estimates and forecast, 2018 - 2030 (USD Million)
- 5.3.4.2.5. Blackberries
- 5.3.4.2.5.1. Market estimates and forecast, 2018 - 2030 (USD Million)
- 5.3.4.2.6. Peaches
- 5.3.4.2.6.1. Market estimates and forecast, 2018 - 2030 (USD Million)
- 5.3.4.2.7. Cherries
- 5.3.4.2.7.1. Market estimates and forecast, 2018 - 2030 (USD Million)
- 5.3.4.2.8. Apricots
- 5.3.4.2.8.1. Market estimates and forecast, 2018 - 2030 (USD Million)
- 5.3.4.2.9. Apples
- 5.3.4.2.9.1. Market estimates and forecast, 2018 - 2030 (USD Million)
- 5.3.4.2.10. Others
- 5.3.4.2.10.1. Market estimates and forecast, 2018 - 2030 (USD Million)
- 5.3.4.3. Vegetables
- 5.3.4.3.1. Market estimates and forecast, 2018 - 2030 (USD Million)
- 5.3.4.3.2. Mixed Vegetables
- 5.3.4.3.2.1. Market estimates and forecast, 2018 - 2030 (USD Million)
- 5.3.4.3.3. Broccoli
- 5.3.4.3.3.1. Market estimates and forecast, 2018 - 2030 (USD Million)
- 5.3.4.3.4. Beans
- 5.3.4.3.4.1. Market estimates and forecast, 2018 - 2030 (USD Million)
- 5.3.4.3.5. Corn
- 5.3.4.3.5.1. Market estimates and forecast, 2018 - 2030 (USD Million)
- 5.3.4.3.6. Peas
- 5.3.4.3.6.1. Market estimates and forecast, 2018 - 2030 (USD Million)
- 5.3.4.3.7. Prepared Vegetables
- 5.3.4.3.7.1. Market estimates and forecast, 2018 - 2030 (USD Million)
- 5.3.4.3.8. Corn on the Cob
- 5.3.4.3.8.1. Market estimates and forecast, 2018 - 2030 (USD Million)
- 5.3.4.3.9. Spinach
- 5.3.4.3.9.1. Market estimates and forecast, 2018 - 2030 (USD Million)
- 5.3.4.3.10. Onion Rings
- 5.3.4.3.10.1. Market estimates and forecast, 2018 - 2030 (USD Million)
- 5.3.4.3.11. Zucchini
- 5.3.4.3.11.1. Market estimates and forecast, 2018 - 2030 (USD Million)
- 5.3.4.3.12. Carrots
- 5.3.4.3.12.1. Market estimates and forecast, 2018 - 2030 (USD Million)
- 5.3.4.3.13. Onions
- 5.3.4.3.13.1. Market estimates and forecast, 2018 - 2030 (USD Million)
- 5.3.5. Snacks
- 5.3.5.1. Market estimates and forecast, 2018 - 2030 (USD Million)
- 5.3.6. Baked Goods
- 5.3.6.1. Market estimates and forecast, 2018 - 2030 (USD Million)
- 5.3.1. Frozen Meals
Chapter 6. U.S. Frozen Food Market: Distribution Channel Estimates & Trend Analysis
- 6.1. U.S. Frozen Food Market, by Distribution Channel: Key Takeaways
- 6.2. Distribution Channel Movement Analysis & Market Share, 2024 & 2030
- 6.3. Market Estimates & Forecasts, by Distribution Channel, 2018 - 2030 (USD Million)
- 6.3.1. Traditional Grocery Stores
- 6.3.1.1. Market estimates and forecast, 2018 - 2030 (USD Million)
- 6.3.2. Hypermarkets & Supermarkets
- 6.3.2.1. Market estimates and forecast, 2018 - 2030 (USD Million)
- 6.3.3. Discount Stores
- 6.3.3.1. Market estimates and forecast, 2018 - 2030 (USD Million)
- 6.3.4. Club Stores
- 6.3.4.1. Market estimates and forecast, 2018 - 2030 (USD Million)
- 6.3.5. Online
- 6.3.5.1. Market estimates and forecast, 2018 - 2030 (USD Million)
- 6.3.6. Others
- 6.3.6.1. Market estimates and forecast, 2018 - 2030 (USD Million)
- 6.3.1. Traditional Grocery Stores
Chapter 7. U.S. Frozen Food Market: State Estimates & Trend Analysis
- 7.1. U.S. Frozen Food Market: Country Outlook
- 7.2. State Movement Analysis & Market Share, 2024 & 2030
- 7.3. Market Estimates & Forecasts, by Country & State, 2018 - 2030 (USD Million)
- 7.3.1. U.S.
- 7.3.1.1. Market estimates and forecast, 2018 - 2030 (USD Million)
- 7.3.1.2. Southeast
- 7.3.1.2.1. Key country dynamics
- 7.3.1.2.2. Market estimates and forecast, 2018 - 2030 (USD Million)
- 7.3.1.3. North east
- 7.3.1.3.1. Key country dynamics
- 7.3.1.3.2. Market estimates and forecast, 2018 - 2030 (USD Million)
- 7.3.1.4. Great Lakes
- 7.3.1.4.1. Key country dynamics
- 7.3.1.4.2. Market estimates and forecast, 2018 - 2030 (USD Million)
- 7.3.1.5. Mid-South
- 7.3.1.5.1. Key country dynamics
- 7.3.1.5.2. Market estimates and forecast, 2018 - 2030 (USD Million)
- 7.3.1.6. South Central
- 7.3.1.6.1. Key country dynamics
- 7.3.1.6.2. Market estimates and forecast, 2018 - 2030 (USD Million)
- 7.3.1.7. West
- 7.3.1.7.1. Key country dynamics
- 7.3.1.7.2. Market estimates and forecast, 2018 - 2030 (USD Million)
- 7.3.1.8. California
- 7.3.1.8.1. Key country dynamics
- 7.3.1.8.2. Market estimates and forecast, 2018 - 2030 (USD Million)
- 7.3.1.9. Plains
- 7.3.1.9.1. Key country dynamics
- 7.3.1.9.2. Market estimates and forecast, 2018 - 2030 (USD Million)
- 7.3.1. U.S.
Chapter 8. Competitive Analysis
- 8.1. Recent Developments & Impact Analysis, by Key Market Participants
- 8.2. Company Categorization
- 8.3. Participant's Overview
- 8.4. Financial Performance
- 8.5. Product Portfolios
- 8.6. Company Market Share Analysis, 2024 (%)
- 8.7. Company Heat Map Analysis
- 8.8. Strategy Mapping
- 8.9. Company Profiles
- 8.9.1. Unilever PLC
- 8.9.1.1. Company Overview
- 8.9.1.2. Financial Performance
- 8.9.1.3. Product Portfolios
- 8.9.1.4. Strategic Initiatives
- 8.9.2. Nestle S.A.
- 8.9.2.1. Company Overview
- 8.9.2.2. Financial Performance
- 8.9.2.3. Product Portfolios
- 8.9.2.4. Strategic Initiatives
- 8.9.3. General Mills, Inc.
- 8.9.3.1. Company Overview
- 8.9.3.2. Financial Performance
- 8.9.3.3. Product Portfolios
- 8.9.3.4. Strategic Initiatives
- 8.9.4. Nomad Foods Ltd.
- 8.9.4.1. Company Overview
- 8.9.4.2. Financial Performance
- 8.9.4.3. Product Portfolios
- 8.9.4.4. Strategic Initiatives
- 8.9.5. Tyson Foods Inc.
- 8.9.5.1. Company Overview
- 8.9.5.2. Financial Performance
- 8.9.5.3. Product Portfolios
- 8.9.5.4. Strategic Initiatives
- 8.9.6. Conagra Brands Inc.
- 8.9.6.1. Company Overview
- 8.9.6.2. Financial Performance
- 8.9.6.3. Product Portfolios
- 8.9.6.4. Strategic Initiatives
- 8.9.7. Wawona Frozen Foods
- 8.9.7.1. Company Overview
- 8.9.7.2. Financial Performance
- 8.9.7.3. Product Portfolios
- 8.9.7.4. Strategic Initiatives
- 8.9.8. Bellisio Parent, LLC
- 8.9.8.1. Company Overview
- 8.9.8.2. Financial Performance
- 8.9.8.3. Product Portfolios
- 8.9.8.4. Strategic Initiatives
- 8.9.9. McCain Foods
- 8.9.9.1. Company Overview
- 8.9.9.2. Financial Performance
- 8.9.9.3. Product Portfolios
- 8.9.9.4. Strategic Initiatives
- 8.9.10. The Kraft Heinz Company
- 8.9.10.1. Company Overview
- 8.9.10.2. Financial Performance
- 8.9.10.3. Product Portfolios
- 8.9.10.4. Strategic Initiatives
- 8.9.1. Unilever PLC
