|
|
市場調査レポート
商品コード
1588623
グリーン水素の市場規模、シェア、動向分析レポート:技術別、用途別、流通チャネル別、地域別、セグメント予測、2025年~2030年Green Hydrogen Market Size, Share & Trends Analysis Report By Technology, By Application, By Distribution Channel, By Region, And Segment Forecasts, 2025 - 2030 |
||||||
|
|||||||
カスタマイズ可能
|
|||||||

| グリーン水素の市場規模、シェア、動向分析レポート:技術別、用途別、流通チャネル別、地域別、セグメント予測、2025年~2030年 |
|
出版日: 2024年10月25日
発行: Grand View Research
ページ情報: 英文 110 Pages
納期: 2~10営業日
|

全表示
- 概要
- 図表
- 目次
グリーン水素市場の成長と動向:
Grand View Research, Inc.の最新レポートによると、世界のグリーン水素市場規模は2030年までに605億6,000万米ドルに達し、2025年から2030年までのCAGRは38.5%を記録すると予測されています。
化石燃料経済に代わる環境に優しい選択肢として注目されている水素経済とともに、クリーン燃料の利用に有利な政府投資や補助金の増加が、予測期間中の需要を強化する可能性が高いです。
市場は、様々な最終用途産業における再生可能エネルギー源の普及が牽引しています。グリーン水素は、風力エネルギー、太陽エネルギー、その他の再生可能エネルギー源などの再生可能な発電源を用いて、水の電気分解によって製造されます。さらに、再生可能エネルギーの規模の拡大は、クリーンな発電コストの低下をもたらし、それによって予測数年間の市場成長にプラスの影響を与えると推定されます。
アルカリ電解槽セグメントは、グリーン水素プロジェクトで使用される従来の電解槽技術であるため、2021年には市場の66.18%を占めました。アルカリ電解槽は、電解質として水酸化カリウムまたは水酸化ナトリウムの液体アルカリ溶液を使用し、PEM電解槽よりも稼働時間が長いです。しかし、予測期間においてはPEM電解槽の方がアルカリ電解槽よりも高い成長率を示すと予想されます。
2021年の世界グリーン水素市場の約40.61%を占め、用途別では輸送分野が最大でした。輸送産業が化石燃料から太陽エネルギーやグリーン水素のような再生可能エネルギーにシフトしていることが、予測期間においてこのセグメントを押し上げると予想されます。発電分野も、グリーン水素製造のコスト削減により、堅調な成長が見込まれています。
流通チャネルにおけるパイプライン・セグメントは、2021年に市場の63.11%を占めました。パイプラインは、長距離で大量輸送するための最も経済的に実行可能な方法です。貨物セグメントは、グリーン水素の需要増加により、予測期間中にCAGR 40.9%で成長すると予想されます。
北米市場は、クリーンエネルギー政策の実施により米国とカナダがリードしており、予測期間中に突出した成長率を達成すると予想されます。米国では、カリフォルニア州が市場シェアの大半を占めており、2040年までにガスやディーゼルで動く公共バスを廃止するなどの積極的な脱炭化水素目標が成長の原動力となっています。
業界の主要プレーヤーは、電解槽ユニットの高コストを削減するための技術革新と技術進歩に注力しており、グリーン水素製造の商業化を後押ししています。さらに、市場参入企業は、今後数年間、同市場における足場を強化するために、合弁事業、パートナーシップ、M&Aなど、いくつかの戦略的イニシアチブを重視しています。
水素市場における未開拓の可能性に気づいている国々は、今後数年にわたって業界の情勢を強化すると予想されます。2019年10月、シーメンスはオーストラリアにおける5GWの風力・太陽光複合エネルギープロジェクトに関する技術提携を発表しました。同社は、再生可能エネルギーによる電気分解でグリーン水素を生成する電解槽技術を提供する予定です。製造されたクリーン水素はアジア市場に輸出される予定です。
グリーン水素市場レポートハイライト
- アルカリ電解槽は、PEM電解槽技術に比べて資本コストが低く、運転期間も長いため、2024年には65.46%の最大売上シェアを占めました。
- 高分子電解質膜(PEM)電解槽セグメントは、膜厚が薄く、プロトン伝導性が高く、ガス透過性が低いため、予測期間中に最も速い成長率を示すと予想されます。
- 輸送分野は2024年に43.39%の最大収益シェアでリードしています。輸送業界では再生可能エネルギー源の採用が増加しており、予測期間中の成長が期待されます。
- パイプライン流通チャネル・セグメントは、2024年に収益シェアの60.66%を占めました。既存のパイプラインインフラと相まって、パイプライン流通の低コスト化が予測期間中の市場を押し上げると期待されています。
- 欧州は2024年に47.47%と圧倒的な収益シェアを占めたが、これは同地域全体にグリーン水素製造プラントが多数存在するためです。さらに、大規模な政府投資が市場成長を促進すると予想されます。
- 北米は、クリーンエネルギー目標の実施と、燃料電池自動車の燃料として使用されるグリーン水素のような最終用途の拡大により、予測期間中に大きなCAGRで成長すると予測されます。
- アジア太平洋は、オーストラリアや日本などのアジア太平洋諸国で発表された支援政策や大規模なグリーン水素プロジェクトにより、予測期間中に最も速いCAGRで成長すると予想されます。
目次
第1章 調査手法と範囲
第2章 エグゼクティブサマリー
第3章 市場の変数、動向、範囲
- 市場力学
- 業界バリューチェーン分析
- 規制の枠組み
- 主要国における水素に関する政策と計画
- 標準とコンプライアンス
- 市場力学
- 市場 促進要因分析
- 再生可能エネルギーの普及拡大
- 市場抑制要因分析
- 市場機会
- ビジネス環境分析:グリーン水素市場
- 業界分析- ポーターのファイブフォース分析
- PESTEL分析
- コロナウイルスのグリーン水素市場への影響
- 課題
- インパクト評決- 中
- ブルー水素、グレー水素、グリーン水素の市場シェア比較分析(2021年、数量ベース)
- ブルー水素、グレー水素、グリーン水素の価格比較分析
- ブルー水素、グレー水素、グリーン水素の生産コストと構成成分
- ブルー水素の成分分布
- グレー水素成分分布
- グリーン水素成分分布
- ブルー水素のケーススタディ
- グレー水素のケーススタディ
- グリーン水素のケーススタディ
- イエロー水素の概要
第4章 グリーン水素市場:技術変動分析、2024年および2030年
- グリーン水素市場:技術変動分析、2024年および2030年
- 2018年から2030年までの市場規模と予測および動向分析
- アルカリ電解装置
- ポリマー電解質膜 (PEM) 電解装置
- SOEC 電解装置
第5章 グリーン水素市場:用途変動分析、2024年および2030年
- グリーン水素市場:用途変動分析、2024年および2030年
- 2018年から2030年までの以下の市場規模と予測および動向分析:
- 発電
- 輸送
- その他
第6章 グリーン水素市場:流通チャネル変動分析、2024年および2030年
- グリーン水素市場:流通チャネル変動分析、2024年および2030年
- 2018年から2030年までの以下の市場規模と予測および動向分析:
- パイプライン
- 貨物
第7章 グリーン水素市場:地域推定・動向分析
- グリーン水素市場:地域変動分析、2024年および2030年
- 北米
- 技術別、2018年-2030年
- 米国
- 技術別、2018年-2030年
- カナダ
- 技術別、2018年-2030年
- 欧州
- 技術タイプ別、2018年-2030年
- 用途別、2018年-2030年
- 流通チャネル別、2018年-2030年
- ドイツ
- フランス
- 英国
- 技術別、2018年-2030年
- 用途別、2018年-2030年
- 流通チャネル別、2018年-2030年
- アジア太平洋
- 技術別、2018年-2030年
- 用途別、2018年-2030年
- 流通チャネル別、2018年-2030年
- オーストラリア
- 中国
- インド
- 日本
- 中南米
- 技術別、2018年-2030年
- 用途別、2018年-2030年
- 流通チャネル別、2018年-2030年
- ブラジル
- 中東およびアフリカ
- 技術別、2018年-2030年
- 用途別、2018年-2030年
- 流通チャネル別、2018年-2030年
第8章 グリーン水素市場: 水素ステーション
- 市場概要
- セグメンテーションの概要
- 最近の開発と戦略
第9章 グリーン水素市場-競合情勢
- 世界の主要プレーヤー、最近の市場動向、業界への影響
- ベンダー情勢
- 公開会社
- 競合ダッシュボード分析
- 民間企業
- 主要な新興企業/技術革新企業/イノベーターのリスト
- 世界市場シェア分析(2024年)
第10章 企業プロファイル
- Linde plc
- Air Products Inc.
- Air Liquide
- Cummins Inc.
- Engie
- Nel ASA
- Siemens Energy
- Toshiba Energy Systems &Solutions Corporation
- Uniper SE
- Bloom Energy
List of Tables
- Table 1 Policies and Plans, By Country
- Table 2 Cost Estimate for hydrogen generation different technologies
- Table 3 Global green hydrogen market estimates and forecasts, by alkaline electrolyzer technology, 2018 - 2030 (Kilotons) (USD Million)
- Table 4 Global green hydrogen market estimates and forecasts, by PEM electrolyzer technology, 2018 - 2030 (Kilotons) (USD Million)
- Table 5 Global green hydrogen market estimates and forecasts, by SOEC technology, 2018 - 2030 (Kilotons) (USD Million)
- Table 6 Global green hydrogen market estimates and forecasts, by power generation, 2018 - 2030 (Kilotons) (USD Million)
- Table 7 Global green hydrogen market estimates and forecasts, by transport, 2018 - 2030 (Kilotons) (USD Million)
- Table 8 Global green hydrogen market estimates and forecasts, by others, 2018 - 2030 (Kilotons) (USD Million)
- Table 9 Global green hydrogen market estimates and forecasts, by power generation, 2018 - 2030 (Kilotons) (USD Million)
- Table 10 Global green hydrogen market estimates and forecasts, by cargo, 2018 - 2030 (Kilotons) (USD Million)
- Table 11 North America green hydrogen market volume, by technology, 2018 - 2030 (Kilotons)
- Table 12 North America green hydrogen market revenue, by technology, 2018 - 2030 (USD Million)
- Table 13 North America green hydrogen market volume, by application, 2018 - 2030 (Kilotons)
- Table 14 North America green hydrogen market revenue, by application, 2018 - 2030 (USD Million)
- Table 15 North America green hydrogen market volume, by distribution channel, 2018 - 2030 (Kilotons)
- Table 16 North America green hydrogen market revenue, by distribution channel, 2018 - 2030 (USD Million)
- Table 17 U.S. green hydrogen market volume, by technology, 2018 - 2030 (Kilotons)
- Table 18 U.S. green hydrogen market revenue, by technology, 2018 - 2030 (USD Million)
- Table 19 U.S. green hydrogen market volume, by application, 2018 - 2030 (Kilotons)
- Table 20 U.S. green hydrogen market revenue, by application, 2018 - 2030 (USD Million)
- Table 21 U.S. green hydrogen market volume, by distribution channel, 2018 - 2030 (Kilotons)
- Table 22 U.S. green hydrogen market revenue, by distribution channel, 2018 - 2030 (USD Million)
- Table 23 Canada green hydrogen market volume, by technology, 2018 - 2030 (Kilotons)
- Table 24 Canada green hydrogen market revenue, by technology, 2018 - 2030 (USD Million)
- Table 25 Canada green hydrogen market volume, by application, 2018 - 2030 (Kilotons)
- Table 26 Canada green hydrogen market revenue, by application, 2018 - 2030 (USD Million)
- Table 27 Canada green hydrogen market volume, by distribution channel, 2018 - 2030 ((Kilotons)
- Table 28 Canada green hydrogen market revenue, by application channel, 2018 - 2030 (USD Million)
- Table 29 Europe green hydrogen market volume, by technology type, 2018 - 2030 (Kilotons)
- Table 30 Europe green hydrogen market revenue, by technology type, 2018 - 2030 (USD Million)
- Table 31 Europe green hydrogen market volume, by application, 2018 - 2030 (Kilotons)
- Table 32 Europe green hydrogen market revenue, by application, 2018 - 2030 (USD Million)
- Table 33 Europe green hydrogen market volume, by distribution channel, 2018 - 2030 (Kilotons)
- Table 34 Europe green hydrogen market volume, by distribution channel, 2018 - 2030 (USD Million)
- Table 35 Germany green hydrogen market volume, by technology type, 2018 - 2030 (Kilotons)
- Table 36 Germany green hydrogen market revenue, by technology type, 2018 - 2030 (USD Million)
- Table 37 Germany green hydrogen market volume, by application, 2018 - 2030 (Kilotons)
- Table 38 Germany green hydrogen market revenue, by application, 2018 - 2030 (USD Million)
- Table 39 Germany green hydrogen market volume, by distribution channel, 2018 - 2030 (Kilotons)
- Table 40 Germany green hydrogen market revenue, by distribution channel, 2018 - 2030 (USD Million)
- Table 41 France green hydrogen market volume, by technology type, 2018 - 2030 (Kilotons)
- Table 42 France green hydrogen market revenue, by technology type, 2018 - 2030 (USD Million)
- Table 43 France green hydrogen market volume, by application, 2018 - 2030 (Kilotons)
- Table 44 France green hydrogen market revenue, by application, 2018 - 2030 (USD Million)
- Table 45 France green hydrogen market volume, by distribution channel, 2018 - 2030 (Kilotons)
- Table 46 France green hydrogen market revenue, by distribution channel, 2018 - 2030 (USD Million)
- Table 47 UK green hydrogen market volume, by technology type, 2018 - 2030 (Kilotons)
- Table 48 UK green hydrogen market revenue, by technology type, 2018 - 2030 (USD Million)
- Table 49 UK green hydrogen market volume, by application, 2018 - 2030 (Kilotons)
- Table 50 UK green hydrogen market revenue, by application, 2018 - 2030 (USD Million)
- Table 51 UK green hydrogen market volume, by distribution channel, 2018 - 2030 (Kilotons)
- Table 52 UK green hydrogen market revenue, by distribution channel, 2018 - 2030 (USD Million)
- Table 53 Asia Pacific green hydrogen market volume, by technology type, 2018 - 2030 (Kilotons)
- Table 54 Asia Pacific green hydrogen market volume, by technology type, 2018 - 2030 (USD Million)
- Table 55 Asia Pacific green hydrogen market volume, by application, 2018 - 2030 (Kilotons)
- Table 56 Asia Pacific green hydrogen market revenue, by application, 2018 - 2030 (USD Million)
- Table 57 Asia Pacific green hydrogen market volume, by distribution channel, 2018 - 2030 (Kilotons)
- Table 58 Asia Pacific green hydrogen market revenue, by distribution channel, 2018 - 2030 (USD Million)
- Table 59 Australia green hydrogen market volume, by technology type, 2018 - 2030 (Kilotons)
- Table 60 Australia green hydrogen market revenue, by technology type, 2018 - 2030 (USD Million)
- Table 61 Australia green hydrogen market volume, by application, 2018 - 2030 (Kilotons)
- Table 62 Australia green hydrogen market revenue, by application, 2018 - 2030 (USD Million)
- Table 63 Australia green hydrogen market volume, by distribution channel, 2018 - 2030 (Kilotons)
- Table 64 Australia green hydrogen market revenue, by distribution channel, 2018 - 2030 (USD Million)
- Table 65 China green hydrogen market volume, by technology type, 2018 - 2030 (Kilotons)
- Table 66 China green hydrogen market revenue, by technology type, 2018 - 2030 (USD Million)
- Table 67 China green hydrogen market volume, by application, 2018 - 2030 (Kilotons)
- Table 68 China green hydrogen market revenue, by application, 2018 - 2030 (USD Million)
- Table 69 China green hydrogen market volume, by distribution channel, 2018 - 2030 (Kilotons)
- Table 70 China green hydrogen market revenue, by distribution channel, 2018 - 2030 (USD Million)
- Table 71 India green hydrogen market volume, by technology type, 2018 - 2030 (Kilotons)
- Table 72 India green hydrogen market revenue, by technology type, 2018 - 2030 (USD Million)
- Table 73 India green hydrogen market volume, by application, 2018 - 2030 (Kilotons)
- Table 74 India green hydrogen market revenue, by application, 2018 - 2030 (USD Million)
- Table 75 India green hydrogen market volume, by distribution channel, 2018 - 2030 (Kilotons)
- Table 76 India green hydrogen market revenue, by distribution channel, 2018 - 2030 (USD Million)
- Table 77 Japan green hydrogen market volume, by technology type, 2018 - 2030 (Kilotons)
- Table 78 Japan green hydrogen market volume, by technology type, 2018 - 2030 (USD Million)
- Table 79 Japan green hydrogen market volume, by application, 2018 - 2030 (Kilotons)
- Table 80 Japan green hydrogen market revenue, by application, 2018 - 2030 (USD Million)
- Table 81 Japan green hydrogen market volume, by distribution channel, 2018 - 2030 (Kilotons)
- Table 82 Japan green hydrogen market revenue, by distribution channel, 2018 - 2030 (USD Million)
- Table 83 Central and South America green hydrogen market volume, by technology type, 2018 - 2030 (Kilotons)
- Table 84 Central and South America green hydrogen market volume, by technology type, 2018 - 2030 (USD Million)
- Table 85 Central and South America green hydrogen market volume, by application, 2018 - 2030 (Kilotons)
- Table 86 Central and South America green hydrogen market revenue, by application, 2018 - 2030 (USD Million)
- Table 87 Central and South America green hydrogen market volume, by distribution channel, 2018 - 2030 (Kilotons)
- Table 88 Central and South America green hydrogen market volume, by distribution channel, 2018 - 2030 (USD Million)
- Table 89 Brazil green hydrogen market volume, by technology type, 2018 - 2030 (Kilotons)
- Table 90 Brazil green hydrogen market revenue, by technology type, 2018 - 2030 (USD Million)
- Table 91 Brazil green hydrogen market volume, by application, 2018 - 2030 (Kilotons)
- Table 92 Brazil green hydrogen market revenue, by application, 2018 - 2030 (USD Million)
- Table 93 Brazil green hydrogen market volume, by distribution channel, 2018 - 2030 (Kilotons)
- Table 94 Brazil green hydrogen market revenue, by distribution channel, 2018 - 2030 (USD Million)
- Table 95 Middle East and Africa green hydrogen market volume, by technology type, 2018 - 2030(Kilotons)
- Table 96 Middle East and Africa green hydrogen market volume, by technology type, 2018 - 2030(USD Million)
- Table 97 Middle East and Africa green hydrogen market volume, by application, 2018 - 2030 (Kilotons)
- Table 98 Middle East and Africa green hydrogen market revenue, by application, 2018 - 2030 (USD Million)
- Table 99 Middle East and Africa green hydrogen market volume, by distribution channel, 2018 - 2030 (Kilotons)
- Table 100 Middle East and Africa green hydrogen market volume, by distribution channel, 2018 - 2030 (USD Million)
- Table 101 Vendor Landscape
List of Figures
- Fig. 1 Green hydrogen market segmentation
- Fig. 2 Information procurement
- Fig. 3 Primary research pattern
- Fig. 4 Primary research process
- Fig. 5 Primary research approaches
- Fig. 6 Green Hydrogen Market - Market Outlook, 2024 (USD Million)
- Fig. 7 Green Hydrogen Market - Penetration & growth prospect mapping
- Fig. 8 Green hydrogen market - Industry value chain analysis
- Fig. 9 Marker driver impact analysis
- Fig. 10 Electricity capacity of total wind and solar installed capacity (MW)
- Fig. 11 Market restraints impact analysis
- Fig. 12 Green Hydrogen Market analysis - Porter's
- Fig. 13 Green Hydrogen Market analysis - PESTEL analysis
- Fig. 14 Hydrogen Market by Type, 2021 (Million Tons)
- Fig. 15 Hydrogen Price Range (USD/Kg)
- Fig. 16 Blue Hydrogen Component distribution
- Fig. 17 Grey Hydrogen Component distribution
- Fig. 18 Green Hydrogen Component distribution
- Fig. 19 Green hydrogen market - Technology movement analysis, 2024 & 2030 (USD Million)
- Fig. 20 Green Hydrogen Market - Application movement analysis, 2024 & 2030 (USD Million)
- Fig. 21 Green hydrogen market - Distribution Channel movement analysis, 2024 & 2030 (USD Million)
- Fig. 22 Green hydrogen market - Regional movement analysis, 2024 & 2030 (USD Million)
- Fig. 23 Hydrogen Refueling Stations Worldwide
- Fig. 24 Refueling Station Component Cost Contribution
- Fig. 25 Global Green Hydrogen Market Share
Green Hydrogen Market Growth & Trends:
The global green hydrogen market size is expected to reach USD 60.56 billion by 2030, registering a CAGR of 38.5% from 2025 to 2030, according to a new report by Grand View Research, Inc. Growing government investments and subsidies benefitting clean fuel usage along with hydrogen economy being touted as an environment-friendly alternative to fossil fuel economy are likely to strengthen the demand over the forecast period.
The market is driven by the proliferating deployment of renewable energy sources in various end-use industries. Green hydrogen is produced through the electrolysis of water, with renewable power generation sources such as wind energy, solar energy, and other renewable energy sources. Furthermore, the growing scale of renewable energy is estimated to result in lowering the cost of clean power generation, thereby positively influencing the market growth over the forecast years.
The alkaline electrolyzer segment accounted for 66.18% of the market in 2021 owing to being the conventional electrolyzer technology used in green hydrogen projects. The alkaline electrolyzer uses the liquid alkaline solution of potassium or sodium hydroxide as its electrolyte and it has higher operating hours than PEM electrolyzers. However, PEM electrolyzers are expected to witness a higher growth rate than alkaline electrolyzers in the forecast period.
The transportation segment was the largest in the application segmentation with it accounting for about 40.61% of the global green hydrogen market in 2021. The transportation industry shifting away from fossil fuels and towards renewable energy such as solar energy and green hydrogen is expected to boost the segment in the forecast period. The power generation segment is also expected to grow at a steady pace owing to reducing costs of green hydrogen production.
The pipeline segment in the distribution channel accounted for 63.11% of the market in 2021. A pipeline is the most economically viable method to transport large volumes over long distances. Cargo segmentation is expected to grow at a CAGR of 40.9% in the forecast period owing to increased demand for green hydrogen.
The market in North America is anticipated to attain a prominent growth rate over the forecast period, with U.S. and Canada leading the region owing to the implementation of clean energy policies. In the U.S., California holds the majority of the market share with the growth driven by aggressive de-carbonization targets, such as phasing out of gas or diesel-powered public buses by 2040.
Major players in the industry are focusing on innovation and technological advancements to reduce the high cost of electrolyzer units, boosting the commercialization of green hydrogen production. In addition, market participants are emphasizing practicing several strategic initiatives such as joint ventures, partnerships, mergers & acquisitions, and others to enhance their foothold in the market over the coming years.
Countries realizing their untapped potential in hydrogen markets are expected to enhance the industry landscape over the coming years. In October 2019, Siemens announced a technical partnership on a 5 GW wind and solar combined energy project in Australia. The company is expected to provide its electrolyzer technology to generate green hydrogen through renewable-powered electrolysis. The clean hydrogen produced is intended to be exported to Asian markets.
Green Hydrogen Market Report Highlights:
- Alkaline electrolyzer held the largest revenue share of 65.46% in 2024, owing to its low capital cost and higher operating period capability when compared to the PEM electrolyzer technology.
- Polymer Electrolyte Membrane (PEM) electrolyzer segment is expected to witness the fastest growth rate over the forecast period owing to its lower membrane thickness, high proton conductivity, and lower gas permeability.
- Transport segment led with the largest revenue share of 43.39% in 2024. The increasing adoption of renewable energy sources in the transportation industry is expected to boost the growth during the forecast period.
- Pipeline distribution channel segment accounted for 60.66% of the revenue share in 2024. The lower cost of pipeline distribution coupled with existing pipeline infrastructure is expected to boost the market during the forecast period.
- Europe accounted for a dominant revenue share of 47.47% in 2024, owing to the presence of a high number of green hydrogen production plants across the region. In addition, massive government investments are expected to drive the market growth.
- North America is estimated to grow at a significant CAGR over the forecast period owing to the implementation of clean energy targets along with growing end-market applications such as green hydrogen being used as a fuel in fuel-cell driven vehicles.
- Asia Pacific is expected to grow at the fastest CAGR over the forecast period owing to supporting policies and large-scale green hydrogen projects announced in APAC countries such as Australia and Japan.
Table of Contents
Chapter 1 Methodology & Scope
- 1.1 Market Segmentation & Scope
- 1.2 Assumptions
- 1.3 Information Procurement
- 1.3.1 Purchased Database
- 1.3.2 GVR's Internal Database
- 1.3.3 Secondary Sources
- 1.3.4 Third-Party Perspective
- 1.3.5 Primary Research
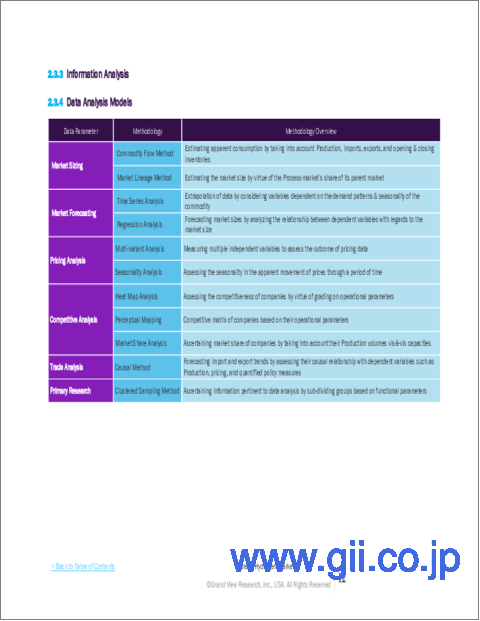
- 1.4 Information Analysis
- 1.4.1 Data Analysis Models
- 1.5 Market Formulation and Data Visualization
- 1.6 Data Validation and Publishing
Chapter 2 Executive Summary
- 2.1 Market Outlook
Chapter 3 Market Variables, Trends & Scope
- 3.1 Market Dynamics
- 3.2 Industry Value Chain Analysis
- 3.3 Regulatory Framework
- 3.3.1 Policies & Plans for Hydrogen by Major Countries
- 3.3.2 Standards and Compliances
- 3.4 Market Dynamics
- 3.4.1 Market Driver Analysis
- 3.4.2 Growing Penetration Of Renewable Energy
- 3.4.3 Market Restraint Analysis
- 3.4.4 Market Opportunities
- 3.5 Business Environment Analysis: Green Hydrogen Market
- 3.5.1 Industry Analysis - Porter's
- 3.5.2 PESTEL analysis
- 3.6 Impact of Corona Virus on Green Hydrogen Market
- 3.6.1 Challenges
- 3.6.2 Impact Verdict - Medium
- 3.7 Comparative market share analysis of blue hydrogen, grey hydrogen, and green hydrogen, (2021, Volume Basis)
- 3.8 Comparative price point analysis of blue hydrogen, grey hydrogen, and green hydrogen (2021, USD/kg)
- 3.9 Production Cost and components of blue hydrogen, grey hydrogen, and green hydrogen
- 3.9.1 Blue hydrogen Component Distribution
- 3.9.2 Grey Hydrogen Component Distribution
- 3.9.3 Green Hydrogen Component Distribution
- 3.9.4 Blue Hydrogen Case Study
- 3.9.5 Grey Hydrogen Case study
- 3.9.6 Green Hydrogen Case study
- 3.10 Overview on the Yellow Hydrogen
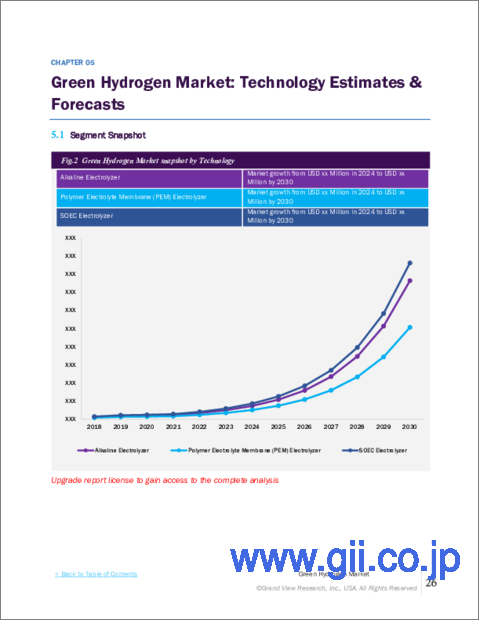
Chapter 4 Green Hydrogen Market: Technology Movement Analysis, 2024 & 2030
- 4.1 Green Hydrogen Market: Technology Movement Analysis, 2024 & 2030
- 4.2 Market size & forecasts and trend analysis, 2018 to 2030 for the following
- 4.2.1 Alkaline Electrolyzer
- 4.2.1.1 Global green hydrogen market estimates and forecasts, by alkaline electrolyzer technology, 2018 - 2030 (Kilotons) (USD Million)
- 4.2.2 Polymer Electrolyte Membrane (PEM) Electrolyzer
- 4.2.2.1 Global green hydrogen market estimates and forecasts, by PEM electrolyzer technology, 2018 - 2030 (Kilotons) (USD Million)
- 4.2.3 SOEC Electrolyzer
- 4.2.2.1 Global green hydrogen market estimates and forecasts, by SOEC Electrolyzer technology, 2018 - 2030 (Kilotons) (USD Million)
- 4.2.1 Alkaline Electrolyzer
Chapter 5 Green Hydrogen Market: Application Movement Analysis, 2024 & 2030
- 5.1 Green Hydrogen Market: Application Movement Analysis, 2024 & 2030
- 5.2 Market size & forecasts and trend analysis, 2018 to 2030 for the following:
- 5.2.1 Power Generation
- 5.2.1.1 Global green hydrogen market estimates and forecasts, by Power Genration, 2018 - 2030 (Kilotons) (USD Million)
- 5.2.2 Transport
- 5.2.2.1 Global green hydrogen market estimates and forecasts, by Transport, 2018 - 2030 (Kilotons) (USD Million)
- 5.2.3 Others
- 5.2.3.1 Global green hydrogen market estimates and forecasts, by Others, 2018 - 2030 (Kilotons) (USD Million)
- 5.2.1 Power Generation
Chapter 6 Green Hydrogen Market: Distribution Channel Movement Analysis, 2024 & 2030
- 6.1 Green Hydrogen Market: Distribution Channel Movement Analysis, 2024 & 2030
- 6.2 Market size & forecasts and trend analysis, 2018 to 2030 for the following:
- 6.2.1 Pipeline
- 6.2.1.1 Global green hydrogen market estimates and forecasts, by Pipeline, 2018 - 2030 (Kilotons) (USD Million)
- 6.2.2 Cargo
- 6.2.2.1 Global green hydrogen market estimates and forecasts, by Cargo, 2018 - 2030 (Kilotons) (USD Million)
- 6.2.1 Pipeline
Chapter 7 Green Hydrogen Market: Regional Estimates & Trend Analysis
- 7.1 Green Hydrogen Market: Regional Movement Analysis, 2024 & 2030
- 7.2 North America
- 7.2.1 North America green hydrogen market estimates and forecasts, by technology, 2018 - 2030 (Kilotons) (USD Million)
- 7.3 U.S.
- 7.3.1 U.S. green hydrogen market estimates and forecasts, by technology, 2018 - 2030 (Kilotons) (USD Million)
- 7.4 Canada
- 7.4.1 Canada green hydrogen market estimates and forecasts, by technology, 2018 - 2030 (Kilotons) (USD Million)
- 7.5 Europe
- 7.5.1 Europe green hydrogen market estimates and forecasts, by technology Type, 2018 - 2030 (Kilotons) (USD Million)
- 7.5.2 Europe green hydrogen market estimates and forecasts, by Application, 2018 - 2030 (Kilotons) (USD Million)
- 7.5.3 Europe green hydrogen market estimates and forecasts, by Distribution Channel, 2018 - 2030 (Kilotons) (USD Million)
- 7.5.4 Germany
- 7.5.4.1 Germany green hydrogen market estimates and forecasts, by technology, 2018 - 2030 (Kilotons) (USD Million)
- 7.5.4.2 Germany green hydrogen market estimates and forecasts, by Application, 2018 - 2030 (Kilotons) (USD Million)
- 7.5.4.3 Germany green hydrogen market estimates and forecasts, by Distribution Channel, 2018 - 2030 (Kilotons) (USD Million)
- 7.5.5 France
- 7.5.5.1 France green hydrogen market estimates and forecasts, by technology, 2018 - 2030 (Kilotons) (USD Million)
- 7.5.5.2 France green hydrogen market estimates and forecasts, by Application, 2018 - 2030 (Kilotons) (USD Million)
- 7.5.5.3 France green hydrogen market estimates and forecasts, by Distribution Channel, 2018 - 2030 (Kilotons) (USD Million)
- 7.6 UK
- 7.6.1 UK green hydrogen market estimates and forecasts, by technology, 2018 - 2030 (Kilotons) (USD Million)
- 7.6.2 UK green hydrogen market estimates and forecasts, by APPLICATION, 2018 - 2030 (Kilotons) (USD Million)
- 7.6.3 UK green hydrogen market estimates and forecasts, by Distribution Channel, 2018 - 2030 (Kilotons) (USD Million)
- 7.7 Asia Pacific
- 7.7.1 Asia Pacific green hydrogen market estimates and forecasts, by technology, 2018 - 2030 (Kilotons) (USD Million)
- 7.7.2 Asia Pacific green hydrogen market estimates and forecasts, by Application, 2018 - 2030 (Kilotons) (USD Million)
- 7.7.3 Asia Pacific green hydrogen market estimates and forecasts, by Distribution Channel, 2018 - 2030 (Kilotons) (USD Million)
- 7.7.4 Australia
- 7.7.4.1 Australia green hydrogen market estimates and forecasts, by technology TYPE, 2018 - 2030 (Kilotons) (USD Million)
- 7.7.4.2 Australia green hydrogen market estimates and forecasts, by Application, 2018 - 2030 (Kilotons) (USD Million)
- 7.7.4.3 Australia green hydrogen market estimates and forecasts, by Distribution Channel, 2018 - 2030 (Kilotons) (USD Million)
- 7.8 China
- 7.8.1.1 China green hydrogen market estimates and forecasts, by technology, 2018 - 2030 (Kilotons) (USD Million)
- 7.8.1.2 China green hydrogen market estimates and forecasts, by Application, 2018 - 2030 (Kilotons) (USD Million)
- 7.8.1.3 China green hydrogen market estimates and forecasts, by Application, 2018 - 2030 (Kilotons) (USD Million)
- 7.9 India
- 7.9.1.1 India green hydrogen market estimates and forecasts, by technology, 2018 - 2030 (Kilotons) (USD Million)
- 7.9.1.2 India green hydrogen market estimates and forecasts, by Application, 2018 - 2030 (Kilotons) (USD Million)
- 7.9.1.3 India green hydrogen market estimates and forecasts, by Distribution Channel, 2018 - 2030 (Kilotons) (USD Million)
- 7.9.2 Japan
- 7.9.2.1 Japan green hydrogen market estimates and forecasts, by technology, 2018 - 2030 (Kilotons) (USD Million)
- 7.9.2.2 Japan green hydrogen market estimates and forecasts, by Application, 2018 - 2030 (Kilotons) (USD Million)
- 7.9.2.3 Japan green hydrogen market estimates and forecasts, by Distribution Channel, 2018 - 2030 (Kilotons) (USD Million)
- 7.10 Central and South America
- 7.10.1 Central and South America green hydrogen market estimates and forecasts, by technology, 2018 - 2030 (Kilotons) (USD Million)
- 7.10.2 Central and South America green hydrogen market estimates and forecasts, by Application, 2018 - 2030 (Kilotons) (USD Million)
- 7.10.3 Central and South America green hydrogen market estimates and forecasts, by Distribution Channel, 2018 - 2030 (Kilotons) (USD Million)
- 7.11 Brazil
- 7.11.1.1 Brazil green hydrogen market estimates and forecasts, by technology, 2018 - 2030 (Kilotons) (USD Million)
- 7.11.1.2 Brazil green hydrogen market estimates and forecasts, by Application, 2018 - 2030 (Kilotons) (USD Million)
- 7.11.1.3 Brazil green hydrogen market estimates and forecasts, by Distribution Channel, 2018 - 2030 (Kilotons) (USD Million)
- 7.12 Middle East and Africa
- 7.12.1 Middle east and Africa green hydrogen market estimates and forecasts, by technology, 2018 - 2030 (Kilotons) (USD Million)
- 7.12.2 Middle east and Africa green hydrogen market estimates and forecasts, by Application, 2018 - 2030 (Kilotons) (USD Million)
- 7.12.3 Middle east and Africa green hydrogen market estimates and forecasts, by Distribution Channel, 2018 - 2030 (Kilotons) (USD Million)
Chapter 8 Green Hydrogen Market: Hydrogen Refueling Stations
- 8.1 Market overview
- 8.2 Segmentation Overview
- 8.3 Recent development and strategies
- 8.3.1 Cost analysis for setting up of refueling infrastructure
Chapter 9 Green Hydrogen Market - Competitive Landscape
- 9.1 Key Global Players, Recent Market Developments & Their Impact on the Industry
- 9.2 Vendor landscape
- 9.3 Public Companies
- 9.3.1 Competitive Dashboard Analysis
- 9.4 Private Company
- 9.4.1 List of Key Emerging Companies/Technology Disruptors/Innovators
- 9.5 Global Market Share Analysis (2024)
Chapter 10 Company Profiles
- 10.1 Linde plc
- 10.1.1 Company Overview
- 10.1.2 Financial Performance
- 10.1.3 Product Benchmarking
- 10.2 Air Products Inc.
- 10.2.1 Company Overview
- 10.2.2 Financial Performance
- 10.2.3 Product Benchmarking
- 10.2.4 Strategic Initiatives
- 10.3 Air Liquide
- 10.3.1 Company Overview
- 10.3.2 Financial Performance
- 10.3.3 Product Benchmarking
- 10.3.4 Strategic Initiatives
- 10.4 Cummins Inc.
- 10.4.1 Company Overview
- 10.4.2 Financial Performance
- 10.4.3 Product Benchmarking
- 10.4.4 Strategic Initiatives
- 10.5 Engie
- 10.5.1 Company Overview
- 10.5.2 Financial Performance
- 10.5.3 Product Benchmarking
- 10.5.4 Strategic Initiatives
- 10.6 Nel ASA
- 10.6.1 Company Overview
- 10.6.2 Financial Performance
- 10.6.3 Product Benchmarking
- 10.6.4 Strategic Initiatives
- 10.7 Siemens Energy
- 10.7.1 Company Profiles
- 10.7.2 Financial Performance
- 10.7.3 Product Benchmarking
- 10.7.4 Strategic Initiatives
- 10.8 Toshiba Energy Systems & Solutions Corporation
- 10.8.1 Company Overview
- 10.8.2 Product Benchmarking
- 10.8.3 Strategic Initiatives
- 10.9 Uniper SE
- 10.9.1 Company Overview
- 10.9.2 Financial Performance
- 10.9.3 Product Benchmarking
- 10.9.4 Strategic Initiatives
- 10.10 Bloom Energy
- 10.10.1 Company Overview
- 10.10.2 Financial Performance
- 10.10.3 Product Benchmarking
- 10.10.4 Strategic Initiatives

