|
|
市場調査レポート
商品コード
1530136
植物油の市場規模、シェア、動向分析レポート:タイプ別、用途別、流通チャネル別、地域別、セグメント予測、2024年~2030年Vegetable Oil Market Size, Share & Trends Analysis Report By Type (Palm Oil, Soybean Oil), By Application, By Distribution Channel, By Region, And Segment Forecasts, 2024 - 2030 |
||||||
|
|||||||
カスタマイズ可能
|
|||||||

| 植物油の市場規模、シェア、動向分析レポート:タイプ別、用途別、流通チャネル別、地域別、セグメント予測、2024年~2030年 |
|
出版日: 2024年07月10日
発行: Grand View Research
ページ情報: 英文 100 Pages
納期: 2~10営業日
|

全表示
- 概要
- 図表
- 目次
植物油市場の成長と動向:
Grand View Research, Inc.の最新レポートによると、世界の植物油市場規模は2024年から2030年にかけてCAGR 4.6%で成長し、2030年には4,361億2,000万米ドルに達すると予測されています。
調理材料として、また食品生産用として植物油の需要が増加していることが大きな要因です。植物油は世界的に様々な料理に広く使用されており、人口が増加し続けるにつれて、植物油を主原料とする食品の需要も増加しています。こうした要因が市場を牽引しています。
さらに、非食品分野、特にバイオ燃料産業における植物油の用途拡大が市場成長に寄与しています。再生可能エネルギー源の重視が高まる中、大豆油、トウモロコシ油、パーム油などの植物油がバイオ燃料の生産に利用され、これらの油の需要拡大に拍車をかけています。
さらに、より健康的な食用油に対する意識の高まりと嗜好が、植物油市場に影響を与えています。消費者の健康志向が高まるにつれ、オリーブ油、ひまわり油、キャノーラ油など、より健康的な代替品と認識される油へのシフトが進んでいます。この動向は、植物油の栄養プロファイルの改善を目指した研究開発の増加につながり、市場の成長をさらに後押ししています。
さらに、非食品分野、特にバイオ燃料産業における植物油の用途拡大が市場成長に寄与しています。再生可能エネルギー源を重視する傾向が強まる中、大豆、トウモロコシ、パーム油などの植物油がバイオ燃料の生産に利用され、これらの油の需要拡大に拍車をかけています。
さらに、化粧品、パーソナルケア製品、製薬業界における植物油の多用途性と多様な用途も、市場拡大に拍車をかけています。このように、これらの分野での天然成分や有機成分に対する需要の高まりが、様々な製剤における植物油の使用を促進し、市場の成長を増大させています。
植物油市場レポートハイライト
- パーム油は2023年に世界市場の34.27%のシェアを占めました。他の植物油と比較したパーム油の費用対効果は、市場におけるパーム油セグメントの牽引役として重要な役割を果たしています。1ヘクタール当たりの収量が高く効率的な作物であるパーム油生産は、有利な規模の経済を提供し、様々な産業用途にとって魅力的な選択肢となっています。このコスト競争上の優位性は、植物油市場におけるパーム油の地位を強化し、同分野の継続的成長と市場支配に寄与しています。
- 工業用植物油の用途は、2024年から2030年までCAGR 4.9%で成長すると予想されます。産業環境における植物油の多用途性と機能性が、その採用拡大に寄与しています。植物油は、潤滑油、油圧作動油、離型剤、バイオベースの溶剤として使用でき、従来の合成化学薬品に代わる効果的な代替品を提供します。その潤滑特性、高粘度指数、熱安定性により、幅広い産業用途に適しており、様々な製造工程での使用を促進しています。
- B2C流通チャネルを通じた販売は、2024年から2030年にかけてCAGR 5.4%で成長すると予想されます。消費者の行動や嗜好の進化、特にパーソナライズされたショッピング体験やより迅速な配送オプションに対する需要の高まりが、B2C販売の成長を後押ししています。消費者は今日、利便性、アクセスのしやすさ、シームレスなショッピング体験を求め、B2Cチャネルはそれを提供するのに適した立場にあります。パーソナライズされた推奨、簡単な支払いオプション、効率的な配送サービスを提供することで、B2C流通チャネルは消費者の変化するニーズと期待に応えることができ、その過程でより高い売上成長を促進することができます。
- 北米の野菜市場は、2024年から2030年にかけてCAGR 3.1%で成長すると予想されています。健康とウェルネスが重視されるようになり、消費者は動物性脂肪やトランス脂肪酸に代わる健康的なものとして認識される植物油にシフトしています。オリーブ油、キャノーラ油、アボカド油などは、心臓の健康に良いとされる一価不飽和脂肪酸や多価不飽和脂肪酸を多く含むため、特に人気があります。さらに、植物性食品や菜食主義者の動向は、植物油の需要をさらに押し上げています。こうした食生活では、調理や食品調理の主原料として植物油を必要とすることが多いからです。
目次
第1章 調査手法と範囲
第2章 エグゼクティブサマリー
第3章 植物油市場の変数、動向、範囲
- 市場系統の見通し
- 業界バリューチェーン分析
- 生のアプリケーション展望
- 製造業と技術の展望
- 市場力学
- 市場 促進要因分析
- 市場抑制要因分析
- 市場機会
- 市場の課題
- 業界分析
- ポーターのファイブフォース分析
- PESTEL分析
- 市場参入戦略
第4章 植物油市場:タイプ別推定・動向分析
- 変動分析と市場シェア、2023年と2030年
- パーム油
- 大豆油
- 菜種油
- ひまわり油
- その他
第5章 植物油市場:用途別推定・動向分析
- 変動分析と市場シェア、2023年と2030年
- 食品
- 餌
- 産業
第6章 植物油市場: 流通チャネル別推定・動向分析
- 変動分析と市場シェア、2023年と2030年
- 企業向け
- B2C
第7章 植物油市場:地域別推定・動向分析
- 地域別変動分析と市場シェア、2023年と2030年
- 北米
- 市場推計・予測、2018年-2030年
- 米国
- カナダ
- 欧州
- 市場推計・予測、2018年-2030年
- ドイツ
- 英国
- スペイン
- イタリア
- フランス
- アジア太平洋
- 市場推計・予測、2018年-2030年
- 中国
- インド
- 日本
- 韓国
- オーストラリア
- 中南米
- 市場推計・予測、2018年-2030年
- ブラジル
- 中東・アフリカ
- 市場推計・予測、2018年-2030年
- 南アフリカ
- サウジアラビア
第8章 競合分析
- 主要市場参入企業による最近の動向と影響分析
- 企業分類
- 参入企業の概要
- 財務実績
- フォームベンチマーク
- 企業市場シェア分析、2023年(%)
- 企業ヒートマップ分析
- 戦略マッピング
- 企業プロファイル
- Archer Daniels Midland Company
- Sime Darby Plantation Berhad
- Bunge Limited
- Olam International Limited
- Cargill Incorporated
- Golden Agri-Resources
- Kuala Lumpur Kepong Berhad
- Fuji Oil Holding Inc.
- Wilmar International Limited
- PT Astra Agro Lestari Tbk
List of Tables
- 1. Vegetable oil market - Key market driver analysis
- 2. Vegetable oil market - Key market restraint analysis
- 3. Vegetable oil market estimates and forecast, by palm oil, 2018 - 2030 (USD Billion)
- 4. Vegetable oil market estimates and forecast, by soybean oil, 2018 - 2030 (USD Billion)
- 5. Vegetable oil market estimates and forecast, by rapeseed oil, 2018 - 2030 (USD Billion)
- 6. Vegetable oil market estimates and forecast, by sunflower oil, 2018 - 2030 (USD Billion)
- 7. Vegetable oil market estimates and forecast, by others, 2018 - 2030 (USD Billion)
- 8. Vegetable oil market estimates and forecast, by food, 2018 - 2030 (USD Billion)
- 9. Vegetable oil market estimates and forecast, by feed, 2018 - 2030 (USD Billion)
- 10. Vegetable oil market estimates and forecast, by industrial, 2018 - 2030 (USD Billion)
- 11. Vegetable oil market estimates and forecast through B2B, 2018 - 2030 (USD Billion)
- 12. Vegetable oil market estimates and forecast through B2C, 2018 - 2030 (USD Billion)
- 13. North America vegetable oil market estimates and forecast, 2018 - 2030 (USD Billion)
- 14. North America vegetable oil market revenue estimates and forecast by type, 2018 - 2030 (USD Billion)
- 15. North America vegetable oil market revenue estimates and forecast by application, 2018 - 2030 (USD Billion)
- 16. North America vegetable oil market revenue estimates and forecast by distribution channel, 2018 - 2030 (USD Billion)
- 17. U.S. macro-economic outlay
- 18. U.S. vegetable oil market estimates and forecast, 2018 - 2030 (USD Billion)
- 19. U.S. vegetable oil market revenue estimates and forecast by type, 2018 - 2030 (USD Billion)
- 20. U.S. vegetable oil market revenue estimates and forecast by application, 2018 - 2030 (USD Billion)
- 21. U.S. vegetable oil market revenue estimates and forecast by distribution channel, 2018 - 2030 (USD Billion)
- 22. Canada macro-economic outlay
- 23. Canada vegetable oil market estimates and forecast, 2018 - 2030 (USD Billion)
- 24. Canada vegetable oil market revenue estimates and forecast by type, 2018 - 2030 (USD Billion)
- 25. Canada vegetable oil market revenue estimates and forecast by application, 2018 - 2030 (USD Billion)
- 26. Canada vegetable oil market revenue estimates and forecast by distribution channel, 2018 - 2030 (USD Billion)
- 27. Europe vegetable oil market estimates and forecast, 2018 - 2030 (USD Billion)
- 28. Europe vegetable oil market revenue estimates and forecast by type, 2018 - 2030 (USD Billion)
- 29. Europe vegetable oil market revenue estimates and forecast by application, 2018 - 2030 (USD Billion)
- 30. Europe vegetable oil market revenue estimates and forecast by distribution channel, 2018 - 2030 (USD Billion)
- 31. Germany macro-economic outlay
- 32. Germany vegetable oil market estimates and forecast, 2018 - 2030 (USD Billion)
- 33. Germany vegetable oil market revenue estimates and forecast by type, 2018 - 2030 (USD Billion)
- 34. Germany vegetable oil market revenue estimates and forecast by application, 2018 - 2030 (USD Billion)
- 35. Germany vegetable oil market revenue estimates and forecast by distribution channel, 2018 - 2030 (USD Billion)
- 36. UK macro-economic outlay
- 37. UK vegetable oil market estimates and forecast, 2018 - 2030 (USD Billion)
- 38. UK vegetable oil market revenue estimates and forecast by type, 2018 - 2030 (USD Billion)
- 39. UK vegetable oil market revenue estimates and forecast by application, 2018 - 2030 (USD Billion)
- 40. UK vegetable oil market revenue estimates and forecast by distribution channel, 2018 - 2030 (USD Billion)
- 41. Spain macro-economic outlay
- 42. Spain vegetable oil market estimates and forecast, 2018 - 2030 (USD Billion)
- 43. Spain vegetable oil market revenue estimates and forecast by type, 2018 - 2030 (USD Billion)
- 44. Spain vegetable oil market revenue estimates and forecast by application, 2018 - 2030 (USD Billion)
- 45. Spain vegetable oil market revenue estimates and forecast by distribution channel, 2018 - 2030 (USD Billion)
- 46. Italy macro-economic outlay
- 47. Italy vegetable oil market estimates and forecast, 2018 - 2030 (USD Billion)
- 48. Italy vegetable oil market revenue estimates and forecast by type, 2018 - 2030 (USD Billion)
- 49. Italy vegetable oil market revenue estimates and forecast by application, 2018 - 2030 (USD Billion)
- 50. Italy vegetable oil market revenue estimates and forecast by distribution channel, 2018 - 2030 (USD Billion)
- 51. France macro-economic outlay
- 52. France vegetable oil market estimates and forecast, 2018 - 2030 (USD Billion)
- 53. France vegetable oil market revenue estimates and forecast by type, 2018 - 2030 (USD Billion)
- 54. France vegetable oil market revenue estimates and forecast by application, 2018 - 2030 (USD Billion)
- 55. France vegetable oil market revenue estimates and forecast by distribution channel, 2018 - 2030 (USD Billion)
- 56. Asia Pacific vegetable oil market estimates and forecast, 2018 - 2030 (USD Billion)
- 57. Asia Pacific vegetable oil market revenue estimates and forecast by type, 2018 - 2030 (USD Billion)
- 58. Asia Pacific vegetable oil market revenue estimates and forecast by application, 2018 - 2030 (USD Billion)
- 59. Asia Pacific vegetable oil market revenue estimates and forecast by distribution channel, 2018 - 2030 (USD Billion)
- 60. China macro-economic outlay
- 61. China vegetable oil market estimates and forecast, 2018 - 2030 (USD Billion)
- 62. China vegetable oil market revenue estimates and forecast by type, 2018 - 2030 (USD Billion)
- 63. China vegetable oil market revenue estimates and forecast by application, 2018 - 2030 (USD Billion)
- 64. China vegetable oil market revenue estimates and forecast by distribution channel, 2018 - 2030 (USD Billion)
- 65. India macro-economic outlay
- 66. India vegetable oil market estimates and forecast, 2018 - 2030 (USD Billion)
- 67. India vegetable oil market revenue estimates and forecast by type, 2018 - 2030 (USD Billion)
- 68. India vegetable oil market revenue estimates and forecast by application, 2018 - 2030 (USD Billion)
- 69. India vegetable oil market revenue estimates and forecast by distribution channel, 2018 - 2030 (USD Billion)
- 70. Japan macro-economic outlay
- 71. Japan vegetable oil market estimates and forecast, 2018 - 2030 (USD Billion)
- 72. Japan vegetable oil market revenue estimates and forecast by type, 2018 - 2030 (USD Billion)
- 73. Japan vegetable oil market revenue estimates and forecast by application, 2018 - 2030 (USD Billion)
- 74. Japan vegetable oil market revenue estimates and forecast by distribution channel, 2018 - 2030 (USD Billion)
- 75. Australia macro-economic outlay
- 76. Australia vegetable oil market estimates and forecast, 2018 - 2030 (USD Billion)
- 77. Australia vegetable oil market revenue estimates and forecast by type, 2018 - 2030 (USD Billion)
- 78. Australia vegetable oil market revenue estimates and forecast by application, 2018 - 2030 (USD Billion)
- 79. Australia vegetable oil market revenue estimates and forecast by distribution channel, 2018 - 2030 (USD Billion)
- 80. Central & South America vegetable oil market estimates and forecast, 2018 - 2030 (USD Billion)
- 81. Central & South America vegetable oil market revenue estimates and forecast by type, 2018 - 2030 (USD Billion)
- 82. Central & South America vegetable oil market revenue estimates and forecast by application, 2018 - 2030 (USD Billion)
- 83. Central & South America vegetable oil market revenue estimates and forecast by distribution channel, 2018 - 2030 (USD Billion)
- 84. Brazil macro-economic outlay
- 85. Brazil vegetable oil market estimates and forecast, 2018 - 2030 (USD Billion)
- 86. Brazil vegetable oil market revenue estimates and forecast by type, 2018 - 2030 (USD Billion)
- 87. Brazil vegetable oil market revenue estimates and forecast by application, 2018 - 2030 (USD Billion)
- 88. Brazil vegetable oil market revenue estimates and forecast by distribution channel, 2018 - 2030 (USD Billion)
- 89. Middle East & Africa vegetable oil market estimates and forecast, 2018 - 2030 (USD Billion)
- 90. Middle East & Africa vegetable oil market revenue estimates and forecast by type, 2018 - 2030 (USD Billion)
- 91. Middle East & Africa vegetable oil market revenue estimates and forecast by application, 2018 - 2030 (USD Billion)
- 92. Middle East & Africa vegetable oil market revenue estimates and forecast by distribution channel, 2018 - 2030 (USD Billion)
- 93. South Africa macro-economic outlay
- 94. South Africa vegetable oil market estimates and forecast, 2018 - 2030 (USD Billion)
- 95. South Africa vegetable oil market revenue estimates and forecast by type, 2018 - 2030 (USD Billion)
- 96. South Africa vegetable oil market revenue estimates and forecast by application, 2018 - 2030 (USD Billion)
- 97. South Africa vegetable oil market revenue estimates and forecast by distribution channel, 2018 - 2030 (USD Billion)
- 98. Saudi Arabia macro-economic outlay
- 99. Saudi Arabia vegetable oil market estimates and forecast, 2018 - 2030 (USD Billion)
- 100. Saudi Arabia vegetable oil market revenue estimates and forecast by type, 2018 - 2030 (USD Billion)
- 101. Saudi Arabia vegetable oil market revenue estimates and forecast by application, 2018 - 2030 (USD Billion)
- 102. Saudi Arabia vegetable oil market revenue estimates and forecast by distribution channel, 2018 - 2030 (USD Billion)
List of Figures
- 1. Vegetable oil market snapshot
- 2. Vegetable oil market segmentation & scope
- 3. Vegetable oil market penetration & growth prospect mapping
- 4. Vegetable oil market value chain analysis
- 5. Vegetable oil market dynamics
- 6. Vegetable oil market Porter's Five Forces analysis
- 7. Vegetable oil market: Type movement analysis, 2023 & 2030 (%)
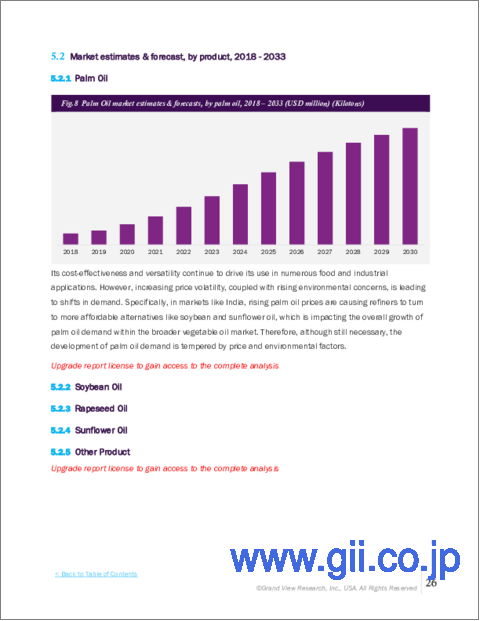
- 8. Vegetable oil market estimates and forecast, by palm oil, 2018 - 2030 (USD Billion)
- 9. Vegetable oil market estimates and forecast, by soybean oil, 2018 - 2030 (USD Billion)
- 10. Vegetable oil market estimates and forecast, by rapeseed oil, 2018 - 2030 (USD Billion)
- 11. Vegetable oil market estimates and forecast, by sunflower oil, 2018 - 2030 (USD Billion)
- 12. Vegetable oil market estimates and forecast, by others, 2018 - 2030 (USD Billion)
- 13. Vegetable oil market: Application movement analysis, 2023 & 2030 (%)
- 14. Vegetable oil market estimates and forecast, by food, 2018 - 2030 (USD Billion)
- 15. Vegetable oil market estimates and forecast, by feed, 2018 - 2030 (USD Billion)
- 16. Vegetable oil market estimates and forecast, by industrial, 2018 - 2030 (USD Billion)
- 17. Vegetable oil market: Distribution channel movement analysis, 2023 & 2030 (%)
- 18. Vegetable oil market estimates and forecast through B2B, 2018 - 2030 (USD Billion)
- 19. Vegetable oil market estimates and forecast through B2C, 2018-2030 (USD Billion)
- 20. Vegetable oil market: Regional movement analysis, 2023 & 2030 (%)
- 21. North America vegetable oil market estimates and forecast, 2018 - 2030 (USD Billion)
- 22. U.S. vegetable oil market estimates and forecast, 2018 - 2030 (USD Billion)
- 23. Canada vegetable oil market estimates and forecast, 2018 - 2030 (USD Billion)
- 24. Europe vegetable oil market estimates and forecast, 2018 - 2030 (USD Billion)
- 25. Germany vegetable oil market estimates and forecast, 2018 - 2030 (USD Billion)
- 26. U.K. vegetable oil market estimates and forecast, 2018 - 2030 (USD Billion)
- 27. Spain vegetable oil market estimates and forecast, 2018 - 2030 (USD Billion)
- 28. Italy vegetable oil market estimates and forecast, 2018 - 2030 (USD Billion)
- 29. France vegetable oil market estimates and forecast, 2018 - 2030 (USD Billion)
- 30. China vegetable oil market estimates and forecast, 2018 - 2030 (USD Billion)
- 31. India vegetable oil market estimates and forecast, 2018 - 2030 (USD Billion)
- 32. Japan vegetable oil market estimates and forecast, 2018 - 2030 (USD Billion)
- 33. South Korea vegetable oil market estimates and forecast, 2018 - 2030 (USD Billion)
- 34. Australia vegetable oil market estimates and forecast, 2018 - 2030 (USD Billion)
- 35. Central & South America vegetable oil market estimates and forecast, 2018 - 2030 (USD Billion)
- 36. Brazil vegetable oil market estimates and forecast, 2018 - 2030 (USD Billion)
- 37. Middle East & Africa vegetable oil market estimates and forecast, 2018 - 2030 (USD Billion)
- 38. South Africa vegetable oil market estimates and forecast, 2018 - 2030 (USD Billion)
- 39. Saudi Arabia vegetable oil market estimates and forecast, 2018 - 2030 (USD Billion)
Vegetable Oil Market Growth & Trends:
The global vegetable oil market size is expected to reach USD 436.12 billion by 2030, growing at a CAGR of 4.6% from 2024 to 2030, according to a new report by Grand View Research, Inc. The increasing demand for vegetable oil as a cooking ingredient and for food production is a significant factor. Vegetable oil is widely used in various cuisines globally, and as the population continues to grow, so does the demand for food products that use vegetable oil as a key ingredient. Such factors are driving the market.
Furthermore, the expanding applications of vegetable oil in non-food sectors, particularly in the biofuel industry, are contributing to market growth. With a growing emphasis on renewable energy sources, vegetable oils like soybean, corn, and palm oil are being utilized in the production of biofuels, which has spurred greater demand for these oils.
In addition, the rising awareness and preference for healthier cooking oils are influencing the vegetable oil market. As consumers become more health-conscious, there is a shift towards oils perceived as healthier alternatives, such as olive oil, sunflower oil, and canola oil. This trend has led to an increase in research and development efforts aimed at improving the nutritional profiles of vegetable oils, further bolstering market growth.
Furthermore, the expanding applications of vegetable oil in non-food sectors, particularly in the biofuel industry, are contributing to market growth. With a growing emphasis on renewable energy sources, vegetable oils like soybean, corn, and palm oil are being utilized in the production of biofuels, which has spurred greater demand for these oils.
Moreover, the versatility and diverse applications of vegetable oil in cosmetics, personal care products, and the pharmaceutical industry are also fueling market expansion. As such, the rising demand for natural and organic ingredients in these sectors has driven the use of vegetable oils in various formulations, thereby augmenting their market growth.
Vegetable Oil Market Report Highlights:
- Palm oil accounted for a share of 34.27% of the global market in 2023. The cost-effectiveness of palm oil compared to other vegetable oils has played a significant role in driving its segment in the market. As a highly efficient crop with a high yield per hectare, palm oil production offers favorable economies of scale, making it an attractive option for various industrial applications. This cost-competitive advantage has bolstered palm oil's position in the vegetable oil market, contributing to its continued growth and market dominance in the segment.
- Vegetable oil application in industrial is anticipated to grow at a CAGR of 4.9% from 2024 to 2030. The versatility and functionality of vegetable oil in industrial settings contribute to its growing adoption. Vegetable oils can be used as lubricants, hydraulic fluids, mold release agents, and bio-based solvents, offering effective alternatives to conventional synthetic chemicals. Their lubricating properties, high viscosity index, and thermal stability make them suitable for a wide range of industrial applications, driving their usage in various manufacturing processes.
- Sales through B2C distribution channel are anticipated to grow at a CAGR of 5.4% from 2024 to 2030. The evolving consumer behavior and preferences, particularly the growing demand for personalized shopping experiences and faster delivery options are driving the growth of B2C sales. Consumers today seek convenience, accessibility, and a seamless shopping experience, which B2C channels are well-positioned to provide. By offering personalized recommendations, easy payment options, and efficient delivery services, B2C distribution channels can cater to the changing needs and expectations of consumers, fostering higher sales growth in the process.
- The vegetable market in North America is expected to grow at a CAGR of 3.1% from 2024 to 2030. With a growing emphasis on health and wellness, consumers are shifting towards vegetable oils that are perceived as healthier alternatives to animal fats and trans fats. Oils such as olive oil, canola oil, and avocado oil are particularly popular due to their high content of monounsaturated and polyunsaturated fats, which are considered beneficial for heart health. Additionally, the trend towards plant-based and vegan diets is further propelling the demand for vegetable oils, as these diets often require vegetable oil as a primary ingredient in cooking and food preparation.
Table of Contents
Chapter 1. Methodology and Scope
- 1.1. Market Segmentation & Scope
- 1.2. Market Definition
- 1.3. Information Procurement
- 1.3.1. Purchased Database
- 1.3.2. GVR's Internal Database
- 1.3.3. Secondary Sources & Third-Party Perspectives
- 1.3.4. Primary Research
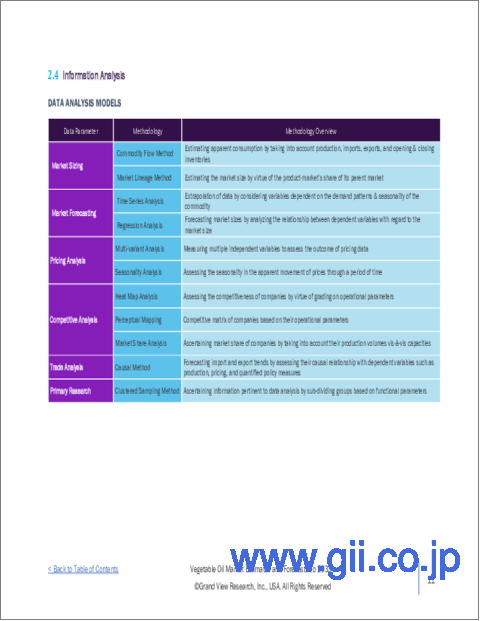
- 1.4. Information Analysis
- 1.4.1. Data Analysis Models
- 1.5. Market Formulation & Data Visualization
- 1.6. Data Validation & Publishing
Chapter 2. Executive Summary
- 2.1. Market Outlook
- 2.2. Segmental Outlook
- 2.3. Regional Outlook
Chapter 3. Vegetable Oil Market Variables, Trends & Scope
- 3.1. Market Lineage Outlook
- 3.2. Industry Value Chain Analysis
- 3.2.1. Raw Application Outlook
- 3.2.2. Manufacturing & Technology Outlook
- 3.3. Market Dynamics
- 3.3.1. Market Driver Analysis
- 3.3.2. Market Restraint Analysis
- 3.3.3. Market Opportunities
- 3.3.4. Market Challenges
- 3.4. Industry Analysis
- 3.4.1. Porter's Five Forces Analysis
- 3.4.2. PESTEL Analysis
- 3.5. Market Entry Strategy
Chapter 4. Vegetable Oil Market: Type Estimates & Trend Analysis
- 4.1. Nature Movement Analysis & Market Share, 2023 & 2030
- 4.2. Palm Oil
- 4.2.1. Market estimates and forecast, 2018 - 2030 (USD Billion)
- 4.3. Soybean Oil
- 4.3.1. Market estimates and forecast, 2018 - 2030 (USD Billion)
- 4.4. Rapeseed Oil
- 4.4.1. Market estimates and forecast, 2018 - 2030 (USD Billion)
- 4.5. Sunflower Oil
- 4.5.1. Market estimates and forecast, 2018 - 2030 (USD Billion)
- 4.6. Others
- 4.6.1. Market estimates and forecast, 2018 - 2030 (USD Billion)
Chapter 5. Vegetable Oil Market: Application Estimates & Trend Analysis
- 5.1. Source Movement Analysis & Market Share, 2023 & 2030
- 5.2. Food
- 5.2.1. Market estimates and forecast, 2018 - 2030 (USD Billion)
- 5.3. Feed
- 5.3.1. Market estimates and forecast, 2018 - 2030 (USD Billion)
- 5.4. Industrial
- 5.4.1. Market estimates and forecast, 2018 - 2030 (USD Billion)
Chapter 6. Vegetable Oil Market: Distribution Channel Estimates & Trend Analysis
- 6.1. Distribution Channel Movement Analysis & Market Share, 2023 & 2030
- 6.2. B2B
- 6.3. B2C
Chapter 7. Vegetable Oil Market: Regional Estimates & Trend Analysis
- 7.1. Regional Movement Analysis & Market Share, 2023 & 2030
- 7.2. North America
- 7.2.1. Market estimates and forecast, 2018 - 2030 (USD Billion)
- 7.2.2. U.S.
- 7.2.2.1. Key Country Dynamics
- 7.2.2.2. Market estimates and forecast, 2018 - 2030 (USD Billion)
- 7.2.3. Canada
- 7.2.3.1. Key Country Dynamics
- 7.2.3.2. Market estimates and forecast, 2018 - 2030 (USD Billion)
- 7.3. Europe
- 7.3.1. Market estimates and forecast, 2018 - 2030 (USD Billion)
- 7.3.2. Germany
- 7.3.2.1. Key Country Dynamics
- 7.3.2.2. Market estimates and forecast, 2018 - 2030 (USD Billion)
- 7.3.3. UK
- 7.3.3.1. Key Country Dynamics
- 7.3.3.2. Market estimates and forecast, 2018 - 2030 (USD Billion)
- 7.3.4. Spain
- 7.3.4.1. Key Country Dynamics
- 7.3.4.2. Market estimates and forecast, 2018 - 2030 (USD Billion)
- 7.3.5. Italy
- 7.3.5.1. Key Country Dynamics
- 7.3.5.2. Market estimates and forecast, 2018 - 2030 (USD Billion)
- 7.3.6. France
- 7.3.6.1. Key Country Dynamics
- 7.3.6.2. Market estimates and forecast, 2018 - 2030 (USD Billion)
- 7.4. Asia Pacific
- 7.4.1. Market estimates and forecast, 2018 - 2030 (USD Billion)
- 7.4.2. China
- 7.4.2.1. Key Country Dynamics
- 7.4.2.2. Market estimates and forecast, 2018 - 2030 (USD Billion)
- 7.4.3. India
- 7.4.3.1. Key Country Dynamics
- 7.4.3.2. Market estimates and forecast, 2018 - 2030 (USD Billion)
- 7.4.4. Japan
- 7.4.4.1. Key Country Dynamics
- 7.4.4.2. Market estimates and forecast, 2018 - 2030 (USD Billion)
- 7.4.5. South Korea
- 7.4.5.1. Key Country Dynamics
- 7.4.5.2. Market estimates and forecast, 2018 - 2030 (USD Billion)
- 7.4.6. Australia
- 7.4.6.1. Key Country Dynamics
- 7.4.6.2. Market estimates and forecast, 2018 - 2030 (USD Billion)
- 7.5. Central & South America
- 7.5.1. Market estimates and forecast, 2018 - 2030 (USD Billion)
- 7.5.2. Brazil
- 7.5.2.1. Key Country Dynamics
- 7.5.2.2. Market estimates and forecast, 2018 - 2030 (USD Billion)
- 7.6. Middle East & Africa
- 7.6.1. Market estimates and forecast, 2018 - 2030 (USD Billion)
- 7.6.2. South Africa
- 7.6.2.1. Key Country Dynamics
- 7.6.2.2. Market estimates and forecast, 2018 - 2030 (USD Billion)
- 7.6.3. Saudi Arabia
- 7.6.3.1. Key country dynamics
- 7.6.3.2. Market estimates and forecast, 2018 - 2030 (USD Billion)
Chapter 8. Competitive Analysis
- 8.1. Recent developments & impact analysis, by key market participants
- 8.2. Company Categorization
- 8.3. Participant's Overview
- 8.4. Financial Performance
- 8.5. Form Benchmarking
- 8.6. Company Market Share Analysis, 2023 (%)
- 8.7. Company Heat Map Analysis
- 8.8. Strategy Mapping
- 8.9. Company Profiles
- 8.9.1. Archer Daniels Midland Company
- 8.9.1.1. Company Overview
- 8.9.1.2. Financial Performance
- 8.9.1.3. Form Portfolios
- 8.9.1.4. Strategic Initiatives
- 8.9.2. Sime Darby Plantation Berhad
- 8.9.2.1. Company Overview
- 8.9.2.2. Financial Performance
- 8.9.2.3. Form Portfolios
- 8.9.2.4. Strategic Initiatives
- 8.9.3. Bunge Limited
- 8.9.3.1. Company Overview
- 8.9.3.2. Financial Performance
- 8.9.3.3. Form Portfolios
- 8.9.3.4. Strategic Initiatives
- 8.9.4. Olam International Limited
- 8.9.4.1. Company Overview
- 8.9.4.2. Financial Performance
- 8.9.4.3. Form Portfolios
- 8.9.4.4. Strategic Initiatives
- 8.9.5. Cargill Incorporated
- 8.9.5.1. Company Overview
- 8.9.5.2. Financial Performance
- 8.9.5.3. Form Portfolios
- 8.9.5.4. Strategic Initiatives
- 8.9.6. Golden Agri-Resources
- 8.9.6.1. Company Overview
- 8.9.6.2. Financial Performance
- 8.9.6.3. Form Portfolios
- 8.9.6.4. Strategic Initiatives
- 8.9.7. Kuala Lumpur Kepong Berhad
- 8.9.7.1. Company Overview
- 8.9.7.2. Financial Performance
- 8.9.7.3. Form Portfolios
- 8.9.7.4. Strategic Initiatives
- 8.9.8. Fuji Oil Holding Inc.
- 8.9.8.1. Company Overview
- 8.9.8.2. Financial Performance
- 8.9.8.3. Form Portfolios
- 8.9.8.4. Strategic Initiatives
- 8.9.9. Wilmar International Limited
- 8.9.9.1. Company Overview
- 8.9.9.2. Financial Performance
- 8.9.9.3. Form Portfolios
- 8.9.9.4. Strategic Initiatives
- 8.9.10. PT Astra Agro Lestari Tbk
- 8.9.10.1. Company Overview
- 8.9.10.2. Financial Performance
- 8.9.10.3. Form Portfolios
- 8.9.10.4. Strategic Initiatives
- 8.9.1. Archer Daniels Midland Company

