|
|
市場調査レポート
商品コード
1446562
ライフサイエンス向けMES(製造実行システム)の市場規模、シェア、動向分析レポート:ソリューションタイプ別、展開別、エンドユーザー別、地域別、セグメント別予測、2024年~2030年Manufacturing Execution System in Life Sciences Market Size, Share & Trends Analysis Report By Solution Type, By Deployment (On-Premise, Cloud/Web-Based, Hybrid), By End-User, By Region, And Segment Forecasts, 2024 - 2030 |
||||||

|
|||||||
カスタマイズ可能
|
|||||||

| ライフサイエンス向けMES(製造実行システム)の市場規模、シェア、動向分析レポート:ソリューションタイプ別、展開別、エンドユーザー別、地域別、セグメント別予測、2024年~2030年 |
|
出版日: 2024年02月29日
発行: Grand View Research
ページ情報: 英文 120 Pages
納期: 2~10営業日
|

全表示
- 概要
- 図表
- 目次
ライフサイエンス向けMES(製造実行システム)市場の成長と動向:
Grand View Research, Inc.の最新レポートによると、ライフサイエンス向けMESの世界市場規模は、2024年から2030年にかけて12.2%のCAGRを記録し、2030年には60億米ドルに達すると予測されています。
MESの導入は、ライフサイエンス業界において重要な要素として浮上しており、生産プロセス全体の効率、コンプライアンス、イノベーションの向上に役立っています。北米では、ライフサイエンス分野でMESの導入が急増しており、製造ワークフローへの変革的な影響を浮き彫りにしています。製薬やバイオテクノロジーなどのライフサイエンス業界では、製造管理に高度なアプローチが求められます。MESは、統合されたデータ主導型のソリューションを提供し、規制要件を満たし、それを上回り、リスクを低減し、製品の品質を確保する上で重要な役割を果たします。
ライフサイエンス製造における精度と品質への要求の高まりが、市場成長の主な促進要因となっています。MESは、製造ワークフローの最適化、エラーの最小化、製品開発の一貫性の維持を可能にします。個別化医療や革新的な治療法へと業界がシフトする中、MESの柔軟性と俊敏性は特に貴重なものとなっています。さらに、インダストリー4.0技術の隆盛がMESの採用を後押ししています。モノのインターネット(IoT)やアナリティクスとの統合により、ライフサイエンスメーカーにとってインテリジェントな製造エコシステムが構築されます。この接続性により、リアルタイムの監視、制御、データ主導の意思決定が可能になり、業務効率が向上します。生産性、市場投入までの時間短縮、優れた製品品質に対する需要の高まりが、ライフサイエンス業界におけるMESの導入を後押ししています。MESは、現代の製造業におけるシームレスで相互接続された、技術的に高度な未来を追求する中心的なハブになりつつあります。
ライフサイエンス向けMES市場レポートハイライト
- ペーパーレス製造、デジタル化へのシフト、製造プロセスの自動化に対する高い需要により、ソフトウェアソリューションタイプのセグメントが2023年に最大のシェアを占めました。
- オンプレミス展開セグメントが2023年に最大シェアを占め、2024年から2030年にかけてCAGR 11.7%で成長する見込み。オンプレミスのMESシステムは、構内でのデータ保存が容易であり、通信を妨げない重いインターネットに依存しません。
- このような要因が市場での採用を後押ししています。一方、クラウド/Webベースの導入セグメントは、2024年から2030年にかけて13.0%のCAGRで最速の成長が見込まれています。
- 製薬&バイオテクノロジー企業のエンドユーザーセグメントは、2023年に48.4%の最大シェアを占めました。これは、自動化とデジタル化への移行動向により、このセグメントでMESの採用率が高いためと考えられます。
- 北米は、Emerson Electric Co.、Rockwell Automation、Siemens AGなどの主要プレイヤーの存在により、2023年に31.0%のシェアで世界市場を独占しました。アジア太平洋地域は、2024年から2030年にかけて最も速いCAGRで成長すると予想されています。
- 製品開発、パートナーシップ、M&Aなど様々な戦略が主要プレーヤーによって採用されており、これが市場競争を促進しています。
- 例えば、2023年9月、KorberとEndeavorは、Werum PAS-X MESとSAPのERPプラットフォームとの統合を促進するために提携しました。この提携は、業務にこれら2つのソフトウェアソリューションを使用している企業にシームレスなソリューションを提供することを目的としています。
目次
第1章 調査手法と範囲
第2章 エグゼクティブサマリー
第3章 ライフサイエンス向けMES市場:変数、動向、範囲
- 市場系統の見通し
- 親市場の見通し
- 関連/付随市場の見通し
- 市場力学
- 市場促進要因分析
- 市場抑制要因分析
- ライフサイエンス向けMES市場分析ツール
- 業界分析- ポーターのファイブフォース分析
- PESTEL分析
第4章 ライフサイエンス向けMES市場:ソリューションタイプの推定・動向分析
- 定義と範囲
- セグメントダッシュボード
- ライフサイエンス向けMES市場の変動分析
- ライフサイエンス向けMES市場規模と動向分析、ソリューションタイプ別、2018年から2030年
第5章 ライフサイエンス向けMES市場:展開の推定・動向分析
- 定義と範囲
- セグメントダッシュボード
- ライフサイエンス向けMES市場の変動分析
- ライフサイエンス向けMES市場規模と動向分析、展開別、2018年から2030年
第6章 ライフサイエンス向けMES市場:エンドユーザーの推定・動向分析
- 定義と範囲
- セグメントダッシュボード
- ライフサイエンス向けMES市場の変動分析
- ライフサイエンス向けMES市場規模と動向分析、エンドユーザー別、2018年から2030年
第7章 ライフサイエンス向けMES市場:地域の推定・動向分析、ソリューションタイプ別、展開別、エンドユーザー別
- 地域の市場ダッシュボード
- 世界の地域の市場スナップショット
- 市場規模と予測動向分析、2018年から2030年
- 北米
- 欧州
- アジア太平洋地域
- ラテンアメリカ
- 中東・アフリカ
第8章 競合情勢
- 主要市場参入企業による最近の動向と影響分析
- 会社/競合の分類
- イノベーター
- ベンダー情勢
- ABB
- Korber AG
- MasterControl Solutions, Inc.
- AVEVA Group Limited
- Cognizant
- Rockwell Automation
- nagarro
- Siemens AG
- Emerson Electric Co.
- iBase-t
List of Tables
- Table 1 List of Abbreviation
- Table 2 North America MES in life sciences market, by region, 2018 - 2030 (USD Million)
- Table 3 North America MES in life sciences market, by solution type, 2018 - 2030 (USD Million)
- Table 4 North America MES in life sciences market, by deployment, 2018 - 2030 (USD Million)
- Table 5 North America MES in life sciences market, by end-user, 2018 - 2030 (USD Million)
- Table 6 U.S. MES in life sciences market, by solution type, 2018 - 2030 (USD Million)
- Table 7 U.S. MES in life sciences market, by deployment, 2018 - 2030 (USD Million)
- Table 8 U.S. MES in life sciences market, by end-user, 2018 - 2030 (USD Million)
- Table 9 Canada MES in life sciences market, by solution type, 2018 - 2030 (USD Million)
- Table 10 Canada MES in life sciences market, by deployment, 2018 - 2030 (USD Million)
- Table 11 Canada MES in life sciences market, by end-user, 2018 - 2030 (USD Million)
- Table 12 Europe MES in life sciences market, by region, 2018 - 2030 (USD Million)
- Table 13 Europe MES in life sciences market, by solution type, 2018 - 2030 (USD Million)
- Table 14 Europe MES in life sciences market, by deployment, 2018 - 2030 (USD Million)
- Table 15 Europe MES in life sciences market, by end-user, 2018 - 2030 (USD Million)
- Table 16 Germany MES in life sciences market, by solution type, 2018 - 2030 (USD Million)
- Table 17 Germany MES in life sciences market, by deployment, 2018 - 2030 (USD Million)
- Table 18 Germany MES in life sciences market, by end-user, 2018 - 2030 (USD Million)
- Table 19 UK MES in life sciences market, by solution type, 2018 - 2030 (USD Million)
- Table 20 UK MES in life sciences market, by deployment, 2018 - 2030 (USD Million)
- Table 21 UK MES in life sciences market, by end-user, 2018 - 2030 (USD Million)
- Table 22 France MES in life sciences market, by solution type, 2018 - 2030 (USD Million)
- Table 23 France MES in life sciences market, by deployment, 2018 - 2030 (USD Million)
- Table 24 France MES in life sciences market, by end-user, 2018 - 2030 (USD Million)
- Table 25 Italy MES in life sciences market, by solution type, 2018 - 2030 (USD Million)
- Table 26 Italy MES in life sciences market, by deployment, 2018 - 2030 (USD Million)
- Table 27 Italy MES in life sciences market, by end-user, 2018 - 2030 (USD Million)
- Table 28 Spain MES in life sciences market, by solution type, 2018 - 2030 (USD Million)
- Table 29 Spain MES in life sciences market, by deployment, 2018 - 2030 (USD Million)
- Table 30 Spain MES in life sciences market, by end-user, 2018 - 2030 (USD Million)
- Table 31 Denmark MES in life sciences market, by solution type, 2018 - 2030 (USD Million)
- Table 32 Denmark MES in life sciences market, by deployment, 2018 - 2030 (USD Million)
- Table 33 Denmark MES in life sciences market, by end-user, 2018 - 2030 (USD Million)
- Table 34 Sweden MES in life sciences market, by solution type, 2018 - 2030 (USD Million)
- Table 35 Sweden MES in life sciences market, by deployment, 2018 - 2030 (USD Million)
- Table 36 Sweden MES in life sciences market, by end-user, 2018 - 2030 (USD Million)
- Table 37 Norway MES in life sciences market, by solution type, 2018 - 2030 (USD Million)
- Table 38 Norway MES in life sciences market, by deployment, 2018 - 2030 (USD Million)
- Table 39 Norway MES in life sciences market, by end-user, 2018 - 2030 (USD Million)
- Table 40 Asia Pacific MES in life sciences market, by region, 2018 - 2030 (USD Million)
- Table 41 Asia Pacific MES in life sciences market, by solution type, 2018 - 2030 (USD Million)
- Table 42 Asia Pacific MES in life sciences market, by deployment, 2018 - 2030 (USD Million)
- Table 43 Asia Pacific MES in life sciences market, by end-user, 2018 - 2030 (USD Million)
- Table 44 China MES in life sciences market, by solution type, 2018 - 2030 (USD Million)
- Table 45 China MES in life sciences market, by deployment, 2018 - 2030 (USD Million)
- Table 46 China MES in life sciences market, by end-user, 2018 - 2030 (USD Million)
- Table 47 Japan MES in life sciences market, by solution type, 2018 - 2030 (USD Million)
- Table 48 Japan MES in life sciences market, by deployment, 2018 - 2030 (USD Million)
- Table 49 Japan MES in life sciences market, by end-user, 2018 - 2030 (USD Million)
- Table 50 India MES in life sciences market, by solution type, 2018 - 2030 (USD Million)
- Table 51 India MES in life sciences market, by deployment, 2018 - 2030 (USD Million)
- Table 52 India MES in life sciences market, by end-user, 2018 - 2030 (USD Million)
- Table 53 South Korea MES in life sciences market, by solution type, 2018 - 2030 (USD Million)
- Table 54 South Korea MES in life sciences market, by deployment, 2018 - 2030 (USD Million)
- Table 55 South Korea MES in life sciences market, by end-user, 2018 - 2030 (USD Million)
- Table 56 Australia MES in life sciences market, by solution type, 2018 - 2030 (USD Million)
- Table 57 Australia MES in life sciences market, by deployment, 2018 - 2030 (USD Million)
- Table 58 Australia MES in life sciences market, by end-user, 2018 - 2030 (USD Million)
- Table 59 Thailand MES in life sciences market, by solution type, 2018 - 2030 (USD Million)
- Table 60 Thailand MES in life sciences market, by deployment, 2018 - 2030 (USD Million)
- Table 61 Thailand MES in life sciences market, by end-user, 2018 - 2030 (USD Million)
- Table 62 Latin America MES in life sciences market, by solution type, 2018 - 2030 (USD Million)
- Table 63 Latin America MES in life sciences market, by deployment, 2018 - 2030 (USD Million)
- Table 64 Latin America MES in life sciences market, by end-user, 2018 - 2030 (USD Million)
- Table 65 Brazil MES in life sciences market, by solution type, 2018 - 2030 (USD Million)
- Table 66 Brazil MES in life sciences market, by deployment, 2018 - 2030 (USD Million)
- Table 67 Brazil MES in life sciences market, by end-user, 2018 - 2030 (USD Million)
- Table 68 Mexico MES in life sciences market, by solution type, 2018 - 2030 (USD Million)
- Table 69 Mexico MES in life sciences market, by deployment, 2018 - 2030 (USD Million)
- Table 70 Mexico MES in life sciences market, by end-user, 2018 - 2030 (USD Million)
- Table 71 Argentina MES in life sciences market, by solution type, 2018 - 2030 (USD Million)
- Table 72 Argentina MES in life sciences market, by deployment, 2018 - 2030 (USD Million)
- Table 73 Argentina surgical ablation market, by end-user, 2018 - 2030 (USD Million)
- Table 74 MEA MES in life sciences market, by region, 2018 - 2030 (USD Million)
- Table 75 MEA MES in life sciences market, by solution type, 2018 - 2030 (USD Million)
- Table 76 MEA MES in life sciences market, by deployment, 2018 - 2030 (USD Million)
- Table 77 MEA MES in life sciences market, by end-user, 2018 - 2030 (USD Million)
- Table 78 South Africa MES in life sciences market, by solution type, 2018 - 2030 (USD Million)
- Table 79 South Africa MES in life sciences market, by deployment, 2018 - 2030 (USD Million)
- Table 80 South Africa MES in life sciences market, by end-user, 2018 - 2030 (USD Million)
- Table 81 Saudi Arabia MES in life sciences market, by solution type, 2018 - 2030 (USD Million)
- Table 82 Saudi Arabia MES in life sciences market, by deployment, 2018 - 2030 (USD Million)
- Table 83 Saudi Arabia MES in life sciences market, by end-user, 2018 - 2030 (USD Million)
- Table 84 UAE MES in life sciences market, by solution type, 2018 - 2030 (USD Million)
- Table 85 UAE MES in life sciences market, by deployment, 2018 - 2030 (USD Million)
- Table 86 UAE MES in life sciences market, by end-user, 2018 - 2030 (USD Million)
- Table 87 Kuwait MES in life sciences market, by solution type, 2018 - 2030 (USD Million)
- Table 88 Kuwait MES in life sciences market, by deployment, 2018 - 2030 (USD Million)
- Table 89 Kuwait MES in life sciences market, by end-user, 2018 - 2030 (USD Million)
- Table 90 List of other players
- Table 91 Participant's overview
- Table 92 Financial per Deploymentance
- Table 93 Key companies undergoing expansions
- Table 94 Key companies undergoing acquisitions
- Table 95 Key companies undergoing collaborations
- Table 96 Key companies launching new components/services
- Table 97 Key companies undergoing partnerships
- Table 98 Key companies undertaking other strategies
List of Figures
- Fig. 1 Market research process
- Fig. 2 Data triangulation techniques
- Fig. 3 Primary research pattern
- Fig. 4 Primary interviews
- Fig. 5 Market research approaches
- Fig. 6 Value-chain-based sizing & forecasting
- Fig. 7 QFD modeling for market share assessment
- Fig. 8 Market formulation & validation
- Fig. 9 MES in life sciences market: market outlook
- Fig. 10 MES in life sciences competitive insights
- Fig. 11 Parent market outlook
- Fig. 12 Related/ancillary market outlook
- Fig. 13 Penetration and growth prospect mapping
- Fig. 14 Industry value chain analysis
- Fig. 15 MES in life sciences market driver impact
- Fig. 16 MES in life sciences market restraint impact
- Fig. 17 MES in life sciences market strategic initiatives analysis
- Fig. 18 MES in life sciences market: Solution Type movement analysis
- Fig. 19 MES in life sciences market: Solution Type outlook and key takeaways
- Fig. 20 Software market estimates and forecast, 2018 - 2030
- Fig. 21 Services estimates and forecast, 2018 - 2030
- Fig. 22 MES in life sciences market: deployment movement analysis
- Fig. 23 MES in life sciences market: deployment outlook and key takeaways
- Fig. 24 On-premise market estimates and forecast, 2018 - 2030
- Fig. 25 Clou/Web-based market estimates and forecast,2018 - 2030
- Fig. 26 Hybrid market estimates and forecast,2018 - 2030
- Fig. 27 MES in life sciences market: end-user movement analysis
- Fig. 28 MES in life sciences market: end-user outlook and key takeaways
- Fig. 29 Pharmaceutical and biotechnology companies market estimates and forecast, 2018 - 2030
- Fig. 30 Medical Device Companies market estimates and forecast,2018 - 2030
- Fig. 31 Others market estimates and forecast, 2018 - 2030
- Fig. 32 Global MES in life sciences market: regional movement analysis
- Fig. 33 Global MES in life sciences market: regional outlook and key takeaways
- Fig. 34 Global MES in life sciences market share and leading players
- Fig. 35 North America market share and leading players
- Fig. 36 Europe market share and leading players
- Fig. 37 Asia Pacific market share and leading players
- Fig. 38 Latin America market share and leading players
- Fig. 39 Middle East & Africa market share and leading players
- Fig. 40 North America: SWOT
- Fig. 41 Europe SWOT
- Fig. 42 Asia Pacific SWOT
- Fig. 43 Latin America SWOT
- Fig. 44 MEA SWOT
- Fig. 45 North America, by country
- Fig. 46 North America market estimates and forecast, 2018 - 2030
- Fig. 47 U.S. market estimates and forecast, 2018 - 2030
- Fig. 48 Canada market estimates and forecast, 2018 - 2030
- Fig. 49 Europe market estimates and forecast, 2018 - 2030
- Fig. 50 UK market estimates and forecast, 2018 - 2030
- Fig. 51 Germany market estimates and forecast, 2018 - 2030
- Fig. 52 France market estimates and forecast, 2018 - 2030
- Fig. 53 Italy market estimates and forecast, 2018 - 2030
- Fig. 54 Spain market estimates and forecast, 2018 - 2030
- Fig. 55 Denmark market estimates and forecast, 2018 - 2030
- Fig. 56 Sweden market estimates and forecast, 2018 - 2030
- Fig. 57 Norway market estimates and forecast, 2018 - 2030
- Fig. 58 Asia Pacific market estimates and forecast, 2018 - 2030
- Fig. 59 China market estimates and forecast, 2018 - 2030
- Fig. 60 Japan market estimates and forecast, 2018 - 2030
- Fig. 61 India market estimates and forecast, 2018 - 2030
- Fig. 62 Thailand market estimates and forecast, 2018 - 2030
- Fig. 63 South Korea market estimates and forecast, 2018 - 2030
- Fig. 64 Australia market estimates and forecast, 2018 - 2030
- Fig. 65 Latin America market estimates and forecast, 2018 - 2030
- Fig. 66 Brazil market estimates and forecast, 2018 - 2030
- Fig. 67 Mexico market estimates and forecast, 2018 - 2030
- Fig. 68 Argentina market estimates and forecast, 2018 - 2030
- Fig. 69 Middle East and Africa market estimates and forecast, 2018 - 2030
- Fig. 70 South Africa market estimates and forecast, 2018 - 2030
- Fig. 71 Saudi Arabia market estimates and forecast, 2018 - 2030
- Fig. 72 UAE market estimates and forecast, 2018 - 2030
- Fig. 73 Kuwait market estimates and forecast, 2018 - 2030
- Fig. 74 Market share of key market players - MES in life sciences market
Manufacturing Execution System in Life Sciences Market Growth & Trends:
The global manufacturing execution system in life sciences market size is anticipated to reach USD 6.0 billion by 2030, registering a CAGR of 12.2% from 2024 to 2030, according to a new report by Grand View Research, Inc. The adoption of manufacturing execution system (MES) is emerging as a key factor in the life science industry, helping to improve efficiency, compliance, and innovation across production processes. In North America, MES implementation is experiencing a significant surge in the life science sector, highlighting its transformative impact on manufacturing workflows. Life science industries, including pharmaceuticals and biotechnology, require a sophisticated approach to manufacturing management. MES provides integrated and data-driven solutions that are instrumental in meeting and exceeding regulatory requirements, reducing risks, and ensuring product quality.
The growing demand for precision and quality in life science manufacturing is a key driver of market growth. MES enables companies to optimize production workflows, minimize errors, and maintain consistency in product development. Its flexibility and agility are especially valuable as the industry shifts toward personalized medicine and innovative therapies. Moreover, the prominence of Industry 4.0 technologies has bolstered the adoption of MES. Integration with the Internet of Things (IoT) and analytics creates an intelligent manufacturing ecosystem for life science manufacturers. This connectivity enables real-time monitoring, control, and data-driven decision-making, enhancing operational efficiency. Increasing demand for productivity, faster time-to-market, and superior product quality boost the adoption of MES in the life science industry. MES is becoming a central hub in the pursuit of a seamless, interconnected, and technologically advanced future in modern manufacturing.
Manufacturing Execution System in Life Sciences Market Report Highlights:
- The software solution type segment held the largest share in 2023 due to the high demand for paperless manufacturing, shift towards digitalization, and automation in manufacturing processes
- The on-premise deployment segment held the largest share in 2023 and is expected to grow at a CAGR of 11.7% from 2024 to 2030. The on-premise MES system offers ease of storing data on premises and does not rely on heavy internet, which will not hamper communication
- Such factors drive its adoption in the market. On the other hand, the cloud/web-based deployment segment is expected to grow at the fastest CAGR of 13.0% from 2024 to 2030
- The pharmaceutical & biotechnology companies end-use segment held the largest share of 48.4% in 2023. This can be attributed to the high adoption of MES in this segment owing to the shifting trend towards automation and digitalization
- North America dominated the global market with a share of 31.0% in 2023 owing to the presence of key players including Emerson Electric Co., Rockwell Automation, and Siemens AG. Asia Pacific is expected to grow at the fastest CAGR from 2024 to 2030
- Various strategies, such as product development, partnerships, and mergers & acquisitions, are adopted by key players, which is driving the market competition
- For instance, in September 2023, Korber and Endeavor partnered to facilitate the integration of Werum PAS-X MES with SAP's ERP platform. This partnership aims to provide a seamless solution for businesses that use these two software solutions for their operations
Table of Contents
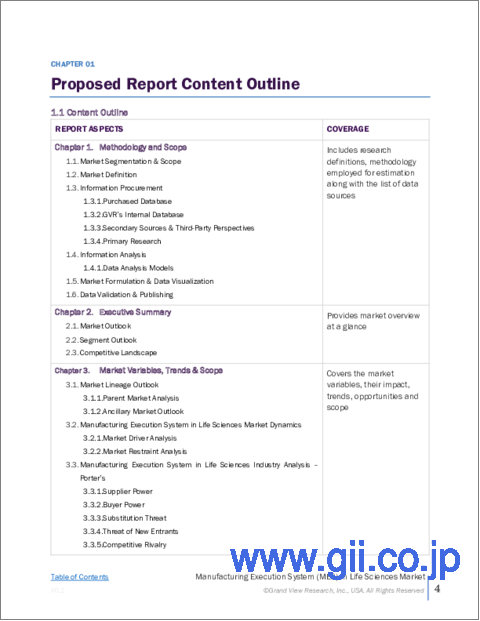
Chapter 1. Methodology and Scope
- 1.1. Market Segmentation & Scope
- 1.2. Research Methodology
- 1.3. Information Procurement
- 1.3.1. Purchased database
- 1.3.2. GVR's internal database
- 1.3.3. Secondary sources
- 1.3.4. Primary research
- 1.3.5. Details of primary research
- 1.3.5.1. Data for primary interviews in North America
- 1.3.5.2. Data for primary interviews in Europe
- 1.3.5.3. Data for primary interviews in Asia Pacific
- 1.3.5.4. Data for primary interviews in Latin America
- 1.3.5.5. Data for Primary interviews in MEA
- 1.4. Information or Data Analysis
- 1.4.1. Data analysis models
- 1.5. Market Formulation & Data Validation
- 1.6. Model Details
- 1.6.1. Commodity flow analysis (Model 1)
- 1.6.1.1. Approach 1: Commodity flow approach
- 1.6.2. Volume price analysis (Model 2)
- 1.6.2.1. Approach 2: Volume price analysis
- 1.6.1. Commodity flow analysis (Model 1)
- 1.7. List of Secondary Sources
- 1.8. List of Primary Sources
- 1.9. Objectives
Chapter 2. Executive Summary
- 2.1. Market Outlook
- 2.2. Segment Outlook
- 2.2.1. Solution Type outlook
- 2.2.2. Deployment outlook
- 2.2.3. End-User outlook
- 2.2.4. Regional outlook
- 2.3. Competitive Insights
Chapter 3. Manufacturing Execution System in Life Sciences Market Variables, Trends & Scope
- 3.1. Market Lineage Outlook
- 3.1.1. Parent market outlook
- 3.1.2. Related/ancillary market outlook
- 3.2. Market Dynamics
- 3.2.1. Market driver analysis
- 3.2.1.1. Growing demand for personalized medicine
- 3.2.1.2. Growth in pharmaceutical and biotechnology sector
- 3.2.1.3. Technological advancements
- 3.2.2. Market restraint analysis
- 3.2.2.1. High implementation costs and complexity
- 3.2.1. Market driver analysis
- 3.3. Manufacturing Execution System in Life Sciences Market Analysis Tools
- 3.3.1. Industry Analysis - Porter's
- 3.3.1.1. Supplier power
- 3.3.1.2. Buyer power
- 3.3.1.3. Substitution threat
- 3.3.1.4. Threat of new entrant
- 3.3.1.5. Competitive rivalry
- 3.3.2. PESTEL Analysis
- 3.3.2.1. Political landscape
- 3.3.2.2. Technological landscape
- 3.3.2.3. Economic landscape
- 3.3.1. Industry Analysis - Porter's
Chapter 4. Manufacturing Execution System in Life Sciences Market: Solution Type Estimates & Trend Analysis
- 4.1. Definitions and Scope
- 4.2. Segment Dashboard
- 4.3. Manufacturing Execution System in Life Sciences Market Movement Analysis
- 4.4. Manufacturing Execution System in Life Sciences Market Size & Trend Analysis, by Solution Type, 2018 to 2030 (USD Million)
- 4.4.1. Software
- 4.4.1.1. Market estimates and forecast 2018 to 2030 (USD Million)
- 4.4.2. Services
- 4.4.2.1. Market estimates and forecast 2018 to 2030 (USD Million)
- 4.4.1. Software
Chapter 5. Manufacturing Execution System in Life Sciences Market: Deployment Estimates & Trend Analysis
- 5.1. Definitions and Scope
- 5.2. Segment Dashboard
- 5.3. Manufacturing Execution System in Life Sciences Market Movement Analysis
- 5.4. Manufacturing Execution System in Life Sciences Market Size & Trend Analyses, by Deployment, 2018 to 2030 (USD Million)
- 5.4.1. On-Premise
- 5.4.1.1. Market estimates and forecast 2018 to 2030 (USD Million)
- 5.4.2. Cloud/Web-based
- 5.4.2.1. Market estimates and forecast 2018 to 2030 (USD Million)
- 5.4.3. Hybrid
- 5.4.3.1. Hybrid market estimates and forecast 2018 to 2030 (USD Million)
- 5.4.1. On-Premise
Chapter 6. Manufacturing Execution System in Life Sciences Market: End-user Estimates & Trend Analysis
- 6.1. Definitions and Scope
- 6.2. Segment Dashboard
- 6.3. Manufacturing Execution System in Life Sciences Market Movement Analysis
- 6.4. Manufacturing Execution System in Life Sciences Market Size & Trend Analyses, by End-User, 2018 to 2030 (USD Million)
- 6.4.1. Pharmaceutical and Biotechnology Companies
- 6.4.1.1. Market estimates and forecast 2018 to 2030 (USD Million)
- 6.4.2. Medical Device Companies
- 6.4.2.1. Market estimates and forecast 2018 to 2030 (USD Million)
- 6.4.3. Others (CDMOs, CROs, etc.)
- 6.4.3.1. Market estimates and forecast 2018 to 2030 (USD Million)
- 6.4.1. Pharmaceutical and Biotechnology Companies
Chapter 7. Manufacturing Execution System in Life Sciences Market: Regional Estimates & Trend Analysis by Solution Type, Deployment, & End-User
- 7.1. Regional Market Dashboard
- 7.2. Global Regional Market Snapshot
- 7.3. Market Size, & Forecasts Trend Analysis, 2018 to 2030
- 7.4. North America
- 7.4.1. Market estimates and forecasts 2018 to 2030 (USD Million)
- 7.4.2. U.S.
- 7.4.2.1. U.S. country dynamics
- 7.4.2.2. U.S. market estimates and forecast, 2018 - 2030 (USD Million)
- 7.4.3. Canada
- 7.4.3.1. Canada country dynamics
- 7.4.3.2. Canada market estimates and forecast, 2018 - 2030 (USD Million)
- 7.5. Europe
- 7.5.1. Market estimates and forecasts 2018 to 2030 (USD Million)
- 7.5.2. UK
- 7.5.2.1. UK country dynamics
- 7.5.2.2. UK market estimates and forecast, 2018 - 2030 (USD Million)
- 7.5.3. Germany
- 7.5.3.1. Germany country dynamics
- 7.5.3.2. Germany market estimates and forecast, 2018 - 2030 (USD Million)
- 7.5.4. France
- 7.5.4.1. France country dynamics
- 7.5.4.2. France market estimates and forecast, 2018 - 2030 (USD Million)
- 7.5.5. Italy
- 7.5.5.1. Italy country dynamics
- 7.5.5.2. Italy market estimates and forecast, 2018 - 2030 (USD Million)
- 7.5.6. Spain
- 7.5.6.1. Spain country dynamics
- 7.5.6.2. Spain market estimates and forecast, 2018 - 2030 (USD Million)
- 7.5.7. Norway
- 7.5.7.1. Norway country dynamics
- 7.5.7.2. Norway market estimates and forecast, 2018 - 2030 (USD Million)
- 7.5.8. Sweden
- 7.5.8.1. Sweden
- 7.5.8.2. Sweden market estimates and forecast, 2018 - 2030 (USD Million)
- 7.5.9. Denmark
- 7.5.9.1. Denmark
- 7.5.9.2. Denmark market estimates and forecast, 2018 - 2030 (USD Million)
- 7.6. Asia Pacific
- 7.6.1. Market estimates and forecasts 2018 to 2030 (USD Million)
- 7.6.2. Japan
- 7.6.2.1. Japan country dynamics
- 7.6.2.2. Japan market estimates and forecast, 2018 - 2030 (USD Million)
- 7.6.3. China
- 7.6.3.1. China country dynamics
- 7.6.3.2. China market estimates and forecast, 2018 - 2030 (USD Million)
- 7.6.4. India
- 7.6.4.1. India country dynamics
- 7.6.4.2. India market estimates and forecast, 2018 - 2030 (USD Million)
- 7.6.5. Australia
- 7.6.5.1. Australia country dynamics
- 7.6.5.2. Australia market estimates and forecast, 2018 - 2030 (USD Million)
- 7.6.6. South Korea
- 7.6.6.1. South Korea
- 7.6.6.2. South Korea market estimates and forecast, 2018 - 2030 (USD Million)
- 7.6.7. Thailand
- 7.6.7.1. Thailand
- 7.6.7.2. Thailand market estimates and forecast, 2018 - 2030 (USD Million)
- 7.7. Latin America
- 7.7.1. Market estimates and forecasts 2018 to 2030 (USD Million)
- 7.7.2. Brazil
- 7.7.2.1. Brazil
- 7.7.2.2. Brazil market estimates and forecast, 2018 - 2030 (USD Million)
- 7.7.3. Mexico
- 7.7.3.1. Mexico
- 7.7.3.2. Mexico market estimates and forecast, 2018 - 2030 (USD Million)
- 7.7.4. Argentina
- 7.7.4.1. Argentina country dynamics
- 7.7.4.2. Argentina market estimates and forecast, 2018 - 2030 (USD Million)
- 7.8. MEA
- 7.8.1. Market estimates and forecasts 2018 to 2030 (USD Million)
- 7.8.2. South Africa
- 7.8.2.1. South Africa country dynamics
- 7.8.2.2. South Africa market estimates and forecast, 2018 - 2030 (USD Million)
- 7.8.3. Saudi Arabia
- 7.8.3.1. Saudi Arabia country dynamics
- 7.8.3.2. Saudi Arabia market estimates and forecast, 2018 - 2030 (USD Million)
- 7.8.4. UAE
- 7.8.4.1. UAE country dynamics
- 7.8.4.2. UAE market estimates and forecast, 2018 - 2030 (USD Million)
- 7.8.5. Kuwait
- 7.8.5.1. Kuwait country dynamics
- 7.8.5.2. Kuwait market estimates and forecast, 2018 - 2030 (USD Million)
Chapter 8. Competitive Landscape
- 8.1. Recent Developments & Impact Analysis, By Key Market Participants
- 8.2. Company/Competition Categorization
- 8.2.1. Innovators
- 8.3. Vendor Landscape
- 8.3.1. List of key distributors and channel partners
- 8.3.2. Key customers
- 8.3.3. Key company market share analysis, 2023
- 8.3.4. ABB
- 8.3.4.1. Company overview
- 8.3.4.2. Financial performance
- 8.3.4.3. Product benchmarking
- 8.3.4.4. Strategic initiatives
- 8.3.5. Korber AG
- 8.3.5.1. Company overview
- 8.3.5.2. Financial performance
- 8.3.5.3. Product benchmarking
- 8.3.5.4. Strategic initiatives
- 8.3.6. MasterControl Solutions, Inc.
- 8.3.6.1. Company overview
- 8.3.6.2. Financial performance
- 8.3.6.3. Product benchmarking
- 8.3.6.4. Strategic initiatives
- 8.3.7. AVEVA Group Limited
- 8.3.7.1. Company overview
- 8.3.7.2. Financial performance
- 8.3.7.3. Product benchmarking
- 8.3.7.4. Strategic initiatives
- 8.3.8. Cognizant
- 8.3.8.1. Company overview
- 8.3.8.2. Financial performance
- 8.3.8.3. Product benchmarking
- 8.3.8.4. Strategic initiatives
- 8.3.9. Rockwell Automation
- 8.3.9.1. Company overview
- 8.3.9.2. Financial performance
- 8.3.9.3. Product benchmarking
- 8.3.9.4. Strategic initiatives
- 8.3.10. nagarro
- 8.3.10.1. Company overview
- 8.3.10.2. Financial performance
- 8.3.10.3. Product benchmarking
- 8.3.10.4. Strategic initiatives
- 8.3.11. Siemens AG
- 8.3.11.1. Company overview
- 8.3.11.2. Financial performance
- 8.3.11.3. Product benchmarking
- 8.3.11.4. Strategic initiatives
- 8.3.12. Emerson Electric Co.
- 8.3.12.1. Company overview
- 8.3.12.2. Financial performance
- 8.3.12.3. Product benchmarking
- 8.3.12.4. Strategic initiatives
- 8.3.13. iBase-t
- 8.3.13.1. Company overview
- 8.3.13.2. Financial performance
- 8.3.13.3. Product benchmarking
- 8.3.13.4. Strategic initiatives

