|
|
市場調査レポート
商品コード
1404878
水処理化学品の市場規模、シェア、動向分析レポート:製品別、用途別、最終用途別、地域別、セグメント別予測、2023年~2030年Water Treatment Chemicals Market Size, Share & Trends Analysis Report By Product (Coagulants & Flocculants, Biocide & Disinfectant, Scale & Corrosion Inhibitor), By Application, By End-use, By Region, And Segment Forecasts, 2023 - 2030 |
||||||
|
|
|||||||
カスタマイズ可能
|
|||||||


| 水処理化学品の市場規模、シェア、動向分析レポート:製品別、用途別、最終用途別、地域別、セグメント別予測、2023年~2030年 |
|
出版日: 2023年11月03日
発行: Grand View Research
ページ情報: 英文 97 Pages
納期: 2~10営業日
|

全表示
- 概要
- 図表
- 目次
水処理化学品市場の成長と動向:
Grand View Research, Inc.の最新レポートによると、世界の水処理化学品市場規模は2023年から2030年にかけて3.8%のCAGRを記録し、2030年には435億3,000万米ドルに達すると予測されています。
急速な工業化と廃水の汚染やリサイクルに対する意識の高まりが相まって、市場成長の原動力になると予測されています。廃水処理とは、様々な技術を用いて汚染物質を除去するプロセスです。その過程で、廃棄物や汚染された液体は化学薬品で処理され、人間の消費に適したものになります。
化学薬品の使用に関する有利な政府規制とともに、世界の消費の拡大が世界市場を牽引すると推定されます。加えて、世界人口の増加と産業活動の成長も市場の成長を促進すると予測されています。しかし、化学薬品の価格上昇や化学薬品を使用しない技術の利用拡大といった要因は、業界の成長を抑制すると予測されています。
殺生物剤・凝集剤と凝集剤分野は、それぞれ石油化学製造と砂糖・エタノール分野で市場をリードすると予測されます。これらの用途で凝集剤と殺生物剤に対する需要が増加しているのは、人間が消費するための高品質で衛生的な水を供給するために厳しい政府規制が実施されているためです。
いくつかの産業用途では水の供給が限られているため、特に肥料、石油化学製造、精製分野で使用される製品需要が高まっています。これらの部門は、処理に使用される化学物質の主要な収益シェアを占めています。リサイクル、中小企業向け中央廃水処理装置の成長、高度な生物学的処理技術は、業界の成長に寄与するいくつかの要因です。
欧州は、砂糖やエタノール、石油化学製造などの産業部門で水が大量に消費されるため、水処理用化学物質の顕著な消費者の1つです。欧州で最も広く使用されている化学薬品は、腐食防止剤、凝集剤・凝集剤、殺生物剤などで構成されています。欧州市場は、処理プロセスに関する厳しい環境規制とともに、いくつかの産業用途における高い水質基準の実施によって牽引されています。
水処理化学品市場のレポートハイライト
- 凝集剤と凝集剤セグメントは、処理プラントのほとんどが沈殿プロセスを含むため、2022年に38.2%の最大の収益シェアを占めました。凝集と凝集は、石油・ガスプラントの化学製品のタンクで主に使用されています。
- 原水処理セグメントは、冷却、製品配合、すすぎ、あるいは適切に浄化されれば人間の消費に至るまで、産業現場での利用が増加しているため、2022年に48.2%の最大売上シェアを占めました。
- 自治体セグメントは、産業および自治体の廃水処理用途での化学薬品の広範な使用により、2022年に約43.1%の最大の売上シェアを占めました。
- アジア太平洋地域は、予測期間中にCAGR 4.4%で成長すると予想されます。産業、電力、製造セクターの成長は、近い将来、アジア太平洋の新興国におけるボイラー化学薬品とシステムの需要を増大させると予測されています。
目次
第1章 調査手法と範囲
第2章 エグゼクティブサマリー
第3章 水処理化学品市場の変数、動向、範囲
- 市場系統の見通し
- 普及と成長の見通しマッピング
- バリューチェーン分析
- 規制の枠組み
- 市場力学
- 市場促進要因分析
- 市場抑制要因分析
- 業界の機会と課題
- 水処理化学品市場分析ツール
- 業界分析- ポーターのファイブフォース分析
- PESTEL分析
第4章 サプライヤーのポートフォリオ分析
- サプライヤー一覧
- Kraljic Matrix
- 調達のベストプラクティス
- 交渉戦略
第5章 水処理化学品市場:製品の推定・動向分析
- 水処理化学薬品市場:重要なポイント
- 水処理化学薬品市場:動向と市場シェア分析、2022年および2030年
- 凝集剤・凝集剤
- 殺生剤および消毒剤
- 消泡剤・消泡剤
- pH・調整剤・柔軟剤
- スケールおよび腐食防止剤
- その他
第6章 水処理化学品市場:用途の推定・動向分析
- 水処理化学薬品市場:重要なポイント
- 水処理化学薬品市場:動向と市場シェア分析、2022年および2030年
- 原水処理
- 水の淡水化
- 冷却
- ボイラー
- 排水処理
- その他
第7章 水処理化学薬品市場:最終用途の推定・動向分析
- 水処理化学薬品市場:重要なポイント
- 水処理化学薬品市場:動向と市場シェア分析、2022年および2030年
- 電力
- 石油ガス
- 化学品製造
- 鉱業と鉱物加工
- 自治体
- 飲食品
- パルプ・紙
- その他
第8章 水処理化学品市場:地域の推定・動向分析
- 地域別の見通し
- 地域別の水処理化学品市場:重要なポイント
- 北米
- 市場推計・予測、2018~2030年
- 米国
- カナダ
- メキシコ
- 欧州
- 英国
- ドイツ
- フランス
- イタリア
- スペイン
- アジア太平洋地域
- 日本
- 中国
- インド
- 東南アジア
- 韓国
- 中南米
- ブラジル
- コロンビア
- 中東・アフリカ
- アゼルバイジャン
- ウズベキスタン
- トルコ
- トルクメニスタン
- イラン
- カザフスタン
- ジョージア
第9章 競合情勢
- 主要市場参入企業による最近の動向と影響分析
- 市場参入企業の分類
- SUEZ
- BASF SE
- Ecolab
- Solenis
- Nouryon
- Kemira
- Baker Hughes Company
- Dow
- SNF
- Cortec Corporation
- Buckman
- Solvay
- Kurita Europe GmbH
- Veolia
- Somicon ME FZC
- Green Water Treatment Solutions
- Johnson Matthey
List of Tables
- Table 1 List of abbreviation
- Table 2 North America water treatment chemicals market, by product, 2018 - 2030 (USD Million)
- Table 3 North America water treatment chemicals market, by end-use, 2018 - 2030 (USD Million)
- Table 4 North America water treatment chemicals market, by application, 2018 - 2030 (USD Million)
- Table 5 North America water treatment chemicals market, by region, 2018 - 2030 (USD Million)
- Table 6 U.S. water treatment chemicals market, by product, 2018 - 2030 (USD Million)
- Table 7 U.S. water treatment chemicals market, by end-use, 2018 - 2030 (USD Million)
- Table 8 U.S. water treatment chemicals market, by application, 2018 - 2030 (USD Million)
- Table 9 Canada water treatment chemicals market, by product, 2018 - 2030 (USD Million)
- Table 10 Canada water treatment chemicals market, by end-use, 2018 - 2030 (USD Million)
- Table 11 Canada water treatment chemicals market, by application, 2018 - 2030 (USD Million)
- Table 12 Mexico water treatment chemicals market, by product, 2018 - 2030 (USD Million)
- Table 13 Mexico water treatment chemicals market, by end-use, 2018 - 2030 (USD Million)
- Table 14 Mexico water treatment chemicals market, by application, 2018 - 2030 (USD Million)
- Table 15 Europe water treatment chemicals market, by product, 2018 - 2030 (USD Million)
- Table 16 Europe water treatment chemicals market, by end-use, 2018 - 2030 (USD Million)
- Table 17 Europe water treatment chemicals market, by application, 2018 - 2030 (USD Million)
- Table 18 Europe water treatment chemicals market, by region, 2018 - 2030 (USD Million)
- Table 19 Germany water treatment chemicals market, by product, 2018 - 2030 (USD Million)
- Table 20 Germany water treatment chemicals market, by end-use, 2018 - 2030 (USD Million)
- Table 21 Germany water treatment chemicals market, by application, 2018 - 2030 (USD Million)
- Table 22 UK water treatment chemicals market, by product, 2018 - 2030 (USD Million)
- Table 23 UK water treatment chemicals market, by end-use, 2018 - 2030 (USD Million)
- Table 24 UK water treatment chemicals market, by application, 2018 - 2030 (USD Million)
- Table 25 France water treatment chemicals market, by product, 2018 - 2030 (USD Million)
- Table 26 France water treatment chemicals market, by end-use, 2018 - 2030 (USD Million)
- Table 27 France water treatment chemicals market, by application, 2018 - 2030 (USD Million)
- Table 28 Italy water treatment chemicals market, by product, 2018 - 2030 (USD Million)
- Table 29 Italy water treatment chemicals market, by end-use, 2018 - 2030 (USD Million)
- Table 30 Italy water treatment chemicals market, by application, 2018 - 2030 (USD Million)
- Table 31 Spain water treatment chemicals market, by product, 2018 - 2030 (USD Million)
- Table 32 Spain water treatment chemicals market, by end-use, 2018 - 2030 (USD Million)
- Table 33 Spain water treatment chemicals market, by application, 2018 - 2030 (USD Million)
- Table 34 Asia Pacific water treatment chemicals market, by product, 2018 - 2030 (USD Million)
- Table 35 Asia Pacific water treatment chemicals market, by end-use, 2018 - 2030 (USD Million)
- Table 36 Asia Pacific water treatment chemicals market, by application, 2018 - 2030 (USD Million)
- Table 37 Asia Pacific water treatment chemicals market, by region, 2018 - 2030 (USD Million)
- Table 38 China water treatment chemicals market, by product, 2018 - 2030 (USD Million)
- Table 39 China water treatment chemicals market, by end-use, 2018 - 2030 (USD Million)
- Table 40 China water treatment chemicals market, by application, 2018 - 2030 (USD Million)
- Table 41 Japan water treatment chemicals market, by product, 2018 - 2030 (USD Million)
- Table 42 Japan water treatment chemicals market, by end-use, 2018 - 2030 (USD Million)
- Table 43 Japan water treatment chemicals market, by application, 2018 - 2030 (USD Million)
- Table 44 India water treatment chemicals market, by product, 2018 - 2030 (USD Million)
- Table 45 India water treatment chemicals market, by end-use, 2018 - 2030 (USD Million)
- Table 46 India water treatment chemicals market, by application, 2018 - 2030 (USD Million)
- Table 47 South East Asia water treatment chemicals market, by product, 2018 - 2030 (USD Million)
- Table 48 South East Asia water treatment chemicals market, by end-use, 2018 - 2030 (USD Million)
- Table 49 South East Asia water treatment chemicals market, by application, 2018 - 2030 (USD Million)
- Table 50 South Korea water treatment chemicals market, by product, 2018 - 2030 (USD Million)
- Table 51 South Korea water treatment chemicals market, by end-use, 2018 - 2030 (USD Million)
- Table 52 South Korea water treatment chemicals market, by application, 2018 - 2030 (USD Million)
- Table 53 Central & South America water treatment chemicals market, by product, 2018 - 2030 (USD Million)
- Table 54 Central & South America water treatment chemicals market, by end-use, 2018 - 2030 (USD Million)
- Table 55 Central & South America water treatment chemicals market, by application, 2018 - 2030 (USD Million)
- Table 56 Central & South America water treatment chemicals market, by region, 2018 - 2030 (USD Million)
- Table 57 Brazil water treatment chemicals market, by product, 2018 - 2030 (USD Million)
- Table 58 Brazil water treatment chemicals market, by end-use, 2018 - 2030 (USD Million)
- Table 59 Brazil water treatment chemicals market, by application, 2018 - 2030 (USD Million)
- Table 60 Colombia water treatment chemicals market, by product, 2018 - 2030 (USD Million)
- Table 61 Colombia water treatment chemicals market, by end-use, 2018 - 2030 (USD Million)
- Table 62 Colombia water treatment chemicals market, by application, 2018 - 2030 (USD Million)
- Table 63 Middle East and Africa water treatment chemicals market, by product, 2018 - 2030 (USD Million)
- Table 64 Middle East and Africa water treatment chemicals market, by end-use, 2018 - 2030 (USD Million)
- Table 65 Middle East and Africa water treatment chemicals market, by application, 2018 - 2030 (USD Million)
- Table 66 Middle East and Africa water treatment chemicals market, by region, 2018 - 2030 (USD Million)
- Table 67 Uzbekistan water treatment chemicals market, by product, 2018 - 2030 (USD Million)
- Table 68 Uzbekistan water treatment chemicals market, by end-use, 2018 - 2030 (USD Million)
- Table 69 Uzbekistan water treatment chemicals market, by application, 2018 - 2030 (USD Million)
- Table 70 Azerbaijan water treatment chemicals market, by product, 2018 - 2030 (USD Million)
- Table 71 Azerbaijan water treatment chemicals market, by end-use, 2018 - 2030 (USD Million)
- Table 72 Azerbaijan water treatment chemicals market, by application, 2018 - 2030 (USD Million)
- Table 73 Turkey water treatment chemicals market, by product, 2018 - 2030 (USD Million)
- Table 74 Turkey water treatment chemicals market, by end-use, 2018 - 2030 (USD Million)
- Table 75 Turkey water treatment chemicals market, by application, 2018 - 2030 (USD Million)
- Table 76 Turkmenistan water treatment chemicals market, by product, 2018 - 2030 (USD Million)
- Table 77 Turkmenistan water treatment chemicals market, by end-use, 2018 - 2030 (USD Million)
- Table 78 Turkmenistan water treatment chemicals market, by application, 2018 - 2030 (USD Million)
- Table 79 Iran water treatment chemicals market, by product, 2018 - 2030 (USD Million)
- Table 80 Iran water treatment chemicals market, by end-use, 2018 - 2030 (USD Million)
- Table 81 Iran water treatment chemicals market, by application, 2018 - 2030 (USD Million)
- Table 82 Kazakhstan water treatment chemicals market, by product, 2018 - 2030 (USD Million)
- Table 83 Kazakhstan water treatment chemicals market, by end-use, 2018 - 2030 (USD Million)
- Table 84 Kazakhstan water treatment chemicals market, by application, 2018 - 2030 (USD Million)
- Table 85 Georgia water treatment chemicals market, by product, 2018 - 2030 (USD Million)
- Table 86 Georgia water treatment chemicals market, by end-use, 2018 - 2030 (USD Million)
- Table 87 Georgia water treatment chemicals market, by application, 2018 - 2030 (USD Million)
List of Figures
- Fig. 1 Market research process
- Fig. 2 Data triangulation techniques
- Fig. 3 Primary research pattern
- Fig. 4 Market research approaches
- Fig. 5 Value-chain-based sizing & forecasting
- Fig. 6 QFD modeling for market share assessment
- Fig. 7 Market formulation & validation
- Fig. 8 Water treatment chemicals: Market outlook
- Fig. 9 Water treatment chemicals: Competitive insights
- Fig. 10 Parent market outlook
- Fig. 11 Related/ancillary market outlook
- Fig. 12 Penetration and growth prospect mapping
- Fig. 13 Industry value chain analysis
- Fig. 14 Water treatment chemicals market driver impact
- Fig. 15 Water treatment chemicals market restraint impact
- Fig. 16 Water treatment chemicals market strategic initiatives analysis
- Fig. 17 Water treatment chemicals market: Product movement analysis
- Fig. 18 Water treatment chemicals market: Product outlook and key takeaways
- Fig. 19 Coagulants & flocculants market estimates and forecasts, 2018 - 2030
- Fig. 20 Biocide & disinfectant market estimates and forecasts, 2018 - 2030
- Fig. 21 Defoamer & defoaming agent market estimates and forecasts, 2018 - 2030
- Fig. 22 pH & adjuster & softener market estimates and forecasts, 2018 - 2030
- Fig. 23 Scale & corrosion inhibitor market estimates and forecasts, 2018 - 2030
- Fig. 24 Others market estimates and forecasts, 2018 - 2030
- Fig. 25 Water treatment chemicals market: End-use movement analysis
- Fig. 26 Water treatment chemicals market: End-use outlook and key takeaways
- Fig. 27 Power market estimates and forecasts, 2018 - 2030
- Fig. 28 Oil & gas market estimates and forecasts, 2018 - 2030
- Fig. 29 Chemical manufacturing market estimates and forecasts, 2018 - 2030
- Fig. 30 Mining & mineral market estimates and forecasts, 2018 - 2030
- Fig. 31 Municipal market estimates and forecasts, 2018 - 2030
- Fig. 32 Food & beverage market estimates and forecasts, 2018 - 2030
- Fig. 33 Pulp & paper market estimates and forecasts, 2018 - 2030
- Fig. 34 Others market estimates and forecasts, 2018 - 2030
- Fig. 35 Water treatment chemicals market: Application movement analysis
- Fig. 36 Water treatment chemicals market: Application outlook and key takeaways
- Fig. 37 Raw water treatment market estimates and forecasts, 2018 - 2030
- Fig. 38 Water desalination market estimates and forecasts, 2018 - 2030
- Fig. 39 Cooling market estimates and forecasts, 2018 - 2030
- Fig. 40 Boiler market estimates and forecasts, 2018 - 2030
- Fig. 41 Effluent water treatment market estimates and forecasts, 2018 - 2030
- Fig. 42 Others market estimates and forecasts, 2018 - 2030
- Fig. 43 Global water treatment chemicals market: Regional movement analysis
- Fig. 44 Global water treatment chemicals market: Regional outlook and key takeaways
- Fig. 45 North America market estimates and forecasts, 2018 - 2030
- Fig. 46 U.S. market estimates and forecasts, 2018 - 2030
- Fig. 47 Canada market estimates and forecasts, 2018 - 2030
- Fig. 48 Mexico market estimates and forecasts, 2018 - 2030
- Fig. 49 Europe market estimates and forecasts, 2018 - 2030
- Fig. 50 U.K. market estimates and forecasts, 2018 - 2030
- Fig. 51 Germany market estimates and forecasts, 2018 - 2030
- Fig. 52 France market estimates and forecasts, 2018 - 2030
- Fig. 53 Italy market estimates and forecasts, 2018 - 2030
- Fig. 54 Spain market estimates and forecasts, 2018 - 2030
- Fig. 55 Asia Pacific market estimates and forecasts, 2018 - 2030
- Fig. 56 Japan market estimates and forecasts, 2018 - 2030
- Fig. 57 China market estimates and forecasts, 2018 - 2030
- Fig. 58 India market estimates and forecasts, 2018 - 2030
- Fig. 59 South East Asia market estimates and forecasts, 2018 - 2030
- Fig. 60 South Korea market estimates and forecasts, 2018 - 2030
- Fig. 61 Central & South America market estimates and forecasts, 2018 - 2030
- Fig. 62 Brazil market estimates and forecasts, 2018 - 2030
- Fig. 63 Colombia market estimates and forecasts, 2018 - 2030
- Fig. 64 Middle East and Africa. market estimates and forecasts, 2018 - 2030
- Fig. 65 Azerbaijan market estimates and forecasts, 2018 - 2030
- Fig. 66 Uzbekistan market estimates and forecasts, 2018 - 2030
- Fig. 67 Turkey market estimates and forecasts, 2018 - 2030
- Fig. 68 Turkmenistan market estimates and forecasts, 2018 - 2030
- Fig. 69 Iran market estimates and forecasts, 2018 - 2030
- Fig. 70 Kazakhstan market estimates and forecasts, 2018 - 2030
- Fig. 71 Georgia market estimates and forecasts, 2018 - 2030
Water Treatment Chemicals Market Growth & Trends:
The global water treatment chemicals market size is anticipated to reach USD 43.53 billion by 2030, registering a CAGR of 3.8% from 2023 to 2030, according to a new report by Grand View Research, Inc. Rapid industrialization coupled with increasing awareness towards pollution and recycling of wastewater is anticipated to drive the market growth. It is explained as a process engaged in eliminating the contaminants by using various techniques. In the process, the waste or contaminated fluid is treated with chemicals to make it adequate for human consumption.
Growing worldwide consumption along with favorable government regulations for the use of chemicals is estimated to drive the market across the globe. In addition, increasing world population and growth in industrial activities is also projected to fuel the market growth. However, factors like rising prices of chemicals and growing use of chemical free technologies is projected to restrain the industry growth.
The biocides and coagulants and flocculants segments are projected to lead the market in petrochemical manufacturing and sugar and ethanol sector respectively. The increasing demand for flocculants and biocides in these applications is due to the implementation of stringent government regulations to provide quality and hygienic water for human consumption.
Limited supply of water for several industrial applications is propelled to fuel the product demand for use especially in the fertilizers, petrochemical manufacturing and refining sectors. These sectors collectively account major revenue share of the chemicals used for treatment. Recycling, growth of central wastewater treatment unit for SME's, and advanced biological treatment technologies are a few factors contributing to the industry growth.
Europe is one of the prominent consumers of water treatment chemicals owing to large consumption of water for industrial sectors such as sugar and ethanol and petrochemical manufacturing. The most widely used chemicals in Europe comprise of corrosion inhibitors, coagulants & flocculants, and biocides among others. The Europe market is driven by implementation of high-water quality standards for several industrial applications along with stringent environmental regulations for treatment processes.
Water Treatment Chemicals Market Report Highlights:
- The coagulants & flocculants segment accounted for the largest revenue share of 38.2% in 2022 as most of the treatment plant includes the sedimentation process. Coagulation and flocculation are mostly used in the tank of chemical products of oil and gas plants.
- The raw water treatment segment held the largest revenue share of 48.2% in 2022 owing to growing utilization in industrial settings for cooling, product formulations, rinsing, or even human consumption if it is properly purified.
- The municipal segment accounted for the largest revenue share of around 43.1% in 2022 owing to extensive usage of the chemicals for industrial and municipal wastewater treatment applications.
- Asia Pacific is expected to grow at a CAGR of 4.4% during the forecast period. The growth of the industrial, power, and manufacturing sectors is anticipated to augment the demand for boiler chemicals and systems in the emerging economies of Asia Pacific in the near future.
Table of Contents
Chapter 1. Methodology and Scope
- 1.1. Market Segmentation & Scope
- 1.1.1. Product
- 1.1.2. Application
- 1.1.3. End-use
- 1.1.4. Regional scope
- 1.1.5. Estimates and forecast timeline
- 1.2. Research Methodology
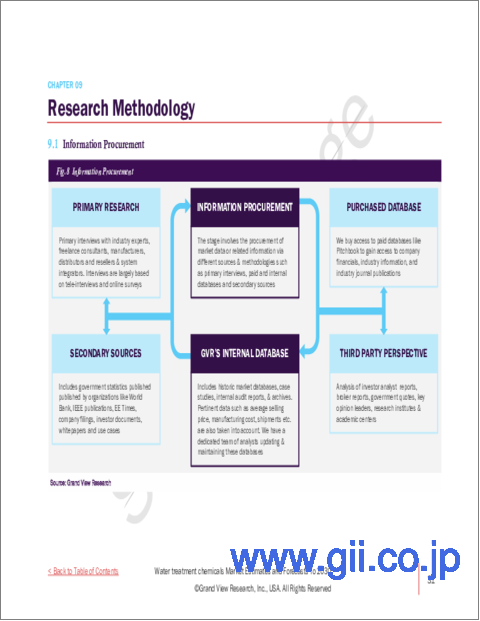
- 1.3. Information Procurement
- 1.3.1. Purchased database
- 1.3.2. GVR's internal database
- 1.3.3. Secondary sources
- 1.3.4. Primary research
- 1.3.5. Details of primary research
- 1.4. Information or Data Analysis
- 1.5. Market Formulation & Validation
- 1.6. Model Details
- 1.7. List of Secondary Sources
- 1.8. List of Primary Sources
- 1.9. Objectives
Chapter 2. Executive Summary
- 2.1. Market Outlook
- 2.2. Segment Outlook
- 2.2.1. Product outlook
- 2.2.2. End-use outlook
- 2.2.3. Application outlook
- 2.2.4. Regional outlook
- 2.3. Competitive Insights
Chapter 3. Water Treatment Chemicals Market Variables, Trends & Scope
- 3.1. Market Lineage Outlook
- 3.2. Penetration & Growth Prospect Mapping
- 3.3. Value Chain Analysis
- 3.4. Regulatory Framework
- 3.5. Market Dynamics
- 3.5.1. Market driver analysis
- 3.5.2. Market restraint analysis
- 3.5.3. Industry opportunities & challenges
- 3.6. Water Treatment Chemicals Market Analysis Tools
- 3.6.1. Industry Analysis - Porter's
- 3.6.1.1. Supplier power
- 3.6.1.2. Buyer power
- 3.6.1.3. Substitution threat
- 3.6.1.4. Threat of new entrant
- 3.6.1.5. Competitive rivalry
- 3.6.2. PESTEL Analysis
- 3.6.2.1. Political landscape
- 3.6.2.2. Technological landscape
- 3.6.2.3. Economic landscape
- 3.6.2.4. Social landscape
- 3.6.2.5. Environmental landscape
- 3.6.2.6. Legal landscape
- 3.6.1. Industry Analysis - Porter's
Chapter 4. Supplier Portfolio Analysis
- 4.1. List of Suppliers
- 4.2. Kraljic Matrix
- 4.3. Sourcing Best Practices
- 4.4. Negotiation Strategies
Chapter 5. Water Treatment Chemicals Market: Product Estimates & Trend Analysis
- 5.1. Water Treatment Chemicals Market: Key Takeaways
- 5.2. Water Treatment Chemicals Market: Movement & Market Share Analysis, 2022 & 2030
- 5.3. Coagulants & Flocculants
- 5.3.1. Coagulants & flocculants market estimates and forecasts, 2018 to 2030 (USD Million)
- 5.4. Biocide & Disinfectant
- 5.4.1. Biocide & disinfectant market estimates and forecasts, 2018 to 2030 (USD Million)
- 5.5. Defoamer & Defoaming Agent
- 5.5.1. Defoamer & defoaming agent market estimates and forecasts, 2018 to 2030 (USD Million)
- 5.6. pH & Adjuster & Softener
- 5.6.1. pH & adjuster & softener market estimates and forecasts, 2018 to 2030 (USD Million)
- 5.7. Scale & Corrosion Inhibitor
- 5.7.1. Scale & corrosion inhibitor market estimates and forecasts, 2018 to 2030 (USD Million)
- 5.8. Others
- 5.8.1. Others market estimates and forecasts, 2018 to 2030 (USD Million)
Chapter 6. Water Treatment Chemicals Market: Application Estimates & Trend Analysis
- 6.1. Water Treatment Chemicals Market: Key Takeaways
- 6.2. Water Treatment Chemicals Market: Movement & Market Share Analysis, 2022 & 2030
- 6.3. Raw Water Treatment
- 6.3.1. Raw water treatment market estimates and forecasts, 2018 to 2030 (USD Million)
- 6.4. Water Desalination
- 6.4.1. Water desalination market estimates and forecasts, 2018 to 2030 (USD Million)
- 6.5. Cooling
- 6.5.1. Cooling market estimates and forecasts, 2018 to 2030 (USD Million)
- 6.6. Boiler
- 6.6.1. Boiler market estimates and forecasts, 2018 to 2030 (USD Million)
- 6.7. Effluent Water Treatment
- 6.7.1. Effluent water treatment market estimates and forecasts, 2018 to 2030 (USD Million)
- 6.8. Others
- 6.8.1. Others market estimates and forecasts, 2018 to 2030 (USD Million)
Chapter 7. Water Treatment Chemicals Market: End-use Estimates & Trend Analysis
- 7.1. Water Treatment Chemicals Market: Key Takeaways
- 7.2. Water Treatment Chemicals Market: Movement & Market Share Analysis, 2022 & 2030
- 7.3. Power
- 7.3.1. Power market estimates and forecasts, 2018 to 2030 (USD Million)
- 7.4. Oil & Gas
- 7.4.1. Oil & gas market estimates and forecasts, 2018 to 2030 (USD Million)
- 7.5. Chemical Manufacturing
- 7.5.1. Chemical manufacturing market estimates and forecasts, 2018 to 2030 (USD Million)
- 7.6. Mining & Mineral Processing
- 7.6.1. Mining & mineral processing market estimates and forecasts, 2018 to 2030 (USD Million)
- 7.7. Municipal
- 7.7.1. Municipal market estimates and forecasts, 2018 to 2030 (USD Million)
- 7.8. Food & Beverage
- 7.8.1. Food & beverage market estimates and forecasts, 2018 to 2030 (USD Million)
- 7.9. Power Pulp & Paper
- 7.9.1. Power pulp & paper market estimates and forecasts, 2018 to 2030 (USD Million)
- 7.10. Others
- 7.10.1. Others market estimates and forecasts, 2018 to 2030 (USD Million)
Chapter 8. Water Treatment Chemicals Market: Regional Estimates & Trend Analysis
- 8.1. Regional Outlook
- 8.2. Water Treatment Chemicals Market by Region: Key Takeaway
- 8.3. North America
- 8.3.1. Market estimates and forecasts, 2018 - 2030 (Revenue, USD Million)
- 8.3.2. U.S.
- 8.3.2.1. Market estimates and forecasts, 2018 - 2030 (Revenue, USD Million)
- 8.3.3. Canada
- 8.3.3.1. Market estimates and forecasts, 2018 - 2030 (Revenue, USD Million)
- 8.3.4. Mexico
- 8.3.4.1. Market estimates and forecasts, 2018 - 2030 (Revenue, USD Million)
- 8.4. Europe
- 8.4.1. UK
- 8.4.1.1. Market estimates and forecasts, 2018 - 2030 (Revenue, USD Million)
- 8.4.2. Germany
- 8.4.2.1. Market estimates and forecasts, 2018 - 2030 (Revenue, USD Million)
- 8.4.3. France
- 8.4.3.1. Market estimates and forecasts, 2018 - 2030 (Revenue, USD Million)
- 8.4.4. Italy
- 8.4.4.1. Market estimates and forecasts, 2018 - 2030 (Revenue, USD Million)
- 8.4.5. Spain
- 8.4.5.1. Market estimates and forecasts, 2018 - 2030 (Revenue, USD Million)
- 8.4.1. UK
- 8.5. Asia Pacific
- 8.5.1. Japan
- 8.5.1.1. Market estimates and forecasts, 2018 - 2030 (Revenue, USD Million)
- 8.5.2. China
- 8.5.2.1. Market estimates and forecasts, 2018 - 2030 (Revenue, USD Million)
- 8.5.3. India
- 8.5.3.1. Market estimates and forecasts, 2018 - 2030 (Revenue, USD Million)
- 8.5.4. South East Asia
- 8.5.4.1. Market estimates and forecasts, 2018 - 2030 (Revenue, USD Million)
- 8.5.5. South Korea
- 8.5.5.1. Market estimates and forecasts, 2018 - 2030 (Revenue, USD Million)
- 8.5.1. Japan
- 8.6. Central & South America
- 8.6.1. Brazil
- 8.6.1.1. Market estimates and forecasts, 2018 - 2030 (Revenue, USD Million)
- 8.6.2. Colombia
- 8.6.2.1. Market estimates and forecasts, 2018 - 2030 (Revenue, USD Million)
- 8.6.1. Brazil
- 8.7. MEA
- 8.7.1. Azerbaijan
- 8.7.1.1. Market estimates and forecasts, 2018 - 2030 (Revenue, USD Million)
- 8.7.2. Uzbekistan
- 8.7.2.1. Market estimates and forecasts, 2018 - 2030 (Revenue, USD Million)
- 8.7.3. Turkey
- 8.7.3.1. Market estimates and forecasts, 2018 - 2030 (Revenue, USD Million)
- 8.7.4. Turkmenistan
- 8.7.4.1. Market estimates and forecasts, 2018 - 2030 (Revenue, USD Million)
- 8.7.5. Iran
- 8.7.5.1. Market estimates and forecasts, 2018 - 2030 (Revenue, USD Million)
- 8.7.6. Kazakhstan
- 8.7.6.1. Market estimates and forecasts, 2018 - 2030 (Revenue, USD Million)
- 8.7.7. Georgia
- 8.7.7.1. Market estimates and forecasts, 2018 - 2030 (Revenue, USD Million)
- 8.7.1. Azerbaijan
Chapter 9. Competitive Landscape
- 9.1. Recent Developments & Impact Analysis, By Key Market Participants
- 9.2. Market Participant Categorization
- 9.2.1. SUEZ
- 9.2.1.1. Company overview
- 9.2.1.2. Financial performance
- 9.2.1.3. Product benchmarking
- 9.2.1.4. Strategic initiatives
- 9.2.2. BASF SE
- 9.2.2.1. Company overview
- 9.2.2.2. Financial performance
- 9.2.2.3. Product benchmarking
- 9.2.2.4. Strategic initiatives
- 9.2.3. Ecolab
- 9.2.3.1. Company overview
- 9.2.3.2. Financial performance
- 9.2.3.3. Product benchmarking
- 9.2.3.4. Strategic initiatives
- 9.2.4. Solenis
- 9.2.4.1. Company overview
- 9.2.4.2. Financial performance
- 9.2.4.3. Product benchmarking
- 9.2.4.4. Strategic initiatives
- 9.2.5. Nouryon
- 9.2.5.1. Company overview
- 9.2.5.2. Financial performance
- 9.2.5.3. Product benchmarking
- 9.2.5.4. Strategic initiatives
- 9.2.6. Kemira
- 9.2.6.1. Company overview
- 9.2.6.2. Financial performance
- 9.2.6.3. Product benchmarking
- 9.2.6.4. Strategic initiatives
- 9.2.7. Baker Hughes Company
- 9.2.7.1. Company overview
- 9.2.7.2. Financial performance
- 9.2.7.3. Product benchmarking
- 9.2.7.4. Strategic initiatives
- 9.2.8. Dow
- 9.2.8.1. Company overview
- 9.2.8.2. Financial performance
- 9.2.8.3. Product benchmarking
- 9.2.8.4. Strategic initiatives
- 9.2.9. SNF
- 9.2.9.1. Company overview
- 9.2.9.2. Financial performance
- 9.2.9.3. Product benchmarking
- 9.2.9.4. Strategic initiatives
- 9.2.10. Cortec Corporation
- 9.2.10.1. Company overview
- 9.2.10.2. Financial performance
- 9.2.10.3. Product benchmarking
- 9.2.10.4. Strategic initiatives
- 9.2.11. Buckman
- 9.2.11.1. Company overview
- 9.2.11.2. Financial performance
- 9.2.11.3. Product benchmarking
- 9.2.11.4. Strategic initiatives
- 9.2.12. Solvay
- 9.2.12.1. Company overview
- 9.2.12.2. Financial performance
- 9.2.12.3. Product benchmarking
- 9.2.12.4. Strategic initiatives
- 9.2.13. Kurita Europe GmbH
- 9.2.13.1. Company overview
- 9.2.13.2. Financial performance
- 9.2.13.3. Product benchmarking
- 9.2.13.4. Strategic initiatives
- 9.2.14. Veolia
- 9.2.14.1. Company overview
- 9.2.14.2. Financial performance
- 9.2.14.3. Product benchmarking
- 9.2.14.4. Strategic initiatives
- 9.2.15. Somicon ME FZC
- 9.2.15.1. Company overview
- 9.2.15.2. Financial performance
- 9.2.15.3. Product benchmarking
- 9.2.15.4. Strategic initiatives
- 9.2.16. Green Water Treatment Solutions
- 9.2.16.1. Company overview
- 9.2.16.2. Financial performance
- 9.2.16.3. Product benchmarking
- 9.2.16.4. Strategic initiatives
- 9.2.17. Johnson Matthey
- 9.2.17.1. Company overview
- 9.2.17.2. Financial performance
- 9.2.17.3. Product benchmarking
- 9.2.17.4. Strategic initiatives
- 9.2.1. SUEZ

