|
|
市場調査レポート
商品コード
1321455
ヴィーガン食品の市場規模、シェア、動向分析レポート:製品別、流通チャネル別、地域別、セグメント予測、2023年~2030年Vegan Food Market Size, Share & Trends Analysis Report By Product (Meat & Seafood, Creamer, Ice Cream & Frozen Novelties, Yogurt, Cheese, Butter, Meals, Protein Bars, Others), By Distribution Channel, By Region, And Segment Forecasts, 2023 - 2030 |
||||||
|
|
|||||||
カスタマイズ可能
|
|||||||


| ヴィーガン食品の市場規模、シェア、動向分析レポート:製品別、流通チャネル別、地域別、セグメント予測、2023年~2030年 |
|
出版日: 2023年07月31日
発行: Grand View Research
ページ情報: 英文 80 Pages
納期: 2~10営業日
|

- 全表示
- 概要
- 図表
- 目次
ヴィーガン食品市場の成長と動向
Grand View Research, Inc.の最新レポートによると、世界のヴィーガン食品市場規模は2030年に375億米ドルに達すると予測され、2023年から2030年にかけて10.7%のCAGRで拡大すると予測されています。
動物虐待の増加に起因する植物性食品に対する消費者の嗜好の高まりと、ビーガン食の健康上の利点に関する認識が、業界の成長を促進すると予想される主な要因です。しかし、高価な製造工程に起因するヴィーガン食品の高価格は、成長の妨げになると予想されます。
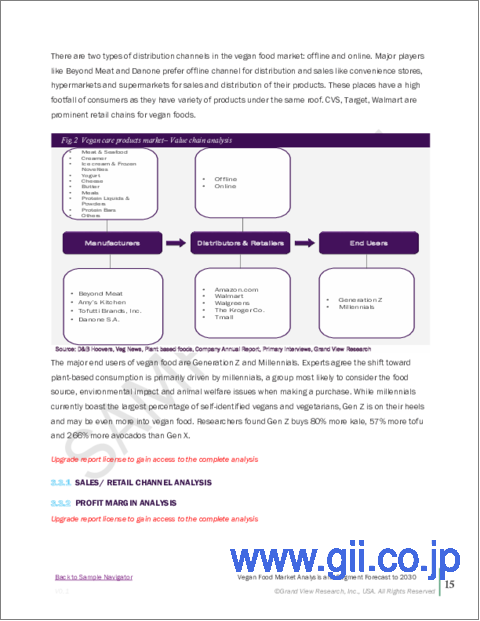
世界のヴィーガン食品産業の成長は、世界中でヴィーガニズムが拡大していることに支えられています。ヴィーガン食品は食物繊維が豊富であるため、新陳代謝の向上に役立ちます。その結果、その採用が増加し業界の成長を促進すると予想されています。さらに、先進国と新興国の両方で植物性食品を発売する主なプレーヤーによるイニシアティブの増加が、予測期間中の市場成長を促進しています。
肉・魚介類セグメントは予測期間中に最も速いCAGRを記録すると予想されます。新興諸国における植物ベースの肉の存在感の大きさと需要の高さが、このセグメントの成長を促進すると予想されます。様々な食肉カテゴリーが入手可能であることと、惣菜スライス、ミートボール、テンダー、チキンナゲットなどを含む幅広い植物性食肉製品が入手可能であることが相まって、成長を牽引しています。
オフラインの流通チャネルが市場をリードしており、市場推計・予測期間中も優位を保つと推定されます。高いシェアは、オフライン店舗が簡単にアクセスできることに起因しています。オフライン店舗では、さまざまなブランドの製品が一箇所で簡単に入手できるため、購入率が高くなります。さらに、コンビニエンスストア、スーパーマーケット、ハイパーマーケットなどのオフライン流通チャネルは、製品の実物を確認できる機能を提供しており、これがセグメントの成長をさらに促進すると予想されます。
北米は2022年に最大の収益シェアを占めました。ジェイク・ギレンホールやセリーナ・ウィリアムズなどの有名人によるヴィーガン食品採用に関するソーシャルメディア上のキャンペーンが増加していることが市場成長を促進しています。さらに、この地域では乳糖不耐症の人口が多いため、消費者の間で乳製品代替食品の需要と採用が増加していることも、成長に寄与する主な要因となっています。
ヴィーガン食品市場レポートハイライト
- アジア太平洋地域は、植物由来の食品に対する需要の高まりと消費者の健康意識の高まりにより、予測期間中に最も速いCAGRを記録すると予想されます。
- ヨーグルト分野は予測期間中2番目に高いCAGRで成長すると予測されます。ミレニアル世代における乳製品不使用製品への嗜好の高まりが、同分野の成長を牽引すると予想されます。
- ヴィーガンチーズ部門は、予測期間中に大幅なCAGRで拡大すると予測されます。乳糖不耐症の消費者によるビーガンチーズの消費の増加が、このセグメントの成長に寄与すると予想されます。
目次
第1章 調査手法と範囲
- 市場セグメンテーションと範囲
- 市場の定義
- 情報調達
- 情報分析
- 市場の形成とデータの視覚化
- データの検証と公開
第2章 エグゼクティブサマリー
第3章 ヴィーガン食品市場の変数、動向、範囲
- 市場系統の見通し
- 業界のバリューチェーン分析
- 原材料の見通し
- 製造と技術の展望
- 利益率分析
- 市場力学
- 市場促進要因の分析
- 市場抑制要因分析
- 市場機会
- 市場の課題
- 業界分析- ポーターのファイブフォース分析
- 市場参入戦略
第4章 消費者行動分析
- 人口動向分析
- 消費者の動向と好み
- 購入決定に影響を与える要因
- 消費者向け製品の採用
- 主な観察と調査結果
第5章 ヴィーガン食品市場:製品別の推定・動向分析
- 変動分析と市場シェア、2022年と2030年
- 肉・シーフード
- クリーマー
- アイスクリームと冷凍ノベルティ
- ヨーグルト
- チーズ
- バター
- ミール
- プロテインバー
- その他
第6章 ヴィーガン食品市場:流通チャネル別の推定・動向分析
- 流通チャネルの変動分析と市場シェア、2022年と2030年
- オンライン
- オフライン
第7章 ヴィーガン食品市場:地域別の推定・動向分析
- 変動分析と市場シェア、2022年と2030年
- 北米
- 市場推計・予測、2017~2030年
- 製品別、2017~2030年
- 流通チャネル別、2017~2030年
- 米国
- カナダ
- メキシコ
- 欧州
- 市場推計・予測、2017~2030年
- 製品別、2017~2030年
- 流通チャネル別、2017~2030年
- 英国
- ドイツ
- フランス
- イタリア
- スペイン
- アジア太平洋地域
- 市場推計・予測、2017~2030年
- 製品別、2017~2030年
- 流通チャネル別、2017~2030年
- 中国
- 日本
- インド
- 韓国
- オーストラリア
- 中南米
- 市場推計・予測、2017~2030年
- 製品別、2017~2030年
- 流通チャネル別、2017~2030年
- ブラジル
- 中東とアフリカ
- 市場推計・予測、2017~2030年
- 製品別、2017~2030年
- 流通チャネル別、2017~2030年
- 南アフリカ
第8章 競合分析
- 主要市場参入企業による最近の動向と影響分析
- 企業の分類
- 参入企業の概要
- 財務実績
- 製品のベンチマーク
- 企業の市場シェア分析、2022年(%)
- 企業ヒートマップ分析
- 戦略マッピング
- 主要企業のリスト
- Amy's Kitchen
- Danone SA
- Daiya Foods Inc.
- Beyond Meat
- Tofutti Brands Inc.
- Plamil Foods Ltd
- VBites Foods Limited
- Eden Foods Inc.
- VITASOY International Holdings Limited
- SunOpta
List of Tables
- Table 1 Vegan Food Market - Key Market Driver Analysis
- Table 2 Vegan Food Market - Key Market Restraint Analysis
- Table 3 Vegan food market estimates & forecast, by product (USD Billion)
- Table 4 Vegan food market estimates & forecast, by seg 2 (USD Billion)
- Table 5 Vegan food market estimates & forecast, by distribution channel (USD Billion)
- Table 6 U.S. macro-economic outlay
- Table 7 Canada macro-economic outlay
- Table 8 Mexico macro-economic outlay
- Table 9 Germany macro-economic outlay
- Table 10 U.K. macro-economic outlay
- Table 11 France macro-economic outlay
- Table 12 Italy macro-economic outlay
- Table 13 Spain macro-economic outlay
- Table 14 China macro-economic outlay
- Table 15 India macro-economic outlay
- Table 16 Japan macro-economic outlay
- Table 17 Australia macro-economic outlay
- Table 18 South Korea macro-economic outlay
- Table 19 Brazil macro-economic outlay
- Table 20 South Africa macro-economic outlay
- Table 21 Recent developments & impact analysis, by key market participants
- Table 22 Company market share, 2022
- Table 23 Company heat map analysis
List of Figures
- Fig. 1 Vegan food market segmentation
- Fig. 2 Information procurement
- Fig. 3 Primary research pattern
- Fig. 4 Primary research approaches
- Fig. 5 Primary research process
- Fig. 6 Market snapshot
- Fig. 7 Segment snapshot
- Fig. 8 Competitive landscape Snapshot
- Fig. 9 Global vegan food market size, 2017 to 2030 (USD Billion)
- Fig. 10 Vegan food market: Value chain analysis
- Fig. 11 Vegan food market: Profit-margin analysis
- Fig. 12 Vegan food market: Dynamics
- Fig. 13 Vegan food market: Porter's five forces analysis
- Fig. 14 Factors influencing buying decisions for vegan food
- Fig. 15 Vegan food market, by product: Key takeaways
- Fig. 16 Vegan food market, by product: Market share, 2022 & 2030
- Fig. 17 Meat & seafood market estimates & forecasts, 2017 - 2030 (USD Billion)
- Fig. 18 Creamer market estimates & forecasts, 2017 - 2030 (USD Billion)
- Fig. 19 Ice cream and frozen novelties market estimates & forecasts, 2017 - 2030 (USD Billion)
- Fig. 20 Yogurt market estimates & forecasts, 2017 - 2030 (USD Billion)
- Fig. 21 Cheese market estimates & forecasts, 2017 - 2030 (USD Billion)
- Fig. 22 Butter market estimates & forecasts, 2017 - 2030 (USD Billion)
- Fig. 23 Meals market estimates & forecasts, 2017 - 2030 (USD Billion)
- Fig. 24 Protein bars market estimates & forecasts, 2017 - 2030 (USD Billion)
- Fig. 25 Others market estimates & forecasts, 2017 - 2030 (USD Billion)
- Fig. 26 Vegan food market, by distribution channel: Key takeaways
- Fig. 27 Vegan food market, by distribution channel: Market share, 2022 & 2030
- Fig. 28 Vegan food market estimates & forecasts, through offline channel, 2017 - 2030 (USD Billion)
- Fig. 29 Vegan food market estimates & forecasts, through online channel, 2017 - 2030 (USD Billion)
- Fig. 30 Vegan food market revenue, by region, 2022 & 2030 (USD Billion)
- Fig. 31 Regional marketplace: Key takeaways
- Fig. 32 North America vegan food market estimates & forecast, 2017 - 2030 (USD Billion)
- Fig. 33 US vegan food market estimates & forecast, 2017 - 2030 (USD Billion)
- Fig. 34 Canada vegan food market estimates & forecast, 2017 - 2030 (USD Billion)
- Fig. 35 Mexico vegan food market estimates & forecast, 2017 - 2030 (USD Billion)
- Fig. 36 Europe vegan food market estimates & forecast, 2017 - 2030 (USD Billion)
- Fig. 37 Germany vegan food market estimates & forecast, 2017 - 2030 (USD Billion)
- Fig. 38 UK vegan food market estimates & forecast, 2017 - 2030 (USD Billion)
- Fig. 39 France vegan food market estimates & forecast, 2017 - 2030 (USD Billion)
- Fig. 40 Italy vegan food market estimates & forecast, 2017 - 2030 (USD Billion)
- Fig. 41 Spain vegan food market estimates & forecast, 2017 - 2030 (USD Billion)
- Fig. 42 Asia Pacific vegan food market estimates & forecast, 2017 - 2030 (USD Billion)
- Fig. 43 China vegan food market estimates & forecast, 2017 - 2030 (USD Billion)
- Fig. 44 India vegan food market estimates & forecast, 2017 - 2030 (USD Billion)
- Fig. 45 Japan vegan food market estimates & forecast, 2017 - 2030 (USD Billion)
- Fig. 46 South Korea vegan food market estimates & forecast, 2017 - 2030 (USD Billion)
- Fig. 47 Australia vegan food market estimates & forecast, 2017 - 2030 (USD Billion)
- Fig. 48 Middle East & Africa vegan food market estimates & forecast, 2017 - 2030 (USD Billion)
- Fig. 49 South Africa vegan food market estimates & forecast, 2017 - 2030 (USD Billion)
- Fig. 50 Central and South America vegan food market estimates & forecast, 2017 - 2030 (USD Billion)
- Fig. 51 Brazil vegan food market estimates & forecast, 2017 - 2030 (USD Billion)
- Fig. 52 Company market share analysis, 2022
- Fig. 53 Strategic framework of vegan food market
Vegan Food Market Growth & Trends
The global vegan food market size is expected to reach USD 37.5 billion in 2030 and is anticipated to expand at a CAGR of 10.7% from 2023 to 2030, according to a new report by Grand View Research, Inc. Rising consumer preference for plant-based food owing to the growing animal cruelty and awareness regarding the health benefits of a vegan diet are the major factors expected to drive the industry's growth. However, high prices of vegan foods owing to their expensive manufacturing process are anticipated to hamper the growth.
The growth of the global vegan food industry is supported by growing veganism across the globe. Vegan food helps improve metabolism as it is rich in fiber. This has resulted in its increasing adoption which is anticipated to fuel the growth of the industry. Moreover, increasing initiatives by key players to launch plant-based food in both developed and developing countries are fueling market growth during the forecast period.
The meat & seafood segment is expected to register the fastest CAGR during the forecast period. The significant presence and high demand for plant-based meat in developing countries are expected to drive the growth of the segment. The availability of a variety of meat categories coupled with the availability of a wide range of plant-based meat products including deli slices, meatballs, tenders, chicken nuggets, and others is driving the growth.
The offline distribution channel led the market and is estimated to continue dominating during the forecast period. The high share is attributed to the easy accessibility of offline stores. Products from different brands are easily available in one place in offline stores resulting in their higher purchase. Moreover, offline distribution channels such as convenience stores, supermarkets, hypermarkets, and others provide the facility of physical verification of the product, which is further expected to drive segment growth.
North America accounted for the largest revenue share in 2022. The growing number of campaigns on social media regarding vegan food adoption by celebrities such as Jake Gyllenhaal and Serena Williams is driving the market growth. Moreover, the increasing demand and adoption of dairy alternatives among consumers owing to the high presence of lactose intolerant population in the region is a key factor contributing to the growth.
Major industry players include Amy's Kitchen; Danone S.A; Daiya Foods Inc.; Beyond Meat; Tofutti Brands Inc.; Plamil Foods Ltd; VBites Foods Limited; Eden Foods Inc.; VITASOY International Holdings Limited; and SunOpta. Various steps are adopted by these companies including global expansion, partnerships, acquisitions & mergers, development & launch of new products, and others to gain a larger market share.
Vegan Food Market Report Highlights
- Asia Pacific is expected to register the fastest CAGR over the forecast period owing to the growing demand for plant-based food and rising health consciousness among consumers
- The yogurt segment is estimated to grow at the second highest CAGR over the forecast period. The rising preference for dairy-free products among millennials is expected to drive the segment's growth
- The vegan cheese segment is expected to expand at a significant CAGR over the forecast period. The increasing consumption of vegan cheese by lactose intolerant consumers is anticipated to contribute to the growth of the segment
Table of Contents
Chapter 1. Methodology and Scope
- 1.1. Market Segmentation & Scope
- 1.2. Market Definition
- 1.3. Information Procurement
- 1.3.1. Purchased Database
- 1.3.2. GVR's Internal Database
- 1.3.3. Secondary Sources & Third-Party Perspectives
- 1.3.4. Primary Research
- 1.4. Information Analysis
- 1.4.1. Data Analysis Models
- 1.5. Market Formulation & Data Visualization
- 1.6. Data Validation & Publishing
Chapter 2. Executive Summary
- 2.1. Market Outlook
- 2.2. Product Outlook
- 2.3. Distribution Channel Outlook
- 2.4. Regional Outlook
- 2.5. Competition Outlook
Chapter 3. Vegan Food Market Variables, Trends & Scope
- 3.1. Market Lineage Outlook
- 3.2. Industry Value Chain Analysis
- 3.2.1. Raw Material Outlook
- 3.2.2. Manufacturing and Technology Outlook
- 3.2.3. Profit Margin Analysis
- 3.3. Market Dynamics
- 3.3.1. Market Driver Analysis
- 3.3.2. Market Restraint Analysis
- 3.3.3. Market Opportunities
- 3.3.4. Market Challenges
- 3.4. Industry Analysis - Porter's Five Forces Analysis
- 3.5. Market Entry Strategies
Chapter 4. Consumer Behavior Analysis
- 4.1. Demographics Analysis
- 4.2. Consumer Trends and Preferences
- 4.3. Factors Affecting Buying Decision
- 4.4. Consumer Product Adoption
- 4.5. Key Observations & Findings
Chapter 5. Vegan Food Market: Product Estimates & Trend Analysis
- 5.1. Product Movement Analysis & Market Share, 2022 & 2030
- 5.2. Meat & Seafood
- 5.2.1. Meat & seafood market estimates and forecast, 2017 - 2030 (USD Billion)
- 5.3. Creamer
- 5.3.1. Creamer market estimates and forecast, 2017 - 2030 (USD Billion)
- 5.4. Ice Cream and Frozen Novelties
- 5.4.1. Ice cream and frozen novelties market estimates and forecast, 2017 - 2030 (USD Billion)
- 5.5. Yogurt
- 5.5.1. Yogurt market estimates and forecast, 2017 - 2030 (USD Billion)
- 5.6. Cheese
- 5.6.1. Cheese market estimates and forecast, 2017 - 2030 (USD Billion)
- 5.7. Butter
- 5.7.1. Butter market estimates and forecast, 2017 - 2030 (USD Billion)
- 5.8. Meals
- 5.8.1. Meals market estimates and forecast, 2017 - 2030 (USD Billion)
- 5.9. Protein Bars
- 5.9.1. Protein bars market estimates and forecast, 2017 - 2030 (USD Billion)
- 5.10. Others
- 5.10.1. Others market estimates and forecast, 2017 - 2030 (USD Billion)
Chapter 6. Vegan Food Market: Distribution Channel Estimates & Trend Analysis
- 6.1. Distribution Channel Movement Analysis & Market Share, 2022 & 2030
- 6.2. Online
- 6.2.1. Vegan food market estimates and forecast through online distribution channel, 2017 - 2030 (USD Billion)
- 6.3. Offline
- 6.3.1. Vegan food market estimates and forecast through offline distribution channel, 2017 - 2030 (USD Billion)
Chapter 7. Vegan Food Market: Regional Estimates & Trend Analysis
- 7.1. Regional Movement Analysis & Market Share, 2022 & 2030
- 7.2. North America
- 7.2.1. Market estimates and forecast, 2017 - 2030 (USD Billion)
- 7.2.2. Market estimates and forecast, by product, 2017 - 2030 (USD Billion)
- 7.2.3. Market estimates and forecast, by distribution channel, 2017 - 2030 (USD Billion)
- 7.2.4. U.S.
- 7.2.4.1. Market estimates and forecast, 2017 - 2030 (USD Billion)
- 7.2.4.2. Market estimates and forecast, by product, 2017 - 2030 (USD Billion)
- 7.2.4.3. Market estimates and forecast, by distribution channel, 2017 - 2030 (USD Billion)
- 7.2.5. Canada
- 7.2.5.1. Market estimates and forecast, 2017 - 2030 (USD Billion)
- 7.2.5.2. Market estimates and forecast, by product, 2017 - 2030 (USD Billion)
- 7.2.5.3. Market estimates and forecast, by distribution channel, 2017 - 2030 (USD Billion)
- 7.2.6. Mexico
- 7.2.6.1. Market estimates and forecast, 2017 - 2030 (USD Billion)
- 7.2.6.2. Market estimates and forecast, by product, 2017 - 2030 (USD Billion)
- 7.2.6.3. Market estimates and forecast, by distribution channel, 2017 - 2030 (USD Billion)
- 7.3. Europe
- 7.3.1. Market estimates and forecast, 2017 - 2030 (USD Billion)
- 7.3.2. Market estimates and forecast, by product, 2017 - 2030 (USD Billion)
- 7.3.3. Market estimates and forecast, by distribution channel, 2017 - 2030 (USD Billion)
- 7.3.4. U.K.
- 7.3.4.1. Market estimates and forecast, 2017 - 2030 (USD Billion)
- 7.3.4.2. Market estimates and forecast, by product, 2017 - 2030 (USD Billion)
- 7.3.4.3. Market estimates and forecast, by distribution channel, 2017 - 2030 (USD Billion)
- 7.3.5. Germany
- 7.3.5.1. Market estimates and forecast, 2017 - 2030 (USD Billion)
- 7.3.5.2. Market estimates and forecast, by product, 2017 - 2030 (USD Billion)
- 7.3.5.3. Market estimates and forecast, by distribution channel, 2017 - 2030 (USD Billion)
- 7.3.6. France
- 7.3.6.1. Market estimates and forecast, 2017 - 2030 (USD Billion)
- 7.3.6.2. Market estimates and forecast, by product, 2017 - 2030 (USD Billion)
- 7.3.6.3. Market estimates and forecast, by distribution channel, 2017 - 2030 (USD Billion)
- 7.3.7. Italy
- 7.3.7.1. Market estimates and forecast, 2017 - 2030 (USD Billion)
- 7.3.7.2. Market estimates and forecast, by product, 2017 - 2030 (USD Billion)
- 7.3.7.3. Market estimates and forecast, by distribution channel, 2017 - 2030 (USD Billion)
- 7.3.8. Spain
- 7.3.8.1. Market estimates and forecast, 2017 - 2030 (USD Billion)
- 7.3.8.2. Market estimates and forecast, by product, 2017 - 2030 (USD Billion)
- 7.3.8.3. Market estimates and forecast, by distribution channel, 2017 - 2030 (USD Billion)
- 7.4. Asia Pacific
- 7.4.1. Market estimates and forecast, 2017 - 2030 (USD Billion)
- 7.4.2. Market estimates and forecast, by product, 2017 - 2030 (USD Billion)
- 7.4.3. Market estimates and forecast, by distribution channel, 2017 - 2030 (USD Billion)
- 7.4.4. China
- 7.4.4.1. Market estimates and forecast, 2017 - 2030 (USD Billion)
- 7.4.4.2. Market estimates and forecast, by product, 2017 - 2030 (USD Billion)
- 7.4.4.3. Market estimates and forecast, by distribution channel, 2017 - 2030 (USD Billion)
- 7.4.5. Japan
- 7.4.5.1. Market estimates and forecast, 2017 - 2030 (USD Billion)
- 7.4.5.2. Market estimates and forecast, by product, 2017 - 2030 (USD Billion)
- 7.4.5.3. Market estimates and forecast, by distribution channel, 2017 - 2030 (USD Billion)
- 7.4.6. India
- 7.4.6.1. Market estimates and forecast, 2017 - 2030 (USD Billion)
- 7.4.6.2. Market estimates and forecast, by product, 2017 - 2030 (USD Billion)
- 7.4.6.3. Market estimates and forecast, by distribution channel, 2017 - 2030 (USD Billion)
- 7.4.7. South Korea
- 7.4.7.1. Market estimates and forecast, 2017 - 2030 (USD Billion)
- 7.4.7.2. Market estimates and forecast, by product, 2017 - 2030 (USD Billion)
- 7.4.7.3. Market estimates and forecast, by distribution channel, 2017 - 2030 (USD Billion)
- 7.4.8. Australia
- 7.4.8.1. Market estimates and forecast, 2017 - 2030 (USD Billion)
- 7.4.8.2. Market estimates and forecast, by product, 2017 - 2030 (USD Billion)
- 7.4.8.3. Market estimates and forecast, by distribution channel, 2017 - 2030 (USD Billion)
- 7.5. Central & South America
- 7.5.1. Market estimates and forecast, 2017 - 2030 (USD Billion)
- 7.5.2. Market estimates and forecast, by product, 2017 - 2030 (USD Billion)
- 7.5.3. Market estimates and forecast, by distribution channel, 2017 - 2030 (USD Billion)
- 7.5.4. Brazil
- 7.5.4.1. Market estimates and forecast, 2017 - 2030 (USD Billion)
- 7.5.4.2. Market estimates and forecast, by product, 2017 - 2030 (USD Billion)
- 7.5.4.3. Market estimates and forecast, by distribution channel, 2017 - 2030 (USD Billion)
- 7.6. Middle East & Africa
- 7.6.1. Market estimates and forecast, 2017 - 2030 (USD Billion)
- 7.6.2. Market estimates and forecast, by product, 2017 - 2030 (USD Billion)
- 7.6.3. Market estimates and forecast, by distribution channel, 2017 - 2030 (USD Billion)
- 7.6.4. South Africa
- 7.6.4.1. Market estimates and forecast, 2017 - 2030 (USD Billion)
- 7.6.4.2. Market estimates and forecast, by product, 2017 - 2030 (USD Billion)
- 7.6.4.3. Market estimates and forecast, by distribution channel, 2017 - 2030 (USD Billion)
Chapter 8. Competitive Analysis
- 8.1. Recent developments & impact analysis, by key market participants
- 8.2. Company Categorization
- 8.3. Participant's Overview
- 8.4. Financial Performance
- 8.5. Product Benchmarking
- 8.6. Company Market Share Analysis, 2022 (%)
- 8.7. Company Heat Map Analysis
- 8.8. Strategy Mapping
- 8.9. List of key companies analyzed in this section include:
- 8.9.1. Amy's Kitchen
- 8.9.2. Danone S.A
- 8.9.3. Daiya Foods Inc.
- 8.9.4. Beyond Meat
- 8.9.5. Tofutti Brands Inc.
- 8.9.6. Plamil Foods Ltd
- 8.9.7. VBites Foods Limited
- 8.9.8. Eden Foods Inc.
- 8.9.9. VITASOY International Holdings Limited
- 8.9.10. SunOpta
