|
|
市場調査レポート
商品コード
1301263
バーチャルコンテンツ制作の市場規模、シェア、動向分析レポート:コンテンツタイプ別、ソリューションタイプ別、最終用途別、地域別、セグメント予測:2023年~2030年Virtual Content Creation Market Size, Share & Trends Analysis Report By Content Type (Videos, Games), By Solution Type (Software, Services), By End-use (Retail, Gaming), By Region, And Segment Forecasts, 2023 - 2030 |
||||||
|
|
|||||||
カスタマイズ可能
|
|||||||


| バーチャルコンテンツ制作の市場規模、シェア、動向分析レポート:コンテンツタイプ別、ソリューションタイプ別、最終用途別、地域別、セグメント予測:2023年~2030年 |
|
出版日: 2023年06月16日
発行: Grand View Research
ページ情報: 英文 174 Pages
納期: 2~10営業日
|

- 全表示
- 概要
- 図表
- 目次
バーチャルコンテンツ制作市場の成長と動向
Grand View Research, Inc.の最新レポートによると、世界のバーチャルコンテンツ制作の市場規模は、2023年から2030年にかけて25.7%のCAGRを記録し、2030年には254億9,000万米ドルに達すると予測されています。
個人の間でバーチャルリアリティ(VR)コンテンツやビデオゲームに対する需要が高まっているのは、VR技術が製品に統合され、エンドユーザーにより没入型の体験が提供されるためです。また、エンターテインメントやゲーム部門において、コスト効率が高く実用的なVRデバイスが容易に入手できるようになったことも、予測期間中の市場成長を促進すると予想されます。さらに、クラウドベースのバーチャルコンテンツ制作ツールの台頭により、コンテンツ制作者や企業がバーチャルコンテンツを制作することがより簡単かつコスト効率良くできるようになりました。
これにより、新しいコンテンツ制作者の参入障壁が下がり、市場の成長を後押ししています。さらに、バーチャルコンテンツ制作者は、多数のデバイスやプラットフォームが利用可能であることから、複数のプラットフォームで楽しんだりアクセスしたりできるコンテンツの制作を検討しており、これも成長を促進する要因となっています。複数の企業が、より広範な顧客層を獲得し、業界における足場を固めるため、新製品や新サービスの立ち上げに注力しています。例えば、VR・ARエンターテインメント企業のXR Immersive Tech Inc.は2022年12月、ヘルスケア、小売、ゲーム、エンターテインメントなど複数の部門で利用できるVRハードウェアKiosk「PortalX」を発売しました。これにより、予測期間中の市場成長が促進されると期待されています。
バーチャルコンテンツ制作市場レポートハイライト
- コンテンツタイプ別では、様々なデバイスでVR動画が消費される動向から、動画セグメントが2022年に約35%の大きな市場シェアを占めています。
- ソリューションタイプ別では、VRヘッドセット製品向けのカスタムVRソフトウェアの需要が高まっていることから、ソフトウェアセグメントが2022年に最大の市場シェアを占めました。
- 最終用途別では、メディア・エンターテインメントセグメントが、VRコンテンツと手頃な価格のVRヘッドセットの増加により、2023年から2030年にかけて25%以上の大幅なCAGRで成長すると予想されています。
- 北米は技術普及率が高いため、2022年の収益シェアは約30%と最大を占めています。
目次
第1章 調査手法と範囲
- 市場セグメンテーションと範囲
- 市場の定義
- 情報調達
- 情報分析
- 市場の形成とデータの視覚化
- データの検証と公開
- 調査範囲と前提条件
- データソースのリスト
第2章 エグゼクティブサマリー
- 市場スナップショット
- セグメントのスナップショット
- 競合情勢のスナップショット
第3章 市場変数、動向、範囲
- 市場系統の見通し
- 業界のバリューチェーン分析
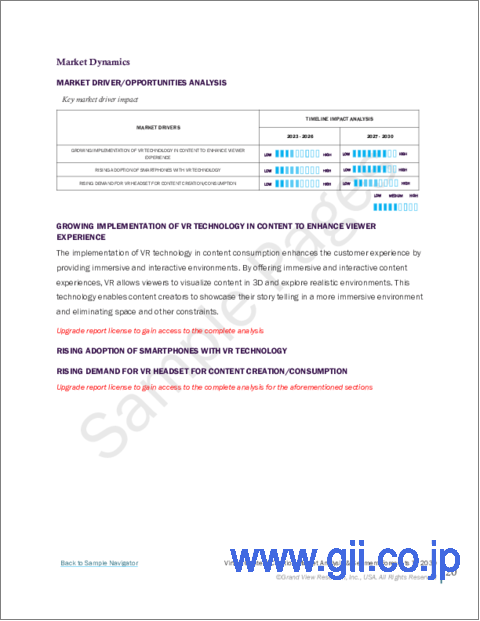
- 市場力学
- 市場促進要因分析
- 市場抑制要因分析
- 市場の課題
- 市場機会
- 業界分析ツール
- ポーターの分析
- マクロ経済分析
第4章 コンテンツタイプの推定・動向分析
- コンテンツタイプの変動分析と市場シェア、2022年と2030年
- コンテンツタイプ別
- 動画
- 360度写真
- ゲーム
第5章 ソリューションタイプの推定・動向分析
- ソリューションタイプの変動分析と市場シェア、2022年と2030年
- ソリューションタイプ別
- ソフトウェア
- サービス
第6章 最終用途の推定・動向分析
- 最終用途の変動分析と市場シェア、2022年と2030年
- 最終用途別
- 自動車
- メディア・エンターテインメント
- 旅行・ホスピタリティ
- 不動産
- 小売
- ゲーム
- ヘルスケア
- その他
第7章 地域の推定・動向分析
- バーチャルコンテンツ制作市場、地域別、2022年と2030年
- 北米
- 米国
- カナダ
- 欧州
- フランス
- 英国
- ドイツ
- イタリア
- スペイン
- アジア太平洋地域
- 日本
- 中国
- インド
- 韓国
- ラテンアメリカ
- ブラジル
- メキシコ
- 中東・アフリカ
- サウジアラビア
- 南アフリカ
第8章 バーチャルコンテンツ制作市場-競合情勢
- 主要な市場参入企業
- Matterport, Inc.
- WeVR
- Vizor
- Koncept VR LLC
- Porcellus, Inc.
- 360 Labs
- Blippar Group Limited
- Panedia Pty Ltd
- Scapic Innovation Private Limited(Flipkart)
- Subvrsive, Inc.
- VIAR Inc.
- WeMakeVR
- 最近の開発と影響分析:主要市場参入企業別
- 企業の分類
- 参入企業の概要
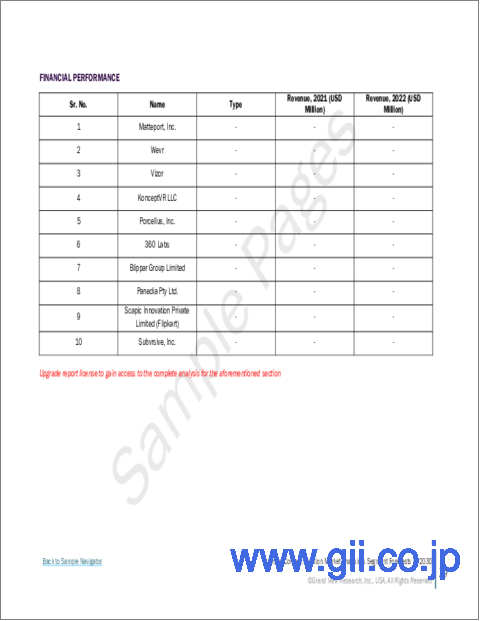
- 財務実績
- 製品のベンチマーク
- 企業ヒートマップ分析
- 主要企業の市場シェア分析、2022年
- 戦略マッピング
- パートナーシップ
- 合併と買収
- 新製品/新機能の発表
- 拡張
List of Tables
- Table 1 Key market driver impact
- Table 2 Key market restraint impact
- Table 3 Global virtual content creation market revenue estimates and forecast, by content type, 2018 - 2030 (USD Million)
- Table 4 Global virtual content creation market revenue estimates and forecast, by solution type, 2018 - 2030 (USD Million)
- Table 5 Global virtual content creation market revenue estimates and forecast, by end use, 2018 - 2030 (USD Million)
- Table 6 Company heat map analysis
List of Figures
- Fig. 1 Virtual content creation market segmentation
- Fig. 2 Information procurement
- Fig. 3 Data analysis models
- Fig. 4 Market formulation and validation
- Fig. 5 Data validating & publishing
- Fig. 6 Market snapshot
- Fig. 7 Segment snapshot
- Fig. 8 Industry snapshot
- Fig. 9 Value chain analysis
- Fig. 10 Market dynamics
- Fig. 11 Virtual content creation market: Porter's analysis
- Fig. 12 Virtual content creation market: PESTEL analysis
- Fig. 13 Virtual content creation market, by content type, key takeaways, 2018 - 2030 Revenue (USD Million)
- Fig. 14 Virtual content creation market, by content type: market share, 2022 & 2030
- Fig. 15 Videos market estimates & forecasts, 2018 - 2030 (USD Million)
- Fig. 16 360-degree Photos market estimates & forecasts, 2018 - 2030 (USD Million)
- Fig. 17 Games market estimates & forecasts, 2018 - 2030 (USD Million)
- Fig. 18 Virtual content creation market, by solution type, key takeaways, 2018 - 2030 Revenue (USD Million)
- Fig. 19 Virtual content creation market, by solution type: market share, 2022 & 2030
- Fig. 20 Software market estimates & forecasts, 2018 - 2030 (USD Million)
- Fig. 21 Services market estimates & forecasts, 2018 - 2030 (USD Million)
- Fig. 22 Virtual content creation market, by end use, key takeaways, 2018 - 2030 Revenue (USD Million)
- Fig. 23 Virtual content creation market, by end use: market share, 2022 & 2030
- Fig. 24 Automotive market estimates & forecasts, 2018 - 2030 (USD Million)
- Fig. 25 Media & entertainment market estimates & forecasts, 2018 - 2030 (USD Million)
- Fig. 26 Travel & hospitality market estimates & forecasts, 2018 - 2030 (USD Million)
- Fig. 27 Real estate market estimates & forecasts, 2018 - 2030 (USD Million)
- Fig. 28 Retail market estimates & forecasts, 2018 - 2030 (USD Million)
- Fig. 29 Gaming market estimates & forecasts, 2018 - 2030 (USD Million)
- Fig. 30 Healthcare market estimates & forecasts, 2018 - 2030 (USD Million)
- Fig. 31 Others market estimates & forecasts, 2018 - 2030 (USD Million)
- Fig. 32 Virtual content creation market by region, 2022 & 2030 Revenue (USD Million)
- Fig. 33 Regional marketplace: Key takeaways
- Fig. 34 Regional marketplace: Key takeaways
- Fig. 35 North America virtual content creation market estimates & forecast, 2018 - 2030 (USD Millions)
- Fig. 36 U.S. virtual content creation market estimates & forecast, 2018 - 2030 (USD Million)
- Fig. 37 Canada virtual content creation market estimates & forecast, 2018 - 2030 (USD Million)
- Fig. 38 Europe virtual content creation market estimates & forecast, 2018 - 2030 (USD Million)
- Fig. 39 France virtual content creation market estimates & forecast, 2018 - 2030 (USD Million)
- Fig. 40 UK virtual content creation market estimates & forecast, 2018 - 2030 (USD Million)
- Fig. 41 Germany virtual content creation market estimates & forecast, 2018 - 2030 (USD Million)
- Fig. 42 Italy virtual content creation market estimates & forecast, 2018 - 2030 (USD Million)
- Fig. 43 Spain virtual content creation market estimates & forecast, 2018 - 2030 (USD Million)
- Fig. 44 Asia Pacific virtual content creation market estimates & forecast, 2018 - 2030 (USD Million)
- Fig. 45 Japan virtual content creation market estimates & forecast, 2018 - 2030 (USD Million)
- Fig. 46 China virtual content creation market estimates & forecast, 2018 - 2030 (USD Million)
- Fig. 47 India virtual content creation market estimates & forecast, 2018 - 2030 (USD Million)
- Fig. 48 South Korea virtual content creation market estimates & forecast, 2018 - 2030 (USD Million)
- Fig. 49 Latin America virtual content creation market estimates & forecast, 2018 - 2030 (USD Million)
- Fig. 50 Brazil virtual content creation market estimates & forecast, 2018 - 2030 (USD Million)
- Fig. 51 Mexico virtual content creation market estimates & forecast, 2018 - 2030 (USD Million)
- Fig. 52 MEA virtual content creation market estimates & forecast, 2018 - 2030 (USD Million)
- Fig. 53 South Africa virtual content creation market estimates & forecast, 2018 - 2030 (USD Million)
- Fig. 54 Saudi Arabia virtual content creation market estimates & forecast, 2018 - 2030 (USD Million)
- Fig. 55 Key company categorization
- Fig. 56 Key company market share analysis, 2022
- Fig. 57 Strategy framework
Virtual Content Creation Market Growth & Trends
The global virtual content creation market size is anticipated to reach USD 25.49 billion by 2030, registering a CAGR of 25.7% from 2023 to 2030, according to a recent report by Grand View Research, Inc. The growing demand for Virtual Reality (VR) content and video games among individuals is attributed to the integration of VRtechnologies into the products as it offers a more immersive experience to end-users. In addition, the easy accessibility of cost-efficient and practical VR devices in the entertainment and gaming sector is expected to drive market growth over the forecast period.Moreover, the rise in cloud-based virtual content creation tools is making it easier and more cost-effective for content creators and businesses to produce virtual content.
This is augmenting the growth of the market by lowering the entry barriers for new content creators. Furthermore, virtual content creators are considering creating content that can be enjoyed and accessed across multiple platforms owing to the availability of numerous devices and platforms, which isanothergrowth-driving factor. Several companies focus on launching new products and offerings to attract a more extensive customer base and strengthen their foothold in the industry. For instance, in December 2022, XR Immersive Tech Inc., a VR and AR entertainment company, launched PortalX, a VR hardware Kiosk that can be used for several sectors, such as healthcare, retail, gaming, and entertainment, among others. This, in turn, is expected to propel market growth during the forecast period.
Virtual Content Creation Market Report Highlights
- Based on content type, the videos segment accounted for a significant market share of around 35% in 2022 as a result of the trend of VR video consumption across various devices
- Based on solution type, the software segment accounted for the largest market share in 2022 due to the growing demand for custom VR software for VR headset products
- The media & entertainment end-use segment is expected to grow at a significant CAGR of over 25% from 2023 to 2030 as a result of the growing VR content and affordable VR headsets
- North America accounted for the largest revenue share of around 30% in 2022 due to a high level of technology penetration in the region
Table of Contents
Chapter 1 Methodology and Scope
- 1.1 Market Segmentation & Scope
- 1.2 Market Definitions
- 1.3 Information Procurement
- 1.3.1 Information Analysis
- 1.3.2 Market Formulation & Data Visualization
- 1.3.3 Data Validation & Publishing
- 1.4 Research Scope and Assumptions
- 1.4.1 List of Data Sources
Chapter 2 Executive Summary
- 2.1 Market Snapshot
- 2.2 Segment Snapshot
- 2.3 Competitive Landscape Snapshot
Chapter 3 Market Variables, Trends & Scope
- 3.1 Market Lineage Outlook
- 3.2 Industry Value Chain Analysis
- 3.3 Market Dynamics
- 3.3.1 Market Driver Analysis
- 3.3.2 Market Restraint Analysis
- 3.3.3 Market Challenges
- 3.3.4 Market Opportunities
- 3.4 Industry Analysis Tools
- 3.4.1 Porter's Analysis
- 3.4.2 Macroeconomic Analysis
Chapter 4 Content Type Estimates & Trend Analysis
- 4.1 Content Type Movement Analysis & Market Share, 2022 & 2030
- 4.2 Virtual Content Creation Market Estimates & Forecast, By Content Type (USD Million)
- 4.2.1 Videos
- 4.2.1.1 360-degree
- 4.2.1.2 Immersive
- 4.2.2 360 Degree Photos
- 4.2.3 Games
- 4.2.1 Videos
Chapter 5 Solution Type Estimates & Trend Analysis
- 5.1 Solution Type Movement Analysis & Market Share, 2022 & 2030
- 5.2 Virtual Content Creation Market Estimates & Forecast, By Solution Type (USD Million)
- 5.2.1 Software
- 5.2.2 Services
Chapter 6 End-Use Channel Estimates & Trend Analysis
- 6.1 End Use Movement Analysis & Market Share, 2022 & 2030
- 6.2 Virtual Content Creation Market Estimates & Forecast, By End Use (USD Million)
- 6.2.1 Automotive
- 6.2.2 Media & Entertainment
- 6.2.3 Travel & Hospitality
- 6.2.4 Real State
- 6.2.5 Retail
- 6.2.6 Gaming
- 6.2.7 Healthcare
- 6.2.8 Others
Chapter 7 Regional Estimates & Trend Analysis
- 7.1 Virtual Content Creation Market by Region, 2022 & 2030
- 7.2 North America
- 7.2.1 North America Virtual Content Creation Market Estimates & Forecasts, 2018 - 2030 (USD Millions)
- 7.2.2 U.S.
- 7.2.2.1 U.S. Virtual Content Creation Market Estimates & Forecasts, 2018 - 2030 (USD Million)
- 7.2.3 Canada
- 7.2.3.1 Canada Virtual Content Creation Market Estimates & Forecasts, 2018 - 2030 (USD Million)
- 7.3 Europe
- 7.3.1 Europe Virtual Content Creation Market Estimates & Forecasts, 2018 - 2030 (USD Million)
- 7.3.2 France
- 7.3.2.1 France Virtual Content Creation Market Estimates & Forecasts, 2018 - 2030 (USD Million)
- 7.3.3 UK
- 7.3.3.1 UK Virtual Content Creation Market Estimates & Forecasts, 2018 - 2030 (USD Million)
- 7.3.4 Germany
- 7.3.4.1 Germany Virtual Content Creation Market Estimates & Forecasts, 2018 - 2030 (USD Million)
- 7.3.5 Italy
- 7.3.5.1 Italy Virtual Content Creation Market Estimates & Forecasts, 2018 - 2030 (USD Million)
- 7.3.6 Spain
- 7.3.5.1 Spain Virtual Content Creation Market Estimates & Forecasts, 2018 - 2030 (USD Million)
- 7.4 Asia Pacific
- 7.4.1 Asia Pacific Virtual Content Creation Market Estimates & Forecasts, 2018 - 2030 (USD Million)
- 7.4.2 Japan
- 7.4.2.1 Japan Virtual Content Creation Market Estimates & Forecasts, 2018 - 2030 (USD Million)
- 7.4.3 China
- 7.4.3.1 China Virtual Content Creation Market Estimates & Forecasts, 2018 - 2030 (USD Million)
- 7.4.4 India
- 7.4.4.1 India Virtual Content Creation Market Estimates & Forecasts, 2018 - 2030 (USD Million)
- 7.4.5 South Korea
- 7.4.5.1 South Kore Virtual Content Creation Market Estimates & Forecasts, 2018 - 2030 (USD Million)
- 7.5 Latin America
- 7.5.1 Latin America Virtual Content Creation Market Estimates & Forecasts, 2018 - 2030 (USD Million)
- 7.5.2 Brazil
- 7.5.2.1 Brazil Virtual Content Creation Market Estimates & Forecasts, 2018 - 2030 (USD Million)
- 7.5.3 Mexico
- 7.5.3.1 Mexico Virtual Content Creation Market Estimates & Forecasts, 2018 - 2030 (USD Million)
- 7.6 Middle East & Africa (MEA)
- 7.6.1 MEA Anime Merchandise Market Estimates & Forecasts, 2018 - 2030 (USD Millions)
- 7.6.2 Saudi Arabia
- 7.6.2.1 Saudi Arabia Virtual Content Creation Market Estimates & Forecasts, 2018 - 2030 (USD Million)
- 7.6.3 South Africa
- 7.6.3.1 South Africa Virtual Content Creation Market Estimates & Forecasts, 2018 - 2030 (USD Million)
Chapter 8 Virtual Content Creation Market - Competitive Landscape
- 8.1 Key Market Participants
- 8.1.1 Matterport, Inc.
- 8.1.2 WeVR
- 8.1.3 Vizor
- 8.1.4 Koncept VR LLC
- 8.1.5 Porcellus, Inc.
- 8.1.6 360 Labs
- 8.1.7 Blippar Group Limited
- 8.1.8 Panedia Pty Ltd
- 8.1.9 Scapic Innovation Private Limited (Flipkart)
- 8.1.10 Subvrsive, Inc.
- 8.1.11 VIAR Inc.
- 8.1.12 WeMakeVR
- 8.2 Recent Development & Impact Analysis, By Key Market Participants
- 8.3 Company Categorization
- 8.4 Participant's Overview
- 8.5 Financial Performance
- 8.6 Product Benchmarking
- 8.7 Company Heat Map Analysis
- 8.8 Key Company Market Share Analysis, 2022
- 8.9 Strategy Mapping
- 8.9.1 Partnership
- 8.9.2 Merger & Acquisition
- 8.9.3 New Product/Feature Launch
- 8.9.4 Expansion