|
|
市場調査レポート
商品コード
1301186
カーボンクレジットの市場規模、シェア、動向分析レポート:タイプ別、プロジェクトタイプ別、最終用途別、地域別、セグメント別予測、2023年~2030年Carbon Credit Market Size, Share & Trends Analysis Report By Type (Compliance, Voluntary), By Project Type (Avoidance/Reduction Projects, Removal/Sequestration Projects), By End-use, By Region, And Segment Forecasts, 2023 - 2030 |
||||||
|
|
|||||||
|
● お客様のご希望に応じて、既存データの加工や未掲載情報(例:国別セグメント)の追加などの対応が可能です。 詳細はお問い合わせください。 |
|||||||


| カーボンクレジットの市場規模、シェア、動向分析レポート:タイプ別、プロジェクトタイプ別、最終用途別、地域別、セグメント別予測、2023年~2030年 |
|
出版日: 2023年06月02日
発行: Grand View Research
ページ情報: 英文 120 Pages
納期: 2~10営業日
|
- 全表示
- 概要
- 図表
- 目次
カーボンクレジット市場の成長と動向
GrandView Research, Inc.の最新レポートによると、世界のカーボンクレジット市場規模は2030年までに4兆7,343億5,000万米ドルに達する見込みです。
同市場は、予測期間中に38.7%という有利なCAGRで拡大すると予測されています。カーボンクレジットの需要は、温室効果ガスの排出削減を目的とした政策と政策を導入する政府など、様々な要因により近年大幅に増加しています。
カーボンクレジットの大きな需要は、企業が持続可能性の重要性を認識するようになり、企業の社会的責任イニシアチブの一環として二酸化炭素排出量を削減することに助けられています。このため、カーボンクレジットは、企業が排出量を相殺するために不可欠なものとなっています。さらに、気候変動とその潜在的な影響に対する懸念の高まりも、カーボンクレジットの分野に強い牽引力を生み出しています。
世界中の政府は、温室効果ガスの排出を削減し、気候変動と闘うための政策と政策を実施しています。こうした規制の多くは、カーボンクレジットを購入することで排出量を相殺することを企業に求めています。このような要因により、コンプライアンス分野のカーボンクレジット市場は世界的に拡大すると予想されます。
2022年のカーボンクレジットの世界市場では、コンプライアンスが98.91%の収益シェアで支配的なセグメントでした。コンプライアンスカーボンクレジット市場とは、政府または特定の当局によって規制されている企業や組織が、カーボンクレジットを購入することによって炭素排出量を相殺することを要求される市場を指します。これらのクレジットは、再生可能エネルギーやエネルギー効率化の取り組みなど、承認されたプロジェクトによる温室効果ガス排出量の削減を表します。
COVID-19の大流行は、エンドユーザーによる運用コストの削減を含むいくつかの要因に加え、製造活動の停滞や物流の問題により、世界中でスペアパーツの入手に大きな支障をきたしたため、カーボンクレジット市場の発展にとって大きな抑制要因となっています。
カーボンクレジット市場レポートハイライト
- 2022年には、コンプライアンスが最大のタイプセグメントとして浮上し、収益シェアの98.91%を占めました。政府別規制政策によるいくつかの利点が市場の成長を支えています。
- 2022年、カーボンクレジットの世界市場において、回避/削減プロジェクト分野が66.88%の最大シェアを占めました。カーボン・オフセットを必要とする再生可能エネルギー・プロジェクトの増加は、予測期間中の市場成長を増大させると予想されます。
- 米国は2022年に北米最大のカーボンクレジット市場に浮上しました。同国のカーボンクレジット市場は、主に州レベルのプログラムと自主的な市場の組み合わせ別牽引されています。
- 欧州では、英国が2022年に38.43%のシェアを占め、カーボンクレジット市場の収益創出という点で最大の国に浮上しました。排出権取引制度の積極的な拡大に向けた政府の政策と枠組みが、地域の成長を促進しています。
- 2022年のカーボンクレジットの世界市場は、最終用途部門の電力部門が31.01%のシェアを占めました。電力部門への投資の増加と、取引プラットフォームを強化するための炭素の回収が、予測期間中の同部門の成長をさらに後押しします。
目次
第1章 調査手法と範囲
- 市場セグメンテーションと範囲
- 情報調達
- 購入したデータベース
- GVRの内部データベース
- 二次型
- 第三者の視点
- 1次調査
- 情報分析
- データ分析モデル
- 市場の形成とデータの可視化
- データの検証と公開
第2章 エグゼクティブサマリー
- 市場スナップショット
- セグメントのスナップショット
- 競合情勢のスナップショット
第3章 市場変数、動向、および範囲
- 普及と成長の見通しマッピング
- 業界のバリューチェーン分析
- 市場動向
- 技術動向
- 市場力学
- 市場促進要因の影響分析
- 市場抑制の影響分析
- 業界の課題
- 業界のチャンス
- 規制の枠組み
- 欧州連合(EU)の規制
- 米国の規制
- インドの規制
- ビジネス環境分析:カーボンクレジット市場
- 業界分析- ポーターのファイブフォース
- PESTEL分析
第4章 カーボンクレジット市場:タイプ推定・動向分析
- タイプの変動分析と市場シェア、2022年と2030年
- タイプ別
- コンプライアンス
- 自主的
第5章 カーボンクレジット市場:プロジェクトタイプの推定・動向分析
- プロジェクトタイプの変動分析と市場シェア、2022年と2030年
- プロジェクトタイプ別
- 回避・削減プロジェクト
- 撤去・隔離プロジェクト
第6章 カーボンクレジット市場:最終用途の推定・動向分析
- 最終用途の変動分析と市場シェア、2022年と2030年
- 最終用途別
- 電力
- エネルギー
- 航空
- 輸送機関
- 建物
- 産業
- その他
第7章 カーボンクレジット市場:地域推定・動向分析
- カーボンクレジット市場:地域別の見通し
- 北米
- 北米カーボンクレジット市場の推定と予測、2018~2030年
- 米国
- カナダ
- メキシコ
- 欧州
- 欧州のカーボンクレジット市場の推定と予測、2018~2030年
- ドイツ
- 英国
- フランス
- スペイン
- イタリア
- オランダ
- スウェーデン
- アジア太平洋地域
- アジア太平洋地域のカーボンクレジット市場の推定と予測、2018~2030年
- 中国
- 日本
- 韓国
- オーストラリア
- インド
- 中南米
- 中南米のカーボンクレジット市場の推定と予測、2018~2030年
- ブラジル
- 中東とアフリカ
- 中東およびアフリカのカーボンクレジット市場の推定と予測、2018~2030年
第8章 カーボンクレジット市場:競合情勢
- 主要市場参入企業による最近の動向と影響分析
- 企業の分類
- 参加者の概要
- 財務実績
- 製品のベンチマーク
- EKI Energy Services Limited
- NativeEnergy
- ClearSky Climate Solutions
- 3Degrees Group, Inc.
- Torrent Power Limited
- WGL Holdings Inc
- Carbon Care Asia Ltd.
- CarbonBetter
- Finite Carbon
- South Pole Group
- 企業の市場での位置づけ
- 企業の市場シェア分析、2022年
- 企業ヒートマップ分析
- 戦略マッピング
- 拡張
- 合併と買収
- コラボレーション
- 新製品の発売
- 研究開発
List of Tables
- 1. List of Abbreviations
- 2. Carbon Credits market estimates and forecasts by Type, 2018 - 2030, (USD Million)
- 3. Carbon Credits market estimates and forecasts, by Project Type, 2018 - 2030, (USD Million)
- 4. Carbon Credits market estimates and forecasts, by End-use, 2018 - 2030, (USD Million)
- 5. North America Carbon Credits Market Estimates and Forecasts, 2018 - 2030 (USD Million)
- 6. North America Carbon Credits Market Estimates and Forecasts, By Type, 2018 - 2030 (USD Million)
- 7. North America Carbon Credits Market Estimates and Forecasts, By Project Type, 2018 - 2030 (USD Million)
- 8. North America Carbon Credits Market Estimates and Forecasts, By End-use, 2018 - 2030 (USD Million)
- 9. U.S. Carbon Credits Market Estimates and Forecasts, 2018 - 2030 (USD Million)
- 10. U.S. Carbon Credits Market Estimates and Forecasts, By Type, 2018 - 2030 (USD Million)
- 11. U.S. Carbon Credits Market Estimates and Forecasts, By Project Type, 2018 - 2030 (USD Million)
- 12. U.S. Carbon Credits Market Estimates and Forecasts, By End Use, 2018 - 2030 (USD Million)
- 13. Canada Carbon Credits Market Estimates and Forecasts, 2018 - 2030 (USD Million)
- 14. Canada Carbon Credits Market Estimates and Forecasts, By Type, 2018 - 2030 (USD Million)
- 15. Canada Carbon Credits Market Estimates and Forecasts, By Project Type, 2018 - 2030 (USD Million)
- 16. Canada Carbon Credits Market Estimates and Forecasts, By End Use, 2018 - 2030 (USD Million)
- 17. Mexico Carbon Credits Market Estimates and Forecasts, 2018 - 2030 (USD Million)
- 18. Mexico Carbon Credits Market Estimates and Forecasts, By Type, 2018 - 2030 (USD Million)
- 19. Mexico Carbon Credits Market Estimates and Forecasts, By Project Type, 2018 - 2030 (USD Million)
- 20. Mexico Carbon Credits Market Estimates and Forecasts, By End Use, 2018 - 2030 (USD Million)
- 21. Europe Carbon Credits Market Estimates and Forecasts, 2018 - 2030 (USD Million)
- 22. Europe Carbon Credits Market Estimates and Forecasts, By Type, 2018 - 2030 (USD Million)
- 23. Europe Carbon Credits Market Estimates and Forecasts, By Project Type, 2018 - 2030 (USD Million)
- 24. Europe Carbon Credits Market Estimates and Forecasts, By End Use, 2018 - 2030 (USD Million)
- 25. Germany Carbon Credits Market Estimates and Forecasts, 2018 - 2030 (USD Million)
- 26. Germany Carbon Credits Market Estimates and Forecasts, By Type, 2018 - 2030 (USD Million)
- 27. Germany Carbon Credits Market Estimates and Forecasts, By Project Type, 2018 - 2030 (USD Million)
- 28. Germany Carbon Credits Market Estimates and Forecasts, By End Use, 2018 - 2030 (USD Million)
- 29. France Carbon Credits Market Estimates and Forecasts, 2018 - 2030 (USD Million)
- 30. France Carbon Credits Market Estimates and Forecasts, By Type, 2018 - 2030 (USD Million)
- 31. France Carbon Credits Market Estimates and Forecasts, By Project Type, 2018 - 2030 (USD Million)
- 32. France Carbon Credits Market Estimates and Forecasts, By End Use, 2018 - 2030 (USD Million)
- 33. U.K. Carbon Credits Market Estimates and Forecasts, 2018 - 2030 (USD Million)
- 34. U.K. Carbon Credits Market Estimates and Forecasts, By Type, 2018 - 2030 (USD Million)
- 35. U.K. Carbon Credits Market Estimates and Forecasts, By Project Type, 2018 - 2030 (USD Million)
- 36. U.K. Carbon Credits Market Estimates and Forecasts, By End Use, 2018 - 2030 (USD Million)
- 37. Italy Carbon Credits Market Estimates and Forecasts, 2018 - 2030 (USD Million)
- 38. Italy Carbon Credits Market Estimates and Forecasts, By Type, 2018 - 2030 (USD Million)
- 39. Italy Carbon Credits Market Estimates and Forecasts, By Project Type, 2018 - 2030 (USD Million)
- 40. Italy Carbon Credits Market Estimates and Forecasts, By End Use, 2018 - 2030 (USD Million)
- 41. Spain Carbon Credits Market Estimates and Forecasts, 2018 - 2030 (USD Million)
- 42. Spain Carbon Credits Market Estimates and Forecasts, By Type, 2018 - 2030 (USD Million)
- 43. Spain Carbon Credits Market Estimates and Forecasts, By Project Type, 2018 - 2030 (USD Million)
- 44. Spain Carbon Credits Market Estimates and Forecasts, By End Use, 2018 - 2030 (USD Million)
- 45. Netherlands Carbon Credits Market Estimates and Forecasts, 2018 - 2030 (USD Million)
- 46. Netherlands Carbon Credits Market Estimates and Forecasts, By Type, 2018 - 2030 (USD Million)
- 47. Netherlands Carbon Credits Market Estimates and Forecasts, By Project Type, 2018 - 2030 (USD Million)
- 48. Netherlands Carbon Credits Market Estimates and Forecasts, By End Use, 2018 - 2030 (USD Million)
- 49. Sweden Carbon Credits Market Estimates and Forecasts, 2018 - 2030 (USD Million)
- 50. Sweden Carbon Credits Market Estimates and Forecasts, By Type, 2018 - 2030 (USD Million)
- 51. Sweden Carbon Credits Market Estimates and Forecasts, By Project Type, 2018 - 2030 (USD Million)
- 52. Sweden Carbon Credits Market Estimates and Forecasts, By End Use, 2018 - 2030 (USD Million)
- 53. Asia Pacific Carbon Credits Market Estimates and Forecasts, 2018 - 2030 (USD Million)
- 54. Asia Pacific Carbon Credits Market Estimates and Forecasts, By Type, 2018 - 2030 (USD Million)
- 55. Asia Pacific Carbon Credits Market Estimates and Forecasts, By Project Type, 2018 - 2030 (USD Million)
- 56. Asia Pacific Carbon Credits Market Estimates and Forecasts, By End Use, 2018 - 2030 (USD Million)
- 57. India Carbon Credits Market Estimates and Forecasts, 2018 - 2030 (USD Million)
- 58. India Carbon Credits Market Estimates and Forecasts, By Type, 2018 - 2030 (USD Million)
- 59. India Carbon Credits Market Estimates and Forecasts, By Project Type, 2018 - 2030 (USD Million)
- 60. India Carbon Credits Market Estimates and Forecasts, By End Use, 2018 - 2030 (USD Million)
- 61. China Carbon Credits Market Estimates and Forecasts, By 2018 - 2030 (USD Million)
- 62. China Carbon Credits Market Estimates and Forecasts, By Type, 2018 - 2030 (USD Million)
- 63. China Carbon Credits Market Estimates and Forecasts, By Project Type, 2018 - 2030 (USD Million)
- 64. China Carbon Credits Market Estimates and Forecasts, By End Use, 2018 - 2030 (USD Million)
- 65. Japan Carbon Credits Market Estimates and Forecasts, 2018 - 2030 (USD Million)
- 66. Japan Carbon Credits Market Estimates and Forecasts, By Type, 2018 - 2030 (USD Million)
- 67. Japan Carbon Credits Market Estimates and Forecasts, By Project Type, 2018 - 2030 (USD Million)
- 68. Japan Carbon Credits Market Estimates and Forecasts, By End Use, 2018 - 2030 (USD Million)
- 69. South Korea Carbon Credits Market Estimates and Forecasts, 2018 - 2030 (USD Million)
- 70. South Korea Carbon Credits Market Estimates and Forecasts, By Type, 2018 - 2030 (USD Million)
- 71. South Korea Carbon Credits Market Estimates and Forecasts, By Project Type, 2018 - 2030 (USD Million)
- 72. South Korea Carbon Credits Market Estimates and Forecasts, By End Use, 2018 - 2030 (USD Million)
- 73. Australia Carbon Credits Market Estimates and Forecasts, 2018 - 2030 (USD Million)
- 74. Australia Carbon Credits Market Estimates and Forecasts, By Type, 2018 - 2030 (USD Million)
- 75. Australia Carbon Credits Market Estimates and Forecasts, By Project Type, 2018 - 2030 (USD Million)
- 76. Australia Carbon Credits Market Estimates and Forecasts, By End Use, 2018 - 2030 (USD Million)
- 77. Central & South America Carbon Credits Market Estimates and Forecasts, 2018 - 2030 (USD Million)
- 78. Central & South America Carbon Credits Market Estimates and Forecasts, By Type, 2018 - 2030 (USD Million)
- 79. Central & South America Carbon Credits Market Estimates and Forecasts, By Project Type, 2018 - 2030 (USD Million)
- 80. Central & South America Carbon Credits Market Estimates and Forecasts, By End Use, 2018 - 2030 (USD Million)
- 81. Brazil Carbon Credits Market Estimates and Forecasts, 2018 - 2030 (USD Million)
- 82. Brazil Carbon Credits Market Estimates and Forecasts, By Type, 2018 - 2030 (USD Million)
- 83. Brazil Carbon Credits Market Estimates and Forecasts, By Project Type, 2018 - 2030 (USD Million)
- 84. Brazil Carbon Credits Market Estimates and Forecasts, By End Use, 2018 - 2030 (USD Million)
- 85. Middle East & Africa Carbon Credits Market Estimates and Forecasts, 2018 - 2030 (USD Million)
- 86. Middle East & Africa Carbon Credits Market Estimates and Forecasts, By Type, 2018 - 2030 (USD Million)
- 87. Middle East & Africa Carbon Credits Market Estimates and Forecasts, By Project Type, 2018 - 2030 (USD Million)
- 88. Middle East & Africa Carbon Credits Market Estimates and Forecasts, By End Use, 2018 - 2030 (USD Million)
List of Figures
- 1. Carbon Credits Market Segmentation
- 2. Information procurement
- 3. Primary research pattern
- 4. Primary research process
- 5. Primary research approaches
- 6. Market Snapshot
- 7. Segment Snapshot
- 8. Competitive Landscape Snapshot
- 9. Carbon Market Value, 2022 (USD Billion)
- 10. Carbon Credits Market - Industry Value Chain Analysis
- 11. Carbon Credits - Market Dynamics
- 12. Global Carbon Dioxide Market, 2018-2030 (USD Million)
- 13. Carbon Credits Market - Porter's Five Forces Analysis
- 14. Carbon Credits Market - PESTEL analysis
- 14. Carbon Credits market revenue, by region, 2022 & 2030 (USD Million)
- 15. Regional marketplace: Key takeaways
- 16. North America Carbon Credits Market Estimates & Forecasts, 2018 - 2030 (USD Million)
- 17. U.S. Carbon Credits Market Estimates & Forecasts, 2018 - 2030 (USD Million)
- 18. Canada Carbon Credits Market Estimates & Forecasts, 2018 - 2030 (USD Million)
- 19. Mexico Carbon Credits Market Estimates & Forecasts, 2018 - 2030 (USD Million)
- 20. Europe Carbon Credits Market Estimates & Forecasts, 2018 - 2030 (USD Million)
- 21. Germany Carbon Credits Market Estimates & Forecasts, 2018 - 2030 (USD Million)
- 22. UK Carbon Credits Market Estimates & Forecasts, 2018 - 2030 (USD Million)
- 23. France Carbon Credits Market Estimates & Forecasts, 2018 - 2030 (USD Million)
- 24. Italy Carbon Credits Market Estimates & Forecasts, 2018 - 2030 (USD Million)
- 25. Spain Carbon Credits Market Estimates & Forecasts, 2018 - 2030 (USD Million)
- 26. Netherlands Carbon Credits Market Estimates & Forecasts, 2018 - 2030 (USD Million)
- 27. Sweden Carbon Credits Market Estimates & Forecasts, 2018 - 2030 (USD Million)
- 28. Asia Pacific Carbon Credits market estimates & forecast, 2018 - 2030 (USD Million)
- 29. China Carbon Credits market estimates & forecast, 2018 - 2030 (USD Million)
- 30. Japan Carbon Credits market estimates & forecast, 2018 - 2030 (USD Million)
- 31. South Korea Carbon Credits market estimates & forecast, 2018 - 2030 (USD Million)
- 32. India Carbon Credits market estimates & forecast, 2018 - 2030 (USD Million)
- 33. Australia Carbon Credits market estimates & forecast, 2018 - 2030 (USD Million)
- 34. Central & South America Carbon Credits Market Estimates & Forecasts, 2018 - 2030 (USD Million)
- 35. Brazil Carbon Credits Market Estimates & Forecasts, 2018 - 2030 (USD Million)
- 36. Middle East and Africa Carbon Credits market estimates & forecast, 2018 - 2030 (USD Million)
- 37. Key Company Categorization
- 38. Company Market Positioning
- 39. Company Market Share Analysis, 2022
- 40. Strategic Framework
Carbon Credit Market Growth & Trends
The global carbon credit market size is expected to reach USD 4,734.35 billion by 2030, according to a new report by Grand View Research, Inc. The market is expected to expand at a lucrative CAGR of 38.7% during the forecast period. The demand for carbon credits has been rising substantially in recent years due to various factors, such as several governments introducing policies and regulations that are aimed at reducing greenhouse gas emissions.
The significant demand for carbon credits has been helped by companies increasingly recognizing the importance of sustainability and of reducing their carbon footprint as part of their corporate social responsibility initiatives. This has led to carbon credits becoming a vital aspect for organizations to offset their emissions. In addition, growing concerns about climate change and its potential impacts have also created strong traction in the carbon credits space.
Governments around the world are implementing policies and regulations to reduce greenhouse gas emissions and combat climate change. Many of these regulations require companies to offset their emissions by purchasing carbon credits. These factors are expected to drive the compliance carbon credit market globally.
Compliance was the dominant segment in the global market for carbon credits in 2022 with a revenue share of 98.91%. The compliance carbon credit market is where companies and organizations that are regulated by a government or a specific authority are required to offset their carbon emissions by purchasing carbon credits. These credits represent a reduction in greenhouse gas emissions from an approved project, such as renewable energy or energy efficiency initiatives.
The COVID-19 pandemic has been a major restraint to the advancement of the carbon credit market, owing to several factors including reducing operational costs by end-users, along with extensive disruption in the availability of spare parts across the globe due to sluggish manufacturing activities and logistics issues.
Carbon Credit Market Report Highlights
- In 2022, compliance emerged as the largest type segment and accounted for 98.91% of the revenue share. Several advantages due to regulated policies generated by governments are supporting the market growth
- In 2022, the avoidance/reduction projects segment accounted for the largest share of 66.88% in the global market for carbon credits. The growing number of renewable energy projects requiring carbon offset is expected to augment market growth over the forecast period
- The U.S. emerged as the largest carbon credit market in North America in 2022. The carbon credit market is primarily driven by a combination of state-level programs and voluntary markets in the country
- In Europe, the UK emerged as the largest country in terms of revenue generation for the carbon credit market, with a share of 38.43% in 2022. Supportive government policies and frameworks toward the positive scaling of emission trading schemes are fostering regional growth
- In 2022, the power segment in the end-use category dominated the global market for carbon credits with a share of 31.01%. Increasing investments in the power sector, along with the capture of carbon to enhance the trading platform, will further support segment growth over the forecast period
Table of Contents
Chapter 1 Methodology & Scope
- 1.1 Market Segmentation & Scope
- 1.2 Information Procurement
- 1.2.1 Purchased Database
- 1.2.2 GVR's Internal Database
- 1.2.3 Secondary Type
- 1.2.4 Third-Party Perspective
- 1.2.5 Primary Research
- 1.3 Information Analysis
- 1.3.1 Data Analysis Models
- 1.4 Market Formulation and Data Visualization
- 1.5 Data Validation and Publishing
Chapter 2 Executive Summary
- 2.1 Market Snapshot
- 2.2 Segment Snapshot
- 2.3 Competitive Landscape Snapshot
Chapter 3 Market Variables, Trends, & Scope
- 3.1 Penetration & Growth Prospect Mapping
- 3.2 Industry Value Chain Analysis
- 3.3 Market Trends
- 3.4 Technology Trends
- 3.5 Market Dynamics
- 3.5.1 Market Driver Impact Analysis
- 3.5.2 Market Restraint Impact Analysis
- 3.5.3 Industry Challenges
- 3.5.4 Industry opportunities
- 3.6 Regulatory Framework
- 3.6.1 European Union (EU) Regulations
- 3.6.2 U.S. regulations
- 3.6.3 India Regulations
- 3.7 Business Environment Analysis: Carbon Credits Market
- 3.7.1 Industry Analysis - Porter's Five Forces
- 3.7.2 PESTEL analysis
Chapter 4 Carbon Credits Market: Type Estimates & Trend Analysis
- 4.1 Type Movement Analysis & Market Share, 2022 & 2030
- 4.2 Carbon Credits Market Estimates & Forecast, By Type (USD Million)
- 4.2.1 Compliance
- 4.2.2 Voluntary
Chapter 5 Carbon Credits Market: Project Type Estimates & Trend Analysis
- 5.1 Project Type Movement Analysis & Market Share, 2022 & 2030
- 5.2 Carbon Credits Market Estimates & Forecast, By Project Type (USD Million)
- 5.2.1 Avoidance/Reduction projects
- 5.2.2 Removal/Sequestration projects
- 5.2.2.1 Nature-based
- 5.2.2.2 Technology-based
Chapter 6 Carbon Credits Market: End-use Estimates & Trend Analysis
- 6.1 End-use Movement Analysis & Market Share, 2022 & 2030
- 6.2 Carbon Credits Market Estimates & Forecast, By End-use (USD Million)
- 6.2.1 Power
- 6.2.2. Energy
- 6.2.3. Aviation
- 6.2.4. Transportation
- 6.2.5. Buildings
- 6.2.6. Industrial
- 6.2.7. Others
Chapter 7 Carbon Credits Market: Regional Estimates & Trend Analysis
- 7.1 Carbon Credits Market: Regional Outlook
- 7.2 North America
- 7.2.1 North America Carbon Credits market estimates & Forecasts, 2018 - 2030 (USD Million)
- 7.2.2 U.S.
- 7.2.2.1 Key country dynamics
- 7.2.2.2 U.S. Carbon Credits market estimates & Forecasts, 2018 - 2030 (USD Million)
- 7.2.3 Canada
- 7.2.3.1 Key country dynamics
- 7.2.3.2 Canada Carbon Credits market estimates & Forecasts, 2018 - 2030 (USD Million)
- 7.2.4 Mexico
- 7.2.4.1 Key country dynamics
- 7.2.4.2 Mexico Carbon Credits market estimates & Forecasts, 2018 - 2030 (USD Million)
- 7.3 Europe
- 7.3.1 Europe carbon credits market estimates & Forecasts, 2018 - 2030 (USD Million)
- 7.3.2 Germany
- 7.3.2.1 Key country dynamics
- 7.3.2.2 Germany Carbon Credits market estimates & Forecasts, 2018 - 2030 (USD Million)
- 7.3.3 UK
- 7.3.3.1 Key country dynamics
- 7.3.3.2 UK Carbon Credits market estimates & Forecasts, 2018 - 2030 (USD Million)
- 7.3.4 France
- 7.3.4.1 Key country dynamics
- 7.3.4.2 France Carbon Credits market estimates & Forecasts, 2018 - 2030 (USD Million)
- 7.3.5 Spain
- 7.3.5.1 Key country dynamics
- 7.3.5.2 Spain Carbon Credits market estimates & Forecasts, 2018 - 2030 (USD Million)
- 7.3.6 Italy
- 7.3.6.1 Key country dynamics
- 7.3.6.2 Italy Carbon Credits market estimates & Forecasts, 2018 - 2030 (USD Million)
- 7.3.7 Netherlands
- 7.3.7.1 Key country dynamics
- 7.3.7.2 Netherlands Carbon Credits market estimates & Forecasts, 2018 - 2030 (USD Million)
- 7.3.8 Sweden
- 7.3.8.1 Key country dynamics
- 7.3.8.2 Sweden Carbon Credits market estimates & Forecasts, 2018 - 2030 (USD Million)
- 7.4 Asia Pacific
- 7.4.1 Asia Pacific Carbon Credits market estimates & Forecasts, 2018 - 2030 (USD Million)
- 7.4.2 China
- 7.4.2.1 Key country dynamics
- 7.4.2.2 China Carbon Credits market estimates & Forecasts, 2018 - 2030 (USD Million)
- 7.4.3 Japan
- 7.4.3.1 Key country dynamics
- 7.4.3.2 Japan Carbon Credits market estimates & Forecasts, 2018 - 2030 (USD Million)
- 7.4.4 South Korea
- 7.4.4.1 Key country dynamics
- 7.4.4.2 South Korea Carbon Credits market estimates & Forecasts, 2018 - 2030 (USD Million)
- 7.4.5 Australia
- 7.4.5.1 Key country dynamics
- 7.4.5.2 Australia Carbon Credits market estimates & Forecasts, 2018 - 2030 (USD Million)
- 7.4.6 India
- 7.4.6.1 Key country dynamics
- 7.4.6.2 India Carbon Credits market estimates & Forecasts, 2018 - 2030 (USD Million)
- 7.5 Central & South America
- 7.5.1 Central & South America Carbon Credits market estimates & Forecasts, 2018 - 2030 (USD Million)
- 7.5.2 Brazil
- 7.5.2.1 Key country dynamics
- 7.5.2.2 Brazil Carbon Credits market estimates & Forecasts, 2018 - 2030 (USD Million)
- 7.6 Middle East and Africa
- 7.6.1 Middle East and Africa Carbon Credits market estimates & Forecasts, 2018 - 2030 (USD Million)
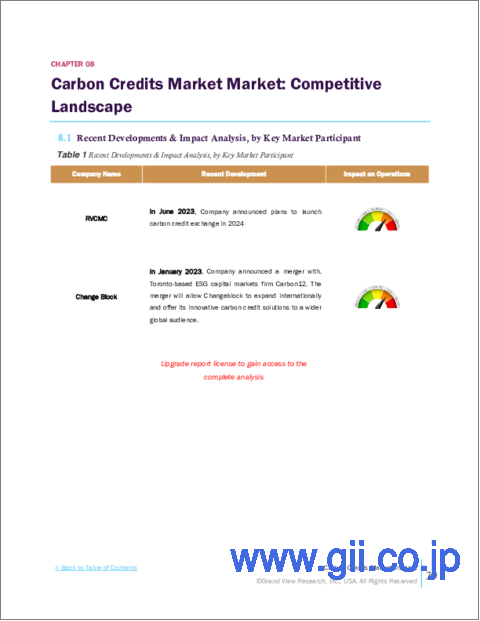
Chapter 8 Carbon Credits Market: Competitive Landscape
- 8.1 Recent Developments & Impact Analysis, by Key Market Participant
- 8.2 Company Categorization
- 8.3 Participant's Overview
- 8.4 Financial Performance
- 8.5 Product Benchmarking
- 8.5.1 EKI Energy Services Limited
- 8.5.2 NativeEnergy
- 8.5.3 ClearSky Climate Solutions
- 8.5.4 3Degrees Group, Inc.
- 8.5.5 Torrent Power Limited
- 8.5.6 WGL Holdings Inc
- 8.5.7 Carbon Care Asia Ltd.
- 8.5.8 CarbonBetter
- 8.5.9 Finite Carbon
- 8.5.10 South Pole Group
- 8.6 Company Market Positioning
- 8.7 Company Market Share Analysis, 2022
- 8.8 Company Heat Map Analysis
- 8.9 Strategy Mapping
- 8.9.1 Expansions
- 8.9.2 Mergers & acquisitions
- 8.9.3 Collaborations
- 8.9.4 New product launches
- 8.9.5 Research & Development