|
|
市場調査レポート
商品コード
1458487
カーボンクレジット取引の世界市場の考察、予測(~2030年)Global Trading of Carbon Credit Market Insights, Forecast to 2030 |
||||||
|
|||||||
カスタマイズ可能
適宜更新あり
|
|||||||

| カーボンクレジット取引の世界市場の考察、予測(~2030年) |
|
出版日: 2024年04月02日
発行: QYResearch
ページ情報: 英文 183 Pages
納期: 2~3営業日
|

全表示
- 概要
- 図表
- 目次
世界のカーボンクレジット取引の市場規模は、2024年の18億8,515万米ドルから2030年までに46億4,805万米ドルに達すると予測され、予測期間にCAGRで16.23%の成長が見込まれます。
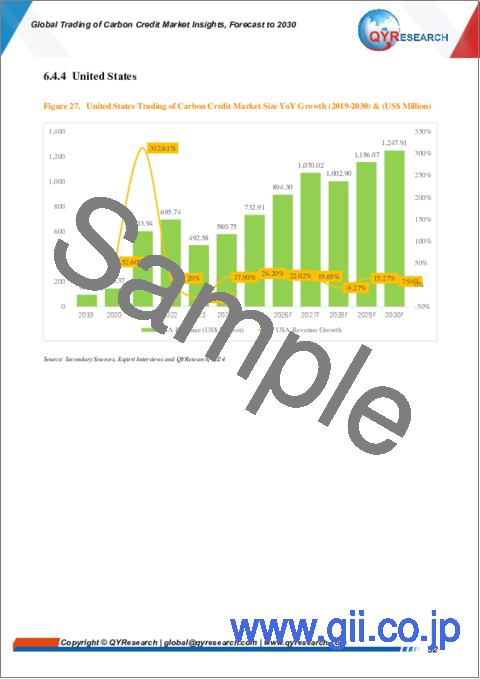
北米の市場規模は、2024年の6億3,712万米ドルから2030年までに14億5万米ドルに達すると推定され、2024年~2030年の予測期間のCAGRは14.02%です。
中国の市場規模は、2024年の5,700万米ドルから2030年までに3億3,015万米ドルに達すると推定され、予測期間のCAGRは34.01%です。
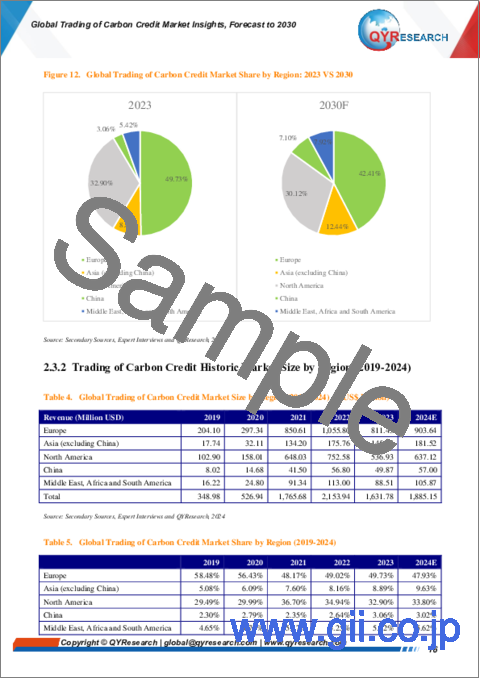
欧州の市場規模は、2024年の9億364万米ドルから2030年までに19億7,145万米ドルに達すると推定され、予測期間のCAGRは13.88%です。
世界のカーボンクレジット取引の主要企業は、South Pole Group、3Degrees、ClimatePartner GmbH、Green Mountain Energy、EcoAct、MyClimate、First Climate Markets AG、Terrapass、Schneiderなどです。2023年、世界の上位5社の収益シェアは約28.06%でした。
当レポートでは、世界のカーボンクレジット取引市場について調査分析し、各地域の市場規模と予測、企業プロファイル、市場力学などを提供しています。
目次
第1章 レポートの概要
- 調査範囲
- 市場の分析
- 世界のカーボンクレジット取引の市場規模成長率(2019年・2024年・2030年)
- 林業
- 再生可能エネルギー
- ごみ処理
- 市場:用途別
- 世界のカーボンクレジット取引の市場シェア:用途別(2019年・2024年・2030年)
- 個人
- 企業
- 前提条件と制限
- 調査目的
- 考慮される年数
第2章 世界の成長動向
- 二酸化炭素換算値と価格の分析(2019年~2030年)
- 世界のカーボンクレジット取引市場の見通し(2019年~2030年)
- 世界のカーボンクレジット取引の成長動向:地域別
- 世界のカーボンクレジット取引の市場規模:地域別(2019年・2024年・2030年)
- カーボンクレジット取引の市場規模の実績:地域別(2019年~2024年)
- カーボンクレジット取引の市場規模の予測:地域別(2025年~2030年)
- カーボンクレジット取引の市場力学
- カーボンクレジット取引産業の動向
- カーボンクレジット取引市場の促進要因
- カーボンクレジット取引市場の課題
- カーボンクレジット取引市場の抑制要因
第3章 競合情勢:主要企業別
- 世界のカーボンクレジット取引の収益:企業別
- 世界のカーボンクレジット取引の収益:企業別(2019年~2024年)
- 世界のカーボンクレジット取引の収益の市場シェア:企業別(2019年~2024年)
- 世界のカーボンクレジット取引の市場シェア:企業タイプ別(Tier 1・Tier 2・Tier 3)
- 世界のカーボンクレジット取引の主要企業、収益ランキング(2022年・2023年・2024年)
- 世界のカーボンクレジット取引の市場集中度
- 世界のカーボンクレジット取引の市場集中度
- 世界のカーボンクレジット取引の収益の上位5社(2023年)
- 世界のカーボンクレジット取引の主要企業の本社、サービス提供エリア
- 世界のカーボンクレジット取引の主要企業、製品、用途
- 合併と買収、拡張計画
第4章 カーボンクレジット取引の内訳データ
- 世界のカーボンクレジット取引の市場規模の実績(2019年~2024年)
- 世界のカーボンクレジット取引の市場規模の予測(2025年~2030年)
第5章 カーボンクレジット取引の内訳データ:用途別
- 世界のカーボンクレジット取引の市場規模の実績:用途別(2019年~2024年)
- 世界のカーボンクレジット取引の市場規模の予測:用途別(2025年~2030年)
第6章 北米
- 北米のカーボンクレジット取引の市場規模(2019年~2030年)
- 北米のカーボンクレジット取引の市場規模
- 北米のカーボンクレジット取引の市場規模(2019年~2024年)
- 北米のカーボンクレジット取引の市場規模(2025年~2030年)
- 北米のカーボンクレジット取引の市場シェア(2019年~2030年)
- 北米のカーボンクレジット取引の市場規模:用途別
- 北米のカーボンクレジット取引の市場規模:用途別(2019年~2024年)
- 北米のカーボンクレジット取引の市場規模:用途別(2025年~2030年)
- 北米のカーボンクレジット取引の市場シェア:用途別(2019年~2030年)
- 北米のカーボンクレジット取引の市場規模:国別
- 北米のカーボンクレジット取引の市場規模:国別(2019年・2024年・2030年)
- 北米のカーボンクレジット取引の市場規模:国別(2019年~2024年)
- 北米のカーボンクレジット取引の市場シェア:国別(2025年~2030年)
- 米国
- カナダ
- メキシコ
第7章 欧州
- 欧州のカーボンクレジット取引の市場規模(2019年~2030年)
- 欧州のカーボンクレジット取引の市場規模
- 欧州のカーボンクレジット取引の市場規模(2019年~2024年)
- 欧州のカーボンクレジット取引の市場規模(2025年~2030年)
- 欧州のカーボンクレジット取引の市場シェア(2019年~2030年)
- 欧州のカーボンクレジット取引の市場規模:用途別
- 欧州のカーボンクレジット取引の市場規模:用途別(2019年~2024年)
- 欧州のカーボンクレジット取引の市場規模:用途別(2025年~2030年)
- 欧州のカーボンクレジット取引の市場シェア:用途別(2019年~2030年)
- 欧州のカーボンクレジット取引の市場規模:国別
- 欧州のカーボンクレジット取引の市場規模:国別(2019年・2024年・2030年)
- 欧州のカーボンクレジット取引の市場規模:国別(2019年~2024年)
- 欧州のカーボンクレジット取引の市場規模:国別(2025年~2030年)
- ドイツ
- フランス
- 英国
- オランダ
- スイス
第8章 中国
- 中国のカーボンクレジット取引の市場規模(2019年~2030年)
- 中国のカーボンクレジット取引の市場規模
- 中国のカーボンクレジット取引の市場規模(2019年~2024年)
- 中国のカーボンクレジット取引の市場規模(2025年~2030年)
- 中国のカーボンクレジット取引の市場シェア(2019年~2030年)
- 中国のカーボンクレジット取引の市場規模:用途別
- 中国のカーボンクレジット取引の市場規模:用途別(2019年~2024年)
- 中国のカーボンクレジット取引の市場規模:用途別(2025年~2030年)
- 中国のカーボンクレジット取引の市場シェア:用途別(2019年~2030年)
第9章 アジア(中国を除く)
- アジアのカーボンクレジット取引の市場規模(2019年~2030年)
- アジアのカーボンクレジット取引の市場規模
- アジアのカーボンクレジット取引の市場規模(2019年~2024年)
- アジアのカーボンクレジット取引の市場規模(2025年~2030年)
- アジアのカーボンクレジット取引の市場シェア(2019年~2030年)
- アジアのカーボンクレジット取引の市場規模:用途別
- アジアのカーボンクレジット取引の市場規模:用途別(2019年~2024年)
- アジアのカーボンクレジット取引の市場規模:用途別(2025年~2030年)
- アジアのカーボンクレジット取引の市場シェア:用途別(2019年~2030年)
- アジアのカーボンクレジット取引の市場規模:地域別
- アジアのカーボンクレジット取引の市場規模:地域別(2019年・2024年・2030年)
- アジアのカーボンクレジット取引の市場規模:地域別(2019年~2024年)
- アジアのカーボンクレジット取引の市場規模:地域別(2025年~2030年)
- 日本
- 韓国
- 東南アジア
- インド
- オーストラリア
第10章 中東・アフリカ・ラテンアメリカ
- 中東・アフリカ・ラテンアメリカのカーボンクレジット取引の市場規模(2019年~2030年)
- 中東・アフリカ・ラテンアメリカのカーボンクレジット取引の市場規模
- 中東・アフリカ・ラテンアメリカのカーボンクレジット取引の市場規模(2019年~2024年)
- 中東・アフリカ・ラテンアメリカのカーボンクレジット取引の市場規模(2025年~2030年)
- 中東・アフリカ・ラテンアメリカのカーボンクレジット取引の市場シェア(2019年~2030年)
- 中東・アフリカ・ラテンアメリカのカーボンクレジット取引の市場規模:用途別
- 中東・アフリカ・ラテンアメリカのカーボンクレジット取引の市場規模:用途別(2019年~2024年)
- 中東・アフリカ・ラテンアメリカのカーボンクレジット取引の市場規模:用途別(2025年~2030年)
- 中東・アフリカ・ラテンアメリカのカーボンクレジット取引の市場シェア:用途別(2019年~2030年)
- 中東・アフリカ・ラテンアメリカのカーボンクレジット取引の市場規模:国別
- 中東・アフリカ・ラテンアメリカのカーボンクレジット取引の市場規模:国別(2019年・2024年・2030年)
- 中東・アフリカ・ラテンアメリカのカーボンクレジット取引の市場規模:国別(2019年~2024年)
- 中東・アフリカ・ラテンアメリカのカーボンクレジット取引の市場規模:国別(2025年~2030年)
- ブラジル
- アルゼンチン
- 中東
- アフリカ
第11章 主要企業のプロファイル
- South Pole Group
- 3Degrees
- ClimatePartner GmbH
- Green Mountain Energy
- EcoAct
- MyClimate
- First Climate Markets AG
- Terrapass
- Schneider
- Aera Group
- Allcot Group
- Swiss Climate
- Forliance
- Bluesource
- GreenTrees
- NativeEnergy
- NatureOffice GmbH
- Element Markets
- Bischoff & Ditze Energy GmbH
- Bioassets
- UPM Umwelt-Projekt-Management GmbH
- Carbon Credit Capital
- CBEEX
- Biofilica
第12章 アナリストの視点/結論
第13章 付録
List of Tables
- Table 1. Global Trading of Carbon Credit Market Size Growth Rate (US$ Million): 2019 VS 2024 VS 2030
- Table 2. Global Trading of Carbon Credit Market Size Growth by Application (US$ Million): 2019 VS 2024 VS 2030
- Table 3. Global Trading of Carbon Credit Market Size Growth Rate (CAGR) by Region (US$ Million): 2019 VS 2024 VS 2030
- Table 4. Global Trading of Carbon Credit Market Size by Region (2019-2024) & (US$ Million)
- Table 5. Global Trading of Carbon Credit Market Share by Region (2019-2024)
- Table 6. Global Trading of Carbon Credit Forecasted Market Size by Region (2025-2030) & (US$ Million)
- Table 7. Global Trading of Carbon Credit Market Share by Region (2025-2030)
- Table 8. Trading of Carbon Credit Market Trends
- Table 9. Trading of Carbon Credit Market Drivers
- Table 10. Trading of Carbon Credit Market Challenges
- Table 11. Global Trading of Carbon Credit Revenue by Players (2019-2024) & (US$ Million)
- Table 12. Global Trading of Carbon Credit Market Share by Players (2019-2024)
- Table 13. Global Top Trading of Carbon Credit Players by Company Type (Tier 1, Tier 2, and Tier 3) & (based on the Revenue in Trading of Carbon Credit as of 2023)
- Table 14. Global Trading of Carbon Credit Industry Ranking 2022 VS 2023
- Table 15. Global Key Players of Trading of Carbon Credit, Headquarters and Area Served
- Table 16. Global Key Players of Trading of Carbon Credit, Product and Application
- Table 17. Mergers & Acquisitions, Expansion Plans
- Table 18. Global Trading of Carbon Credit Market Size (2019-2024) & (US$ Million)
- Table 19. Global Trading of Carbon Credit Revenue Market Share (2019-2024)
- Table 20. Global Trading of Carbon Credit Forecasted Market Size (2025-2030) & (US$ Million)
- Table 21. Global Trading of Carbon Credit Revenue Market Share (2025-2030)
- Table 22. Global Trading of Carbon Credit Market Size by Application (2019-2024) & (US$ Million)
- Table 23. Global Trading of Carbon Credit Revenue Market Share by Application (2019-2024)
- Table 24. Global Trading of Carbon Credit Forecasted Market Size by Application (2025-2030) & (US$ Million)
- Table 25. Global Trading of Carbon Credit Revenue Market Share by Application (2025-2030)
- Table 26. North America Trading of Carbon Credit Market Size (2019-2024) & (US$ Million)
- Table 27. North America Trading of Carbon Credit Market Size (2025-2030) & (US$ Million)
- Table 28. North America Trading of Carbon Credit Market Size by Application (2019-2024) & (US$ Million)
- Table 29. North America Trading of Carbon Credit Market Size by Application (2025-2030) & (US$ Million)
- Table 30. North America Trading of Carbon Credit Growth Rate (CAGR) by Country (US$ Million): 2019 VS 2024 VS 2030
- Table 31. North America Trading of Carbon Credit Market Size by Country (2019-2024) & (US$ Million)
- Table 32. North America Trading of Carbon Credit Market Size by Country (2025-2030) & (US$ Million)
- Table 33. Europe Trading of Carbon Credit Market Size (2019-2024) & (US$ Million)
- Table 34. Europe Trading of Carbon Credit Market Size (2025-2030) & (US$ Million)
- Table 35. Europe Trading of Carbon Credit Market Size by Application (2019-2024) & (US$ Million)
- Table 36. Europe Trading of Carbon Credit Market Size by Application (2025-2030) & (US$ Million)
- Table 37. Europe Trading of Carbon Credit Growth Rate (CAGR) by Country (US$ Million): 2019 VS 2024 VS 2030
- Table 38. Europe Trading of Carbon Credit Market Size by Country (2019-2024) & (US$ Million)
- Table 39. Europe Trading of Carbon Credit Market Size by Country (2025-2030) & (US$ Million)
- Table 40. China Trading of Carbon Credit Market Size (2019-2024) & (US$ Million)
- Table 41. China Trading of Carbon Credit Market Size (2025-2030) & (US$ Million)
- Table 42. China Trading of Carbon Credit Market Size by Application (2019-2024) & (US$ Million)
- Table 43. China Trading of Carbon Credit Market Size by Application (2025-2030) & (US$ Million)
- Table 44. Asia Trading of Carbon Credit Market Size (2019-2024) & (US$ Million)
- Table 45. Asia Trading of Carbon Credit Market Size (2025-2030) & (US$ Million)
- Table 46. Asia Trading of Carbon Credit Market Size by Application (2019-2024) & (US$ Million)
- Table 47. Asia Trading of Carbon Credit Market Size by Application (2025-2030) & (US$ Million)
- Table 48. Asia Trading of Carbon Credit Growth Rate (CAGR) by Region (US$ Million): 2019 VS 2024 VS 2030
- Table 49. Asia Trading of Carbon Credit Market Size by Region (2019-2024) & (US$ Million)
- Table 50. Asia Trading of Carbon Credit Market Size by Region (2025-2030) & (US$ Million)
- Table 51. Middle East, Africa, and Latin America Trading of Carbon Credit Market Size (2019-2024) & (US$ Million)
- Table 52. Middle East, Africa, and Latin America Trading of Carbon Credit Market Size (2025-2030) & (US$ Million)
- Table 53. Middle East, Africa, and Latin America Trading of Carbon Credit Market Size by Application (2019-2024) & (US$ Million)
- Table 54. Middle East, Africa, and Latin America Trading of Carbon Credit Market Size by Application (2025-2030) & (US$ Million)
- Table 55. Middle East, Africa, and Latin America Trading of Carbon Credit Growth Rate (CAGR) by Country (US$ Million): 2019 VS 2024 VS 2030
- Table 56. Middle East, Africa, and Latin America Trading of Carbon Credit Market Size by Country (2019-2024) & (US$ Million)
- Table 57. Middle East, Africa, and Latin America Trading of Carbon Credit Market Size by Country (2025-2030) & (US$ Million)
- Table 58. South Pole Group Details, Company Type, Voluntary Carbon Offsets Area Served and Its Competitors
- Table 59. South Pole Group Voluntary Carbon Offsets Product Offered
- Table 60. South Pole Group Revenue in Trading of Carbon Credit Business (2019-2024) & (US$ Million)
- Table 61. South Pole Group Main Business
- Table 62. 3Degrees Details, Company Type, Voluntary Carbon Offsets Area Served and Its Competitors
- Table 63. 3Degrees Voluntary Carbon Offsets Product Offered
- Table 64. 3Degrees Revenue in Trading of Carbon Credit Business (2019-2024) & (US$ Million)
- Table 65. 3Degrees Main Business
- Table 66. ClimatePartner GmbH Details, Company Type, Voluntary Carbon Offsets Area Served and Its Competitors
- Table 67. ClimatePartner GmbH Voluntary Carbon Offsets Product Offered
- Table 68. ClimatePartner GmbH Revenue in Trading of Carbon Credit Business (2019-2024) & (US$ Million)
- Table 69. ClimatePartner GmbH Main Business
- Table 70. Green Mountain Energy Details, Company Type, Voluntary Carbon Offsets Area Served and Its Competitors
- Table 71. Green Mountain Energy Voluntary Carbon Offsets Product Offered
- Table 72. Green Mountain Energy Revenue in Trading of Carbon Credit Business (2019-2024) & (US$ Million)
- Table 73. Green Mountain Energy Main Business
- Table 74. EcoAct Details, Company Type, Voluntary Carbon Offsets Area Served and Its Competitors
- Table 75. EcoAct Voluntary Carbon Offsets Product Offered
- Table 76. EcoAct Revenue in Trading of Carbon Credit Business (2019-2024) & (US$ Million)
- Table 77. EcoAct Main Business
- Table 78. MyClimate Details, Company Type, Voluntary Carbon Offsets Area Served and Its Competitors
- Table 79. MyClimate Voluntary Carbon Offsets Product Offered
- Table 80. MyClimate Revenue in Trading of Carbon Credit Business (2019-2024) & (US$ Million)
- Table 81. MyClimate Main Business
- Table 82. First Climate Markets AG Details, Company Type, Voluntary Carbon Offsets Area Served and Its Competitors
- Table 83. First Climate Markets AG Voluntary Carbon Offsets Product Offered
- Table 84. First Climate Markets AG Revenue in Trading of Carbon Credit Business (2019-2024) & (US$ Million)
- Table 85. First Climate Markets AG Main Business
- Table 86. Terrapass Details, Company Type, Voluntary Carbon Offsets Area Served and Its Competitors
- Table 87. Terrapass Voluntary Carbon Offsets Product Offered
- Table 88. Terrapass Revenue in Trading of Carbon Credit Business (2019-2024) & (US$ Million)
- Table 89. Terrapass Main Business
- Table 90. Schneider Details, Company Type, Voluntary Carbon Offsets Area Served and Its Competitors
- Table 91. Schneider Voluntary Carbon Offsets Product Offered
- Table 92. Schneider Revenue in Trading of Carbon Credit Business (2019-2024) & (US$ Million)
- Table 93. Schneider Main Business
- Table 94. Aera Group Details, Company Type, Voluntary Carbon Offsets Area Served and Its Competitors
- Table 95. Aera Group Voluntary Carbon Offsets Product Offered
- Table 96. Aera Group Revenue in Trading of Carbon Credit Business (2019-2024) & (US$ Million)
- Table 97. Aera Group Main Business
- Table 98. Allcot Group Details, Company Type, Voluntary Carbon Offsets Area Served and Its Competitors
- Table 99. Allcot Group Voluntary Carbon Offsets Product Offered
- Table 100. Allcot Group Revenue in Trading of Carbon Credit Business (2019-2024) & (US$ Million)
- Table 101. Allcot Group Main Business
- Table 102. Swiss Climate Details, Company Type, Voluntary Carbon Offsets Area Served and Its Competitors
- Table 103. Swiss Climate Voluntary Carbon Offsets Product Offered
- Table 104. Swiss Climate Revenue in Trading of Carbon Credit Business (2019-2024) & (US$ Million)
- Table 105. Swiss Climate Main Business
- Table 106. Forliance Details, Company Type, Voluntary Carbon Offsets Area Served and Its Competitors
- Table 107. Forliance Voluntary Carbon Offsets Product Offered
- Table 108. Forliance Revenue in Trading of Carbon Credit Business (2019-2024) & (US$ Million)
- Table 109. Forliance Main Business
- Table 110. Bluesource Details, Company Type, Voluntary Carbon Offsets Area Served and Its Competitors
- Table 111. Bluesource Voluntary Carbon Offsets Product Offered
- Table 112. Bluesource Revenue in Trading of Carbon Credit Business (2019-2024) & (US$ Million)
- Table 113. Bluesource Main Business
- Table 114. GreenTrees Details, Company Type, Voluntary Carbon Offsets Area Served and Its Competitors
- Table 115. GreenTrees Voluntary Carbon Offsets Product Offered
- Table 116. GreenTrees Revenue in Trading of Carbon Credit Business (2019-2024) & (US$ Million)
- Table 117. GreenTrees Main Business
- Table 118. NativeEnergy Details, Company Type, Voluntary Carbon Offsets Area Served and Its Competitors
- Table 119. NativeEnergy Voluntary Carbon Offsets Product Offered
- Table 120. NativeEnergy Revenue in Trading of Carbon Credit Business (2019-2024) & (US$ Million)
- Table 121. NativeEnergy Main Business
- Table 122. NatureOffice GmbH Details, Company Type, Voluntary Carbon Offsets Area Served and Its Competitors
- Table 123. NatureOffice GmbH Voluntary Carbon Offsets Product Offered
- Table 124. NatureOffice GmbH Revenue in Trading of Carbon Credit Business (2019-2024) & (US$ Million)
- Table 125. NatureOffice GmbH Main Business
- Table 126. Element Markets Details, Company Type, Voluntary Carbon Offsets Area Served and Its Competitors
- Table 127. Element Markets Voluntary Carbon Offsets Product Offered
- Table 128. Element Markets Revenue in Trading of Carbon Credit Business (2019-2024) & (US$ Million)
- Table 129. Element Markets Main Business
- Table 130. Bischoff & Ditze Energy GmbH Details, Company Type, Voluntary Carbon Offsets Area Served and Its Competitors
- Table 131. Bischoff & Ditze Energy GmbH Voluntary Carbon Offsets Product Offered
- Table 132. Bischoff & Ditze Energy GmbH Revenue in Trading of Carbon Credit Business (2019-2024) & (US$ Million)
- Table 133. Bischoff & Ditze Energy GmbH Main Business
- Table 134. Bioassets Details, Company Type, Voluntary Carbon Offsets Area Served and Its Competitors
- Table 135. Bioassets Voluntary Carbon Offsets Product Offered
- Table 136. Bioassets Revenue in Trading of Carbon Credit Business (2019-2024) & (US$ Million)
- Table 137. Bioassets Main Business
- Table 138. UPM Umwelt-Projekt-Management GmbH Details, Company Type, Voluntary Carbon Offsets Area Served and Its Competitors
- Table 139. UPM Umwelt-Projekt-Management GmbH Voluntary Carbon Offsets Product Offered
- Table 140. UPM Umwelt-Projekt-Management GmbH Revenue in Trading of Carbon Credit Business (2019-2024) & (US$ Million)
- Table 141. UPM Umwelt-Projekt-Management GmbH Main Business
- Table 142. Carbon Credit Capital Details, Company Type, Voluntary Carbon Offsets Area Served and Its Competitors
- Table 143. Carbon Credit Capital Voluntary Carbon Offsets Product Offered
- Table 144. Carbon Credit Capital Revenue in Trading of Carbon Credit Business (2019-2024) & (US$ Million)
- Table 145. Carbon Credit Capital Main Business
- Table 146. CBEEX Details, Company Type, Voluntary Carbon Offsets Area Served and Its Competitors
- Table 147. CBEEX Voluntary Carbon Offsets Product Offered
- Table 148. CBEEX Revenue in Trading of Carbon Credit Business (2019-2024) & (US$ Million)
- Table 149. CBEEX Main Business
- Table 150. Biofilica Details, Company Type, Voluntary Carbon Offsets Area Served and Its Competitors
- Table 151. Biofilica Voluntary Carbon Offsets Product Offered
- Table 152. Biofilica Revenue in Trading of Carbon Credit Business (2019-2024) & (US$ Million)
- Table 153. Biofilica Main Business
- Table 154. Research Programs/Design for This Report
- Table 155. Key Data Information from Secondary Sources
- Table 156. Key Data Information from Primary Sources
List of Figures
- Figure 1. World Carbon Dioxide Emissions from 1965 to 2022, by region (in million metric tons of carbon dioxide)*
- Figure 2. Voluntary Carbon Offset Top Carbon Certifiers/Registries
- Figure 3. Global Trading of Carbon Credit Market Size Growth Rate , 2019 VS 2024 VS 2030 (US$ Million)
- Figure 4. Global Trading of Carbon Credit Market Share : 2023 VS 2030
- Figure 5. Global Trading of Carbon Credit Market Size Growth Rate by Application, 2019 VS 2024 VS 2030 (US$ Million)
- Figure 6. Global Trading of Carbon Credit Market Share by Application: 2023 VS 2030
- Figure 7. Trading of Carbon Credit Report Years Considered
- Figure 8. Trading of Carbon Credit Carbon Dioxide Equivalent (Million tCO2e), Year-over-Year: 2019-2030
- Figure 9. Voluntary Carbon Offset Price, Year-over-Year: 2019-2030
- Figure 10. Global Trading of Carbon Credit Market Size (US$ Million), Year-over-Year: 2019-2030
- Figure 11. Global Trading of Carbon Credit Market Size, (US$ Million), 2019 VS 2024 VS 2030
- Figure 12. Global Trading of Carbon Credit Market Share by Region: 2023 VS 2030
- Figure 13. Regional Energy Demand Growth by region, 2015'2040 from OPEC
- Figure 14. The Outlook Considers the Energy Transition through Three Different Lenses: sectors, regions and fuels from BP
- Figure 15. Energy Consumption Structure from Exxon Mobil
- Figure 16. Voluntary Carbon Market Status and Potential Market
- Figure 17. Summary map of regional, national and subnational carbon pricing initiatives implemented, scheduled for implementation and under consideration (ETS and carbon tax)
- Figure 18. Locations of Voluntary Carbon Offset Projects, 2008-2018
- Figure 19. Global Trading of Carbon Credit Market Share by Players in 2023
- Figure 20. Global Top Trading of Carbon Credit Players by Company Type (Tier 1, Tier 2, and Tier 3) & (based on the Revenue in Trading of Carbon Credit as of 2023)
- Figure 21. The Top 5 Players Market Share by Trading of Carbon Credit Revenue in 2023
- Figure 22. North America Trading of Carbon Credit Market Size YoY Growth (2019-2030) & (US$ Million)
- Figure 23. Major Customers of Voluntary Carbon Offsets in North America
- Figure 24. North America Trading of Carbon Credit Market Share (2019-2030)
- Figure 25. North America Trading of Carbon Credit Market Share by Application (2019-2030)
- Figure 26. North America Trading of Carbon Credit Market Share by Country (2019-2030)
- Figure 27. United States Trading of Carbon Credit Market Size YoY Growth (2019-2030) & (US$ Million)
- Figure 28. Canada Trading of Carbon Credit Market Size YoY Growth (2019-2030) & (US$ Million)
- Figure 29. Mexico Trading of Carbon Credit Market Size YoY Growth (2019-2030) & (US$ Million)
- Figure 30. Europe Trading of Carbon Credit Market Size YoY Growth (2019-2030) & (US$ Million)
- Figure 31. Europe Trading of Carbon Credit Market Share (2019-2030)
- Figure 32. Europe Trading of Carbon Credit Market Share by Application (2019-2030)
- Figure 33. Europe Trading of Carbon Credit Market Share by Country (2019-2030)
- Figure 34. Germany Trading of Carbon Credit Market Size YoY Growth (2019-2030) & (US$ Million)
- Figure 35. France Trading of Carbon Credit Market Size YoY Growth (2019-2030) & (US$ Million)
- Figure 36. U.K. Trading of Carbon Credit Market Size YoY Growth (2019-2030) & (US$ Million)
- Figure 37. Netherlands Trading of Carbon Credit Market Size YoY Growth (2019-2030) & (US$ Million)
- Figure 38. Switzerland Trading of Carbon Credit Market Size YoY Growth (2019-2030) & (US$ Million)
- Figure 39. China Trading of Carbon Credit Market Size YoY Growth (2019-2030) & (US$ Million)
- Figure 40. China Trading of Carbon Credit Market Share (2019-2030)
- Figure 41. China Trading of Carbon Credit Market Share by Application (2019-2030)
- Figure 42. Asia Trading of Carbon Credit Market Size YoY Growth (2019-2030) & (US$ Million)
- Figure 43. Asia Trading of Carbon Credit Market Share (2019-2030)
- Figure 44. Asia Trading of Carbon Credit Market Share by Application (2019-2030)
- Figure 45. Asia Trading of Carbon Credit Market Share by Region (2019-2030)
- Figure 46. Japan Trading of Carbon Credit Market Size YoY Growth (2019-2030) & (US$ Million)
- Figure 47. South Korea Trading of Carbon Credit Market Size YoY Growth (2019-2030) & (US$ Million)
- Figure 48. Southeast Asia Trading of Carbon Credit Market Size YoY Growth (2019-2030) & (US$ Million)
- Figure 49. India Trading of Carbon Credit Market Size YoY Growth (2019-2030) & (US$ Million)
- Figure 50. Australia Trading of Carbon Credit Market Size YoY Growth (2019-2030) & (US$ Million)
- Figure 51. Middle East, Africa, and Latin America Trading of Carbon Credit Market Size YoY Growth (2019-2030) & (US$ Million)
- Figure 52. Middle East, Africa, and Latin America Trading of Carbon Credit Market Share (2019-2030)
- Figure 53. Middle East, Africa, and Latin America Trading of Carbon Credit Market Share by Application (2019-2030)
- Figure 54. Middle East, Africa, and Latin America Trading of Carbon Credit Market Share by Country (2019-2030)
- Figure 55. Brazil Trading of Carbon Credit Market Size YoY Growth (2019-2030) & (US$ Million)
- Figure 56. Argentina Trading of Carbon Credit Market Size YoY Growth (2019-2030) & (US$ Million)
- Figure 57. Middle East Trading of Carbon Credit Market Size YoY Growth (2019-2030) & (US$ Million)
- Figure 58. Africa Trading of Carbon Credit Market Size YoY Growth (2019-2030) & (US$ Million)
- Figure 59. Bottom-up and Top-down Approaches for This Report
- Figure 60. Data Triangulation
- Figure 61. Key Executives Interviewed
The global Trading of Carbon Credit market is projected to grow from US$ 1,885.15 million in 2024 to US$ 4,648.05 million by 2030, at a Compound Annual Growth Rate (CAGR) of 16.23% during the forecast period.
The North America market for Trading of Carbon Credit is estimated to increase from $ 637.12 million in 2024 to reach $ 1,400.05 million by 2030, at a CAGR of 14.02% during the forecast period of 2024 through 2030.
The China market for Trading of Carbon Credit is estimated to increase from $ 57.00 million in 2024 to reach $ 330.15 million by 2030, at a CAGR of 34.01% during the forecast period of 2024 through 2030.
The Europe market for Trading of Carbon Credit is estimated to increase from $ 903.64 million in 2024 to reach $ 1,971.45 million by 2030, at a CAGR of 13.88% during the forecast period of 2024 through 2030.
The global key companies of Trading of Carbon Credit include South Pole Group, 3Degrees, ClimatePartner GmbH, Green Mountain Energy, EcoAct, MyClimate, First Climate Markets AG, Terrapass, and Schneider, etc. In 2023, the global top five players had a share approximately 28.06% in terms of revenue.
Report Includes
This report presents an overview of global market for Trading of Carbon Credit market size. Analyses of the global market trends, with historic market revenue data for 2019 - 2023, estimates for 2024, and projections of CAGR through 2030.
This report researches the key producers of Trading of Carbon Credit, also provides the revenue of main regions and countries. Highlights of the upcoming market potential for Trading of Carbon Credit, and key regions/countries of focus to forecast this market into various segments and sub-segments. Country specific data and market value analysis for the U.S., Canada, Mexico, Brazil, China, Japan, South Korea, Southeast Asia, India, Germany, the U.K., Italy, Middle East, Africa, and Other Countries.
This report focuses on the Trading of Carbon Credit revenue, market share and industry ranking of main companies, data from 2019 to 2024. Identification of the major stakeholders in the global Trading of Carbon Credit market, and analysis of their competitive landscape and market positioning based on recent developments and segmental revenues. This report will help stakeholders to understand the competitive landscape and gain more insights and position their businesses and market strategies in a better way.
This report analyzes the segments data and by Application, revenue, and growth rate, from 2019 to 2030. Evaluation and forecast the market size for Trading of Carbon Credit revenue, projected growth trends, production technology, application and end-user industry.
Descriptive company profiles of the major global players, including South Pole Group, 3Degrees, ClimatePartner GmbH, Green Mountain Energy, EcoAct, MyClimate, First Climate Markets AG, Terrapass, and Schneider, etc.
Market Segmentation
By Company
- South Pole Group
- 3Degrees
- ClimatePartner GmbH
- Green Mountain Energy
- EcoAct
- MyClimate
- First Climate Markets AG
- Terrapass
- Schneider
- Aera Group
- Allcot Group
- Swiss Climate
- Forliance
- Bluesource
- GreenTrees
- NativeEnergy
- NatureOffice GmbH
- Element Markets
- Bischoff & Ditze Energy GmbH
- Bioassets
- UPM Umwelt-Projekt-Management GmbH
- Carbon Credit Capital
- CBEEX
- Biofilica
Segment
- Forestry
- Renewable Energy
- Waste Disposal
- Others
Segment by Application
- Personal
- Enterprise
By Region
- North America
- United States
- Canada
- Mexico
- Asia-Pacific
- China
- Japan
- South Korea
- Southeast Asia
- India
- Australia
- Europe
- Germany
- UK
- France
- Netherlands
- Switzerland
- Rest of Europe
- Middle East, Africa and South America
- Brazil
- Argentina
- Middle East
- Africa
Chapter Outline
Chapter 1: Introduces the report scope of the report, executive summary of different market segments (product type, application, etc), including the market size of each market segment, future development potential, and so on. It offers a high-level view of the current state of the market and its likely evolution in the short to mid-term, and long term.
Chapter 2: Revenue of Trading of Carbon Credit in global and regional level. It provides a quantitative analysis of the market size and development potential of each region and its main countries and introduces the market development, future development prospects, market space, and capacity of each country in the world. This section also introduces the market dynamics, latest developments of the market, the driving factors and restrictive factors of the market, the challenges and risks faced by companies in the industry, and the analysis of relevant policies in the industry.
Chapter 3: Detailed analysis of Trading of Carbon Credit companies competitive landscape, revenue, market share and industry ranking, latest development plan, merger, and acquisition information, etc.
Chapter 4: Provides the analysis of various market segments , covering the revenue, and development potential of each market segment, to help readers find the blue ocean market in different market segments.
Chapter 5: Provides the analysis of various market segments by Application, covering the revenue, and development potential of each market segment, to help readers find the blue ocean market in different downstream markets.
Chapter 6: North America (US & Canada) , by Application and by country, revenue for each segment.
Chapter 7: Europe , by Application and by country, revenue for each segment.
Chapter 8: China , and by Application, revenue for each segment.
Chapter 9: Asia (excluding China) , by Application and by region, revenue for each segment.
Chapter 10: Middle East, Africa, and Latin America , by Application and by country, revenue for each segment.
Chapter 11: Provides profiles of key companies, introducing the basic situation of the main companies in the market in detail, including product descriptions and specifications, Trading of Carbon Credit revenue, gross margin, and recent development, etc.
Chapter 12: Analyst Viewpoints/Conclusions
Table of Contents
1 Report Overview
- 1.1 Study Scope
- 1.2 Market Analysis
- 1.2.1 Global Trading of Carbon Credit Market Size Growth Rate: 2019 VS 2024 VS 2030
- 1.2.2 Forestry
- 1.2.3 Renewable Energy
- 1.2.4 Waste Disposal
- 1.3 Market by Application
- 1.3.1 Global Trading of Carbon Credit Market Share by Application: 2019 VS 2024 VS 2030
- 1.3.2 Personal
- 1.3.3 Enterprise
- 1.4 Assumptions and Limitations
- 1.5 Study Objectives
- 1.6 Years Considered
2 Global Growth Trends
- 2.1 Carbon Dioxide Equivalent and Price Analyze (2019-2030)
- 2.2 Global Trading of Carbon Credit Market Perspective (2019-2030)
- 2.3 Global Trading of Carbon Credit Growth Trends by Region
- 2.3.1 Global Trading of Carbon Credit Market Size by Region: 2019 VS 2024 VS 2030
- 2.3.2 Trading of Carbon Credit Historic Market Size by Region (2019-2024)
- 2.3.3 Trading of Carbon Credit Forecasted Market Size by Region (2025-2030)
- 2.4 Trading of Carbon Credit Market Dynamics
- 2.4.1 Trading of Carbon Credit Industry Trends
- 2.4.2 Trading of Carbon Credit Market Drivers
- 2.4.3 Trading of Carbon Credit Market Challenges
- 2.4.4 Trading of Carbon Credit Market Restraints
3 Competition Landscape by Key Players
- 3.1 Global Revenue Trading of Carbon Credit by Players
- 3.1.1 Global Trading of Carbon Credit Revenue by Players (2019-2024)
- 3.1.2 Global Trading of Carbon Credit Revenue Market Share by Players (2019-2024)
- 3.2 Global Trading of Carbon Credit Market Share by Company Type (Tier 1, Tier 2, and Tier 3)
- 3.3 Global Key Players of Trading of Carbon Credit, Ranking by Revenue, 2022 VS 2023 VS 2024
- 3.4 Global Trading of Carbon Credit Market Concentration Ratio
- 3.4.1 Global Trading of Carbon Credit Market Concentration Ratio
- 3.4.2 Global Top 5 Companies by Trading of Carbon Credit Revenue in 2023
- 3.5 Global Key Players of Trading of Carbon Credit Head office and Area Served
- 3.6 Global Key Players of Trading of Carbon Credit, Product and Application
- 3.7 Mergers & Acquisitions, Expansion Plans
4 Trading of Carbon Credit Breakdown Data
- 4.1 Global Trading of Carbon Credit Historic Market Size (2019-2024)
- 4.2 Global Trading of Carbon Credit Forecasted Market Size (2025-2030)
5 Trading of Carbon Credit Breakdown Data by Application
- 5.1 Global Trading of Carbon Credit Historic Market Size by Application (2019-2024)
- 5.2 Global Trading of Carbon Credit Forecasted Market Size by Application (2025-2030)
6 North America
- 6.1 North America Trading of Carbon Credit Market Size (2019-2030)
- 6.2 North America Trading of Carbon Credit Market Size
- 6.2.1 North America Trading of Carbon Credit Market Size (2019-2024)
- 6.2.2 North America Trading of Carbon Credit Market Size (2025-2030)
- 6.2.3 North America Trading of Carbon Credit Market Share (2019-2030)
- 6.3 North America Trading of Carbon Credit Market Size by Application
- 6.3.1 North America Trading of Carbon Credit Market Size by Application (2019-2024)
- 6.3.2 North America Trading of Carbon Credit Market Size by Application (2025-2030)
- 6.3.3 North America Trading of Carbon Credit Market Share by Application (2019-2030)
- 6.4 North America Trading of Carbon Credit Market Size by Country
- 6.4.1 North America Trading of Carbon Credit Market Size by Country: 2019 VS 2024 VS 2030
- 6.4.2 North America Trading of Carbon Credit Market Size by Country (2019-2024)
- 6.4.3 North America Trading of Carbon Credit Market Share by Country (2025-2030)
- 6.4.4 United States
- 6.4.5 Canada
- 6.4.6 Mexico
7 Europe
- 7.1 Europe Trading of Carbon Credit Market Size (2019-2030)
- 7.2 Europe Trading of Carbon Credit Market Size
- 7.2.1 Europe Trading of Carbon Credit Market Size (2019-2024)
- 7.2.2 Europe Trading of Carbon Credit Market Size (2025-2030)
- 7.2.3 Europe Trading of Carbon Credit Market Share (2019-2030)
- 7.3 Europe Trading of Carbon Credit Market Size by Application
- 7.3.1 Europe Trading of Carbon Credit Market Size by Application (2019-2024)
- 7.3.2 Europe Trading of Carbon Credit Market Size by Application (2025-2030)
- 7.3.3 Europe Trading of Carbon Credit Market Share by Application (2019-2030)
- 7.4 Europe Trading of Carbon Credit Market Size by Country
- 7.4.1 Europe Trading of Carbon Credit Market Size by Country: 2019 VS 2024 VS 2030
- 7.4.2 Europe Trading of Carbon Credit Market Size by Country (2019-2024)
- 7.4.3 Europe Trading of Carbon Credit Market Size by Country (2025-2030)
- 7.4.4 Germany
- 7.4.5 France
- 7.4.6 U.K.
- 7.4.7 Netherlands
- 7.4.8 Switzerland
8 China
- 8.1 China Trading of Carbon Credit Market Size (2019-2030)
- 8.2 China Trading of Carbon Credit Market Size
- 8.2.1 China Trading of Carbon Credit Market Size (2019-2024)
- 8.2.2 China Trading of Carbon Credit Market Size (2025-2030)
- 8.2.3 China Trading of Carbon Credit Market Share (2019-2030)
- 8.3 China Trading of Carbon Credit Market Size by Application
- 8.3.1 China Trading of Carbon Credit Market Size by Application (2019-2024)
- 8.3.2 China Trading of Carbon Credit Market Size by Application (2025-2030)
- 8.3.3 China Trading of Carbon Credit Market Share by Application (2019-2030)
9 Asia (excluding China)
- 9.1 Asia Trading of Carbon Credit Market Size (2019-2030)
- 9.2 Asia Trading of Carbon Credit Market Size
- 9.2.1 Asia Trading of Carbon Credit Market Size (2019-2024)
- 9.2.2 Asia Trading of Carbon Credit Market Size (2025-2030)
- 9.2.3 Asia Trading of Carbon Credit Market Share (2019-2030)
- 9.3 Asia Trading of Carbon Credit Market Size by Application
- 9.3.1 Asia Trading of Carbon Credit Market Size by Application (2019-2024)
- 9.3.2 Asia Trading of Carbon Credit Market Size by Application (2025-2030)
- 9.3.3 Asia Trading of Carbon Credit Market Share by Application (2019-2030)
- 9.4 Asia Trading of Carbon Credit Market Size by Region
- 9.4.1 Asia Trading of Carbon Credit Market Size by Region: 2019 VS 2024 VS 2030
- 9.4.2 Asia Trading of Carbon Credit Market Size by Region (2019-2024)
- 9.4.3 Asia Trading of Carbon Credit Market Size by Region (2025-2030)
- 9.4.4 Japan
- 9.4.5 South Korea
- 9.4.6 Southeast Asia
- 9.4.7 India
- 9.4.8 Australia
10 Middle East, Africa, and Latin America
- 10.1 Middle East, Africa, and Latin America Trading of Carbon Credit Market Size (2019-2030)
- 10.2 Middle East, Africa, and Latin America Trading of Carbon Credit Market Size
- 10.2.1 Middle East, Africa, and Latin America Trading of Carbon Credit Market Size (2019-2024)
- 10.2.2 Middle East, Africa, and Latin America Trading of Carbon Credit Market Size (2025-2030)
- 10.2.3 Middle East, Africa, and Latin America Trading of Carbon Credit Market Share (2019-2030)
- 10.3 Middle East, Africa, and Latin America Trading of Carbon Credit Market Size by Application
- 10.3.1 Middle East, Africa, and Latin America Trading of Carbon Credit Market Size by Application (2019-2024)
- 10.3.2 Middle East, Africa, and Latin America Trading of Carbon Credit Market Size by Application (2025-2030)
- 10.3.3 Middle East, Africa, and Latin America Trading of Carbon Credit Market Share by Application (2019-2030)
- 10.4 Middle East, Africa, and Latin America Trading of Carbon Credit Market Size by Country
- 10.4.1 Middle East, Africa, and Latin America Trading of Carbon Credit Market Size by Country: 2019 VS 2024 VS 2030
- 10.4.2 Middle East, Africa, and Latin America Trading of Carbon Credit Market Size by Country (2019-2024)
- 10.4.3 Middle East, Africa, and Latin America Trading of Carbon Credit Market Size by Country (2025-2030)
- 10.4.4 Brazil
- 10.4.5 Argentina
- 10.4.6 Middle East
- 10.4.7 Africa
11 Key Players Profiles
- 11.1 South Pole Group
- 11.1.1 South Pole Group Company Information
- 11.1.2 South Pole Group Voluntary Carbon Offsets Product Offered
- 11.1.3 South Pole Group Revenue in Trading of Carbon Credit Business (2019-2024)
- 11.1.4 South Pole Group Main Business Overview
- 11.2 3Degrees
- 11.2.1 3Degrees Company Information
- 11.2.2 3Degrees Voluntary Carbon Offsets Product Offered
- 11.2.3 3Degrees Revenue in Trading of Carbon Credit Business (2019-2024)
- 11.2.4 3Degrees Main Business Overview
- 11.3 ClimatePartner GmbH
- 11.3.1 ClimatePartner GmbH Company Information
- 11.3.2 ClimatePartner GmbH Voluntary Carbon Offsets Product Offered
- 11.3.3 ClimatePartner GmbH Revenue in Trading of Carbon Credit Business (2019-2024)
- 11.3.4 ClimatePartner GmbH Main Business Overview
- 11.4 Green Mountain Energy
- 11.4.1 Green Mountain Energy Company Information
- 11.4.2 Green Mountain Energy Voluntary Carbon Offsets Product Offered
- 11.4.3 Green Mountain Energy Revenue in Trading of Carbon Credit Business (2019-2024)
- 11.4.4 Green Mountain Energy Main Business Overview
- 11.5 EcoAct
- 11.5.1 EcoAct Company Information
- 11.5.2 EcoAct Voluntary Carbon Offsets Product Offered
- 11.5.3 EcoAct Revenue in Trading of Carbon Credit Business (2019-2024)
- 11.5.4 EcoAct Main Business Overview
- 11.6 MyClimate
- 11.6.1 MyClimate Company Information
- 11.6.2 MyClimate Voluntary Carbon Offsets Product Offered
- 11.6.3 MyClimate Revenue in Trading of Carbon Credit Business (2019-2024)
- 11.6.4 MyClimate Main Business Overview
- 11.7 First Climate Markets AG
- 11.7.1 First Climate Markets AG Company Information
- 11.7.2 First Climate Markets AG Voluntary Carbon Offsets Product Offered
- 11.7.3 First Climate Markets AG Revenue in Trading of Carbon Credit Business (2019-2024)
- 11.7.4 First Climate Markets AG Main Business Overview
- 11.8 Terrapass
- 11.8.1 Terrapass Company Information
- 11.8.2 Terrapass Voluntary Carbon Offsets Product Offered
- 11.8.3 Terrapass Revenue in Trading of Carbon Credit Business (2019-2024)
- 11.8.4 Terrapass Main Business Overview
- 11.9 Schneider
- 11.9.1 Schneider Company Information
- 11.9.2 Schneider Voluntary Carbon Offsets Product Offered
- 11.9.3 Schneider Revenue in Trading of Carbon Credit Business (2019-2024)
- 11.9.4 Schneider Main Business Overview
- 11.10 Aera Group
- 11.10.1 Aera Group Company Information
- 11.10.2 Aera Group Voluntary Carbon Offsets Product Offered
- 11.10.3 Aera Group Revenue in Trading of Carbon Credit Business (2019-2024)
- 11.10.4 Aera Group Main Business Overview
- 11.11 Allcot Group
- 11.11.1 Allcot Group Company Information
- 11.11.2 Allcot Group Voluntary Carbon Offsets Product Offered
- 11.11.3 Allcot Group Revenue in Trading of Carbon Credit Business (2019-2024)
- 11.11.4 Allcot Group Main Business Overview
- 11.12 Swiss Climate
- 11.12.1 Swiss Climate Company Information
- 11.12.2 Swiss Climate Voluntary Carbon Offsets Product Offered
- 11.12.3 Swiss Climate Revenue in Trading of Carbon Credit Business (2019-2024)
- 11.12.4 Swiss Climate Main Business Overview
- 11.13 Forliance
- 11.13.1 Forliance Company Information
- 11.13.2 Forliance Voluntary Carbon Offsets Product Offered
- 11.13.3 Forliance Revenue in Trading of Carbon Credit Business (2019-2024)
- 11.13.4 Forliance Main Business Overview
- 11.14 Bluesource
- 11.14.1 Bluesource Company Information
- 11.14.2 Bluesource Voluntary Carbon Offsets Product Offered
- 11.14.3 Bluesource Revenue in Trading of Carbon Credit Business (2019-2024)
- 11.14.4 Bluesource Main Business Overview
- 11.15 GreenTrees
- 11.15.1 GreenTrees Company Information
- 11.15.2 GreenTrees Voluntary Carbon Offsets Product Offered
- 11.15.3 GreenTrees Revenue in Trading of Carbon Credit Business (2019-2024)
- 11.15.4 GreenTrees Main Business Overview
- 11.16 NativeEnergy
- 11.16.1 NativeEnergy Company Information
- 11.16.2 NativeEnergy Voluntary Carbon Offsets Product Offered
- 11.16.3 NativeEnergy Revenue in Trading of Carbon Credit Business (2019-2024)
- 11.16.4 NativeEnergy Main Business Overview
- 11.17 NatureOffice GmbH
- 11.17.1 NatureOffice GmbH Company Information
- 11.17.2 NatureOffice GmbH Voluntary Carbon Offsets Product Offered
- 11.17.3 NatureOffice GmbH Revenue in Trading of Carbon Credit Business (2019-2024)
- 11.17.4 NatureOffice GmbH Main Business Overview
- 11.18 Element Markets
- 11.18.1 Element Markets Company Information
- 11.18.2 Element Markets Voluntary Carbon Offsets Product Offered
- 11.18.3 Element Markets Revenue in Trading of Carbon Credit Business (2019-2024)
- 11.18.4 Element Markets Main Business Overview
- 11.19 Bischoff & Ditze Energy GmbH
- 11.19.1 Bischoff & Ditze Energy GmbH Company Information
- 11.19.2 Bischoff & Ditze Energy GmbH Voluntary Carbon Offsets Product Offered
- 11.19.3 Bischoff & Ditze Energy GmbH Revenue in Trading of Carbon Credit Business (2019-2024)
- 11.19.4 Bischoff & Ditze Energy GmbH Main Business Overview
- 11.20 Bioassets
- 11.20.1 Bioassets Company Information
- 11.20.2 Bioassets Voluntary Carbon Offsets Product Offered
- 11.20.3 Bioassets Revenue in Trading of Carbon Credit Business (2019-2024)
- 11.20.4 Bioassets Main Business Overview
- 11.21 UPM Umwelt-Projekt-Management GmbH
- 11.21.1 UPM Umwelt-Projekt-Management GmbH Company Information
- 11.21.2 UPM Umwelt-Projekt-Management GmbH Voluntary Carbon Offsets Product Offered
- 11.21.3 UPM Umwelt-Projekt-Management GmbH Revenue in Trading of Carbon Credit Business (2019-2024)
- 11.21.4 UPM Umwelt-Projekt-Management GmbH Main Business Overview
- 11.22 Carbon Credit Capital
- 11.22.1 Carbon Credit Capital Company Information
- 11.22.2 Carbon Credit Capital Voluntary Carbon Offsets Product Offered
- 11.22.3 Carbon Credit Capital Revenue in Trading of Carbon Credit Business (2019-2024)
- 11.22.4 Carbon Credit Capital Main Business Overview
- 11.23 CBEEX
- 11.23.1 CBEEX Company Information
- 11.23.2 CBEEX Voluntary Carbon Offsets Product Offered
- 11.23.3 CBEEX Revenue in Trading of Carbon Credit Business (2019-2024)
- 11.23.4 CBEEX Main Business Overview
- 11.24 Biofilica
- 11.24.1 Biofilica Company Information
- 11.24.2 Biofilica Voluntary Carbon Offsets Product Offered
- 11.24.3 Biofilica Revenue in Trading of Carbon Credit Business (2019-2024)
- 11.24.4 Biofilica Main Business Overview
12 Analyst's Viewpoints/Conclusions
13 Appendix
- 13.1 Research Methodology
- 13.1.1 Methodology/Research Approach
- 13.1.2 Data Source
- 13.2 Author Details
- 13.3 Disclaimer159

