
カーボンクレジット市場の機会、成長要因、業界動向分析、および2026年から2035年までの予測
Carbon Credit Market Opportunity, Growth Drivers, Industry Trend Analysis, and Forecast 2026 - 2035- 発行日
- ページ情報
- 英文 151 Pages
- 納期
- 2~3営業日
- 商品コード
- 1936643
- カスタマイズ可能 お客様のご希望に応じて、既存データの加工や未掲載情報(例:国別セグメント)の追加などの対応が可能です。詳細はお問い合わせください。
- 翻訳ツール提供対象 PDF対応AI翻訳ツールの無料貸し出しサービスのご利用が可能です
世界の炭素クレジット市場は、2025年に1,143億米ドルと評価され、2035年までにCAGR 15.9%で成長し、4,820億米ドルに達すると予測されています。
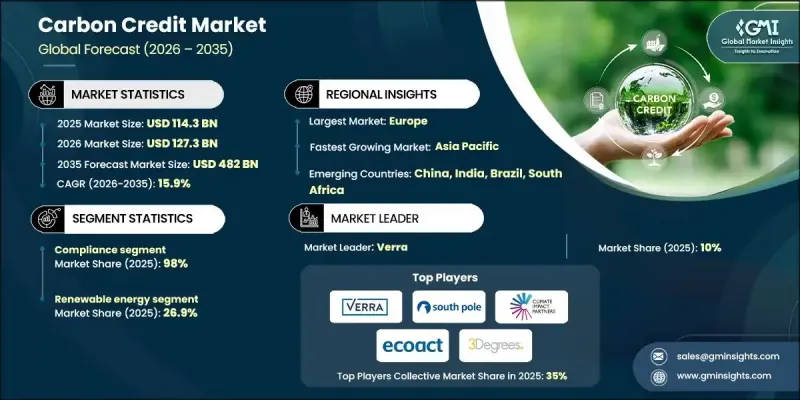
市場成長は、世界の気候規制の強化、企業のネットゼロ目標の増加、温室効果ガス排出削減のための市場ベースのメカニズムの採用拡大によって推進されています。カーボンクレジットは、政府や企業が排出量を相殺すると同時に、再生可能エネルギー、森林再生、メタン回収などの気候変動緩和プロジェクトを支援する重要な金融手段として台頭しています。カーボン市場が各国の気候政策や排出量取引制度に統合される動きが進むことで、市場の透明性と流動性が向上しています。さらに、投資家や消費者からの環境説明責任への圧力が高まっていることから、組織は長期的な持続可能性戦略の一環として、カーボンクレジット取引に積極的に参加することを迫られています。
| 市場範囲 | |
|---|---|
| 開始年 | 2025年 |
| 予測年度 | 2026-2035 |
| 開始時価値 | 1,143億米ドル |
| 予測金額 | 4,820億米ドル |
| CAGR | 15.9% |
種類別では、規制対象排出量取引制度における義務的な排出削減枠組みにより、コンプライアンス炭素クレジットセグメントが2025年に98%のシェアを占めました。コンプライアンス市場は主に、発電、製造、重工業セクターに課せられた厳格な規制要件によって推進されており、これらは炭素排出量を制限することを目的としています。これらのクレジットは、規制対象事業体に排出目標を達成する柔軟性を提供すると同時に、事業継続性を維持することを可能にします。標準化された検証メカニズム、政府の監督、予測可能な需要といった利点により、コンプライアンス炭素クレジットは世界の脱炭素化の取り組みの基盤となっています。
再生可能エネルギーセグメントは、化石燃料への依存度低減を目的とした風力、太陽光、水力、バイオエネルギープロジェクトへの大規模投資により、2025年には26.9%のシェアを占めました。再生可能エネルギープロジェクトは、炭素集約型発電を代替することでカーボンクレジットを創出するため、コンプライアンス市場と自主的市場の双方において非常に魅力的です。公益事業会社、独立系発電事業者、プロジェクト開発者は、プロジェクトの実行可能性を高め、追加的な収益源を確保するために、これらのクレジットを収益化するケースが増加しています。この分野は、強力な政策支援、長期電力購入契約、クリーンエネルギーを基盤としたオフセットに対する企業の需要拡大の恩恵を受けています。
欧州のカーボンクレジット市場は、確立されたEU排出量取引制度(EU ETS)に支えられ、2026年から2035年にかけてCAGR15.9%で拡大する見込みです。同地域は、厳格な気候規制、先進的な監視枠組み、カーボンニュートラルに向けた強い政治的コミットメントの恩恵を受けています。欧州の産業は、排出上限を遵守しつつ運営コストを最適化するため、炭素取引に積極的に参加しております。国境を越えた取引メカニズムの拡大と、EU排出量取引制度への追加セクターの統合が進むことで、欧州は世界の炭素クレジットエコシステムにおける主導的立場をさらに強化し続けております。
よくあるご質問
目次
第1章 調査手法と範囲
第2章 エグゼクティブサマリー
第3章 業界考察
- エコシステム分析
- 規制情勢
- 業界への影響要因
- 促進要因
- 業界の潜在的リスク&課題
- 成長可能性分析
- ポーター分析
- PESTEL分析
- 新たな機会と動向
- デジタル化とIoT統合
- 新興市場への進出
第4章 競合情勢
- イントロダクション
- 企業の市場シェア分析
- 北米
- 欧州
- アジア太平洋地域
- 中東・アフリカ
- ラテンアメリカ
- 戦略的取り組み
- 競合ベンチマーキング
- 戦略的ダッシュボード
- イノベーションと技術動向
第5章 市場規模・予測:タイプ別、2022-2035
- 自主的
- コンプライアンス
第6章 市場規模・予測:ソース別、2022-2035
- 農業
- 炭素回収・貯留
- 化学プロセス
- エネルギー効率化
- 産業分野
- 林業・土地利用
- 再生可能エネルギー
- 交通機関
- 廃棄物管理
- その他
第7章 市場規模・予測:地域別、2022-2035
- 北米
- 欧州
- アジア太平洋地域
- 中東・アフリカ
- ラテンアメリカ
第8章 企業プロファイル
- 3Degrees
- Allcot
- Atmosfair
- Carbon Clear
- Carbon Collective Company
- Carbon Credit Capital
- Carbonmark
- Carbonplace
- Climate Impact Partners
- Climeco
- EcoAct
- Ecosecurities
- Green Mountain Energy
- Shell
- South Pole
- Sterling Planet
- Terrapass
- The Carbon Trust
- Verra
- WGL Holdings
- 発行日
- 発行
- Global Market Insights Inc.
- ページ情報
- 英文 151 Pages
- 納期
- 2~3営業日