|
|
市場調査レポート
商品コード
1336059
カーボンクレジットの日本市場の評価:タイプ別、エンドユーザー別、地域別、機会、予測(2017年度~2031年度)Japan Carbon Credit Market Assessment, By Type, By End-user, By Region, Opportunities and Forecast, FY2017-FY2031F |
||||||
|
|
|||||||
カスタマイズ可能
|
|||||||


| カーボンクレジットの日本市場の評価:タイプ別、エンドユーザー別、地域別、機会、予測(2017年度~2031年度) |
|
出版日: 2023年08月22日
発行: Market Xcel - Markets and Data
ページ情報: 英文 86 Pages
納期: 3~5営業日
|

- 全表示
- 概要
- 図表
- 目次
日本のカーボンクレジットの市場規模は、2023年度に282億米ドル、2031年度に1,215億米ドルに達し、2024年度~2031年度の予測期間にCAGRで20.03%の成長が予測されています。
東京都の排出量取引制度(ETS)
排出量取引制度(ETS)は、二酸化炭素を含む温室効果ガスの排出量を制限または上限を設定し、ETSの排出枠を通じて炭素の価格を市場に流通させる炭素の価格メカニズムとして定義されています。日本では2010年4月、東京都庁(TMG)のキャップアンドトレードプログラムのもと、都内の排出量の約20%をカバーする最初の義務的ETSが開始されました。東京都庁の排出量取引制度は、化石燃料を大量に消費する大規模工場、高層ビル、熱供給企業などから排出される二酸化炭素を対象としています。
第二遵守期間(2015年度~2019年度)において、東京都の排出量取引制度は基準年の排出量から15~17%削減するという目標を達成しました。東京都の排出量取引制度は埼玉県の排出量取引制度とリンクしており、2つの管轄区域間でクレジットを相互に交換可能な状態にしています。開発された制度は、第三遵守期間(2020年度~2024年度)において、25%または27%の排出削減を目指す、割り当てられたカテゴリに従って運用されます。したがって、これらの制度が今後数年間、日本全体のカーボンクレジット市場を牽引すると予測されます。
COVID-19の影響
COVID-19の発生は日本のさまざまな部門に影響を及ぼしており、政府機関はその影響に真剣に取り組んでいます。持続可能な貿易と海運は、壊滅的なパンデミック期間からの回復において重要な役割を果たします。関連産業を擁する大海洋国家の1つとされる日本は、「国際海運のゼロエミッションに向けたロードマップ」計画を開始しました。
ロシア・ウクライナ戦争の影響
日本のエネルギー部門は、より多くの国内の天然資源を必要とするため、完全に輸入に依存しています。ロシアのサハリン1プロジェクトとサハリン2プロジェクトは、日本の原油需要のほぼ半分を供給し、LNG需要のほぼすべてをサハリン2だけで賄っています。ロシアのウクライナ併合は、サハリン2プロジェクトに約27.5%の権益を持つShellなどの主要石油・ガス企業に不安定な状況をもたらしました。日本政府も、サハリン1とサハリン2の石油・ガスプロジェクトに対する態度を継続する一方で、ロシアのエネルギー輸入に対する制裁を告げました。
主要企業の動向と見通し
日本の企業は、二酸化炭素排出を深刻な問題としてとらえ、それを回避する戦略を模索しています。これらの企業は、カーボンクレジットを経営に活用するための投資を行っています。Tokyo Gas Co.は、二酸化炭素排出量を大幅に削減する天然ガス利用の重要性を活性化することによって、ネットゼロ二酸化炭素を達成しようとしています。同時に、同社は電気部門と火力部門で具体的な技術を開発し導入しています。脱炭素化に向けた同社の献身的な取り組みは、二酸化炭素の回収・利用・貯蔵(CCUS)技術の導入に着手しました。同社の目標は、ビジネス活動を通じて2030年に1,700万トンの炭素排出を削減することです。Tokyo Gas Co.は、Shell Eastern Trading (Pte) Ltd.とカーボンニュートラルLNG(CNL)の供給に関する契約を結び、Shellが発行するカーボンクレジットを二酸化炭素排出量に充当しています。Shellは多数の天然プロジェクトからカーボンクレジットを購入し、割り当てられた各クレジットは第三者機関によって検証されます。
当レポートでは、日本のカーボンクレジット市場について調査分析し、市場規模と予測、市場力学、主要企業の情勢と見通しなどを提供しています。
目次
第1章 調査手法
第2章 プロジェクトの範囲と定義
第3章 日本のカーボンクレジット市場に対するCOVID-19の影響
第4章 ロシア・ウクライナ戦争の影響
第5章 エグゼクティブサマリー
第6章 顧客の声
- 市場の認知度と製品情報
- ブランドの認知度とロイヤルティ
- 購入決定において考慮される要素
- 購入頻度
- 購入媒体
第7章 日本のカーボンクレジット市場の見通し(2017年度~2031年度)
- 市場規模と予測
- 金額
- 数量
- タイプ別
- 政府のコンプライアンス
- 自主的/サードパーティコンプライアンス
- エンドユーザー別
- 電力・エネルギー生成
- 航空宇宙
- 海事
- 農業
- 製造部門
- 建築・建設
- 自動車
- 廃棄物管理
- その他
- 地域別
- 北部
- 中央
- 南部
- 市場シェア:企業別(2023年度)
第8章 サプライサイド分析
- 生産能力:企業別
- 生産:企業別
- 営業効率:企業別
- 主な工場の所在地(最大25)
第9章 市場マッピング(2023年度)
- タイプ別
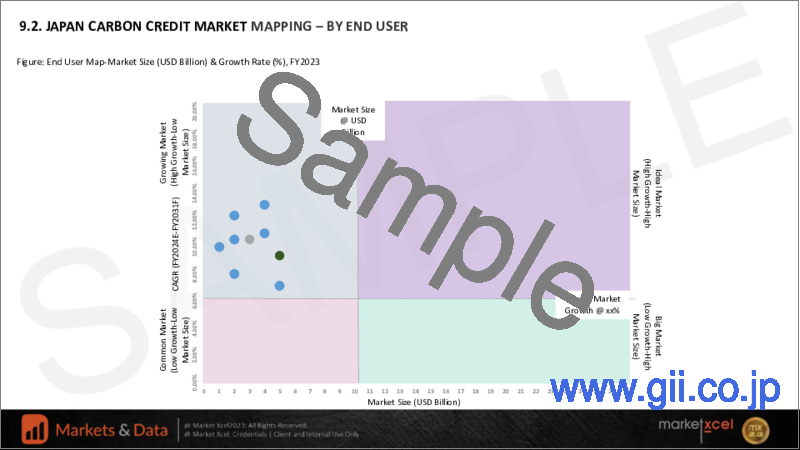
- エンドユーザー別
- 地域別
第10章 マクロ環境と産業構造
- 需給分析
- 輸出入の分析 - 数量と金額
- サプライ/バリューチェーン分析
- PESTEL分析
- ポーターのファイブフォース分析
第11章 市場力学
- 成長促進要因
- 成長抑制要因(課題、抑制要因)
第12章 主要企業情勢
- マーケットリーダー上位5社の競合マトリクス
- マーケットリーダー上位5社の市場収益の分析(2023年度)
- 合併と買収/合弁事業(該当する場合)
- SWOT分析(市場参入企業5社向け)
- 特許分析(該当する場合)
第13章 価格分析
第14章 ケーススタディ
第15章 主要企業の見通し
- Toshiba Corporation
- Tokyo Gas Co., Ltd.
- Isuzu Motors Ltd.
- Olympus Corporation
- Sakai Chemical Industry Co., Ltd.
- Toho Titanium Co.
- Marunouchi Heat Supply Co., Ltd.
- Yakult Honsha Co., Ltd.
- Lumine Co., Ltd.
- Mitsubishi Estate Co., Ltd.
第16章 戦略的推奨事項
第17章 当社について、免責事項
List of Tables
- Table 1. Pricing Analysis of Products from Key Players
- Table 2. Competition Matrix of Top 5 Market Leaders
- Table 3. Mergers & Acquisitions/ Joint Ventures (If Applicable)
- Table 4. About Us - Regions and Countries Where We Have Executed Client Projects
List of Figures
- Figure 1. Japan Carbon Credit Market, By Value, In USD Billion, FY2017-FY2031F
- Figure 2. Japan Carbon Credit Market, By Volume, In Unit Thousand, FY2017-FY2031F
- Figure 3. Japan Carbon Credit Market Share, By Type, In USD Billion, FY2017-FY2031F
- Figure 4. Japan Carbon Credit Market Share, By End User, In USD Billion, FY2017-FY2031F
- Figure 5. Japan Carbon Credit Market Share, By Region, In USD Billion, FY2017-FY2031F
- Figure 6. By Type Map-Market Size (USD Billion) & Growth Rate (%), FY2023
- Figure 7. By End-user Map-Market Size (USD Billion) & Growth Rate (%), FY2023
- Figure 8. By Region Map-Market Size (USD Billion) & Growth Rate (%), FY2023
Japan Carbon Credit Market size was valued at USD 28.2 billion in FY2023, expected to reach USD 121.5 billion in FY2031 with a CAGR of 20.03% for the forecast period between FY2024 and FY2031.
Japan is registered as the world's fifth-largest carbon emitter and is gearing up to develop initiatives toward the decarbonization of industries. The regulation of carbon credits is essential for any organization to lower carbon emissions and achieve the defined sustainability goals. Since 2013, Japan has voluntarily traded carbon credits over the country. The carbon credits are certified by the government, known as J-credits. They are designed mainly to be dispensed to certified holders through different projects such as forest management, energy-saving equipment, waste management, etc.
In February 2023, under the carbon pricing scheme and one of the policies, "Basic Policy for the Realization of GX," the Japanese government commenced and launched an "emission trading system." The trial trading for GX-ETS is commissioned to begin in FY2023 and transform into full-scale operation by FY2026. The government is under pledge to significantly contribute towards developing the carbon credit market from a medium to long-term perspective and simultaneously creating an emission trading scheme. Japan and Ukraine became the first government-to-government countries that signed a deal to purchase emission rights from Ukraine under the emission trading scheme. Under the signed treaty in 2009, Kiev must deliver 30 million tons of Assigned Amount Units (AAUs) to Japan.
Tokyo Emissions Trading Schemes (ETS)
Emissions Trading Schemes (ETS) is substantially defined as a carbon pricing mechanism that restricts or caps the amount of dispense of greenhouse gas emissions, including carbon dioxide and provides access to the market to circulate the carbon price through ETS allowances. Japan commenced its initial mandatory ETS in April 2010 under the Cap-and-Trade Program of the Tokyo Metropolitan Government (TMG), which covers approx-20% of the city area's emissions. The TMG ETS shields carbon dioxide emissions from large factories, high-rise buildings, heat distributors including operations that consume large amount of fossil fuels.
For the second compliance period (FY2015-FY2019) the Tokyo ETS program has achieved the target of reducing 15-17% below base-year emissions. The advance Tokyo's ETS is linked to the Saitama Prefecture ETS, which allows the credits to be in the mutually exchangeable state between the two jurisdictions. The developed program executes its operations under its third compliance period (FY2020-FY2024) according to the assigned category which aims to reduce emissions by 25% or 27%. Thus, these schemes are expected to drive the carbon credit market in the coming years across Japan.
Japanese Blue Carbon Offset
The aquatic life and oceans are considered as a prominent carbon reservoir because blue carbon inherits a phenomenal characteristic of remaining in the sea floor sediments by keeping itself undecomposed and demineralized for a very long duration of time. Owing to the external climatic changes, shallow coastal ecosystems (SCEs) such as mangroves, seagrass meadows, tidal marshes deliver a pivotal application regarding environmental concerns.
To counteract the global warming changes, the Yokohama city in Japan has pledged a target to reduce greenhouse emissions by 30% in 2030. The Yokohama Blue Carbon project was commissioned in 2014, to provide a certification on the amount of GHG reduction by blue carbon called blue carbon credit and substantially able to achieve carbon offsetting using credits trading. In 2020, the approved budget of USD 357,586.24 (38,533,000 yen) for Fukuoka city, USD 928 (100,000 yen) was allotted to the Hakata Bay Environmental Conservation and Creation and USD 33,640 (3,625,000 yen) to the Port Environment Improvement and Conservation Fund Reserve. For instance, an electric facility in the southwest of Japan called Electric Power Development also known as J-Power has earned carbon credits by raising algae nearby its area. Recently J-Power has utilized around 16 tons of carbon credits they earned by nurturing a sea grass bed.
Metal Organic Frameworks (MOFs)
To tackle the rising climatic alterations, carbon capture, utilization, and storage (CCUS) is an integral technology where adsorption is governed using various adsorbing materials corresponding to energy consumption. Metal-Organic frameworks (MOFs) are a remarkable technology for post-processing carbon capture which is a challenging combustion process due to their high humidity levels and low pressure of flue gas streams. MOFs can be regenerated at a very low temperature which adds another excellent characteristic to using MOFs in carbon capture.
Numerous organizations are practicing CCUS technology in different ways. Carbon Clean Solutions Limited has aid using its 49 working facilities worldwide. They have enabled challenging material processing industries such as steel, cement, refineries, etc. to navigate and tackle climatic changes using its low-cost CCUS technology. Their modular carbon capture technology CDRMax which is very energy efficient and can achieve 90%+ carbon capture rates and make the captured carbon available for re-use within the industry.
Impact of COVID-19
The outbreak of COVID-19 has affected various sectors of Japan and impact has been taken care by government agencies very seriously. Sustainable trade and shipping will play a prominent role in recovering from devastating pandemic duration. Japan which is considered one of the large maritime nations with relevant industries has initiated plan of "Roadmap to Zero Emissions from International Shipping", which generated emissions pathways for implementing decarbonization technologies in different sectors.
Companies across Japan are exploring the importance of carbon pricing instruments (CPIs) as a measure in post-Covid recovery efforts. The potential revenue accumulated from carbon pricing instruments when disbursed into the economy and into various activities will reduce inequality and poverty created from the pandemic of Covid.
Impact of Russia-Ukraine War
The Japanese energy sector is entirely dependent on imports due to needing more domestic natural sources. Russia's Sakhalin-1 and Sakhalin-2 projects feed almost half of the requirement of Japanese crude oil, and around all of the LNG requirement is taken care of by Sakhalin-2 alone. The annexation of Russia over Ukraine created instability throughout the major oil & gas company such as Shell, which drives a stake of around 27.5% in the Sakhalin-2 project, announced to withdraw its stake. Japanese administration had also told the sanctions on the import of Russia's energy while continuing the stand on Sakhalin-1 and Sakhalin-2 oil & gas projects.
Key Players Landscape and Outlook
Companies in Japan are taking carbon dioxide emissions as a serious concern and are seeking strategies to circumvent it. They are putting their investments in channelizing carbon credits in their operations. Tokyo Gas Co., Ltd. is trying to achieve net-zero carbon dioxide by inspiring the importance of natural gas usage to substantially lower carbon dioxide emissions. Simultaneously, the company develops and implements specific technologies in its electric and thermal sectors. Their dedication towards decarbonization has embarked on implementing carbon, capture, utilization, and storage (CCUS) technology in their operations. Their target has aided in reducing carbon emissions by 17 million tons in 2030 throughout their business activities. Tokyo Gas Co., Ltd. has collaborated with Shell Eastern Trading (Pte) Ltd., where the agreement concerns the supply of carbon neutral LNG (CNL), and the carbon credits issued by Shell have been used to requite the carbon dioxide emissions. Shell purchases these carbon credits from numerous natural projects, and each assigned credit is verified by third-party institutions.
Table of Contents
1. Research Methodology
2. Project Scope & Definitions
3. Impact of COVID-19 on the Japan Carbon Credit Market
4. Impact of Russia-Ukraine War
5. Executive Summary
6. Voice of Customer
- 6.1. Market Awareness and Product Information
- 6.2. Brand Awareness and Loyalty
- 6.3. Factors Considered in Purchase Decision
- 6.3.1. Brand Name
- 6.3.2. Quality
- 6.3.3. Quantity
- 6.3.4. Price
- 6.3.5. Product Specification
- 6.3.6. Application Specification
- 6.3.7. VOC/Toxicity Content
- 6.3.8. Availability of Product
- 6.4. Frequency of Purchase
- 6.5. Medium of Purchase
7. Japan Carbon Credit Market Outlook, FY2017-FY2031
- 7.1. Market Size & Forecast
- 7.1.1. By Value
- 7.1.2. By Volume
- 7.2. By Type
- 7.2.1. Government Compliance
- 7.2.1.1. California Cap-And-Trade
- 7.2.1.2. European Union ETS
- 7.2.1.3. The China National ETS
- 7.2.1.4. Others
- 7.2.2. Voluntary/Third-Party Compliance
- 7.2.1. Government Compliance
- 7.3. By End-user
- 7.3.1. Power & Energy Generation
- 7.3.2. Aerospace
- 7.3.3. Marine
- 7.3.4. Agriculture
- 7.3.5. Manufacturing Sector
- 7.3.5.1. Chemical Processing
- 7.3.5.2. Oil & Gas
- 7.3.5.3. Metallurgy
- 7.3.5.4. Others
- 7.3.6. Building & Construction
- 7.3.7. Automotive
- 7.3.8. Waste Management
- 7.3.9. Others
- 7.4. By Region
- 7.4.1. North
- 7.4.2. Central
- 7.4.3. South
- 7.5. By Company Market Share (%), FY2023
8. Supply Side Analysis
- 8.1. Capacity, By Company
- 8.2. Production, By Company
- 8.3. Operating Efficiency, By Company
- 8.4. Key Plant Locations (Up to 25)
9. Market Mapping, FY2023
- 9.1. By Type
- 9.2. By End-user
- 9.3. By Region
10. Macro Environment and Industry Structure
- 10.1. Supply Demand Analysis
- 10.2. Import Export Analysis - Volume and Value
- 10.3. Supply/Value Chain Analysis
- 10.4. PESTEL Analysis
- 10.4.1. Political Factors
- 10.4.2. Economic System
- 10.4.3. Social Implications
- 10.4.4. Technological Advancements
- 10.4.5. Environmental Impacts
- 10.4.6. Legal Compliances and Regulatory Policies (Statutory Bodies Included)
- 10.5. Porter's Five Forces Analysis
- 10.5.1. Supplier Power
- 10.5.2. Buyer Power
- 10.5.3. Substitution Threat
- 10.5.4. Threat from New Entrant
- 10.5.5. Competitive Rivalry
11. Market Dynamics
- 11.1. Growth Drivers
- 11.2. Growth Inhibitors (Challenges, Restraints)
12. Key Players Landscape
- 12.1. Competition Matrix of Top Five Market Leaders
- 12.2. Market Revenue Analysis of Top Five Market Leaders (in %, FY2023)
- 12.3. Mergers and Acquisitions/Joint Ventures (If Applicable)
- 12.4. SWOT Analysis (For Five Market Players)
- 12.5. Patent Analysis (If Applicable)
13. Pricing Analysis
14. Case Studies
15. Key Players Outlook
- 15.1. Toshiba Corporation
- 15.1.1. Company Details
- 15.1.2. Key Management Personnel
- 15.1.3. Products & Services
- 15.1.4. Financials (As reported)
- 15.1.5. Key Market Focus & Geographical Presence
- 15.1.6. Recent Developments
- 15.2. Tokyo Gas Co., Ltd.
- 15.3. Isuzu Motors Ltd.
- 15.4. Olympus Corporation
- 15.5. Sakai Chemical Industry Co., Ltd.
- 15.6. Toho Titanium Co.
- 15.7. Marunouchi Heat Supply Co., Ltd.
- 15.8. Yakult Honsha Co., Ltd.
- 15.9. Lumine Co., Ltd.
- 15.10. Mitsubishi Estate Co., Ltd.
Companies mentioned above DO NOT hold any order as per market share and can be changed as per information available during research work