|
|
市場調査レポート
商品コード
1171022
eコマースアパレル市場規模、シェア、動向分析レポート:タイプ別(レディースアパレル、メンズアパレル、キッズアパレル)、地域別、セグメント別予測、2022年~2030年E-commerce Apparel Market Size, Share & Trends Analysis Report By Type (Women's Apparel, Men's Apparel, Children's Apparel), By Region, And Segment Forecasts, 2022 - 2030 |
||||||
|
|
|||||||
|
● お客様のご希望に応じて、既存データの加工や未掲載情報(例:国別セグメント)の追加などの対応が可能です。 詳細はお問い合わせください。 |
|||||||


| eコマースアパレル市場規模、シェア、動向分析レポート:タイプ別(レディースアパレル、メンズアパレル、キッズアパレル)、地域別、セグメント別予測、2022年~2030年 |
|
出版日: 2022年11月17日
発行: Grand View Research
ページ情報: 英文 71 Pages
納期: 2~10営業日
|
- 全表示
- 概要
- 図表
- 目次
eコマースアパレル市場の成長と動向
Grand View Research, Inc.の新しいレポートによると、世界のeコマースアパレル市場規模は、2030年には1兆1,605億6,000万米ドルに達し、予測期間中に8.6%のCAGRを記録すると予測されています。これは、先進国からのアパレルに対する需要が高まっていることに起因しています。
eコマース分野のブームは、世界市場の成長を促進する要因として作用しています。以前は、パリやミラノのようなファッションの目的地に旅行し、文明の優れたセクションに限られていた豪華なブランドは、eコマースチャネルを介してすべてのクラスの人々を受け入れています。決済のしやすさ、アクセスのしやすさ、返品しやすさ、これらすべてが市場を後押しし、予測期間中に市場の成長を加速させると予想されます。
また、COVID-19の期間中、ロックダウン状況が観察され、原材料製品の供給が遅れたため、アパレル市場に影響を及ぼしました。しかし、アパレル市場のサプライチェーンやアパレル製品の製造には、世界的に大きな影響を与えました。また、COVID発生後の購買パターンの変化により、eコマースチャネルが顧客に受け入れられつつあることが、市場関係者にビジネスチャンスをもたらしました。このため、同市場は予測期間中に健全な市場成長率を示すと予想されます。
子供用アパレル分野は、男性用および女性用アパレル分野よりも速いペースで成長しています。子供用ファッションの動向は、魅力的な商品を幅広く紹介しており、消費率を加速させるものと思われます。また、スポーツや芸術など、さまざまな活動に参加する子どもたちが増えていることも、今後数年間、適切なアパレルに対する需要を促進すると予想されます。
北米では、地域全体で女性用アパレルの需要が高まっていることから、市場は2022年から2030年にかけて8.7%の有利な成長率を示すと予測されます。また、米国では、Tommy Hilfiger、Ralph Lauren、Hollister、Calvin Kleinなど、膨大な数のブランドが市場で積極的に機能しています。このように、市場はこの地域に深く根ざしており、世界中に大きな影響力を持っているのです。また、消費者の嗜好やライフスタイルの変化は、予測期間中に市場の成長を促進することが期待されます。このように、これらすべての要因が、同地域における同市場の成長を促進すると推定されます。
eコマースアパレル市場レポートハイライト
アジア太平洋地域では、中国やインドなどの新興国におけるメンズおよびキッズアパレルへの需要拡大により、2022年から2030年にかけて最も速いCAGR(年平均成長率)9.4%を記録すると予想されます。
女性用製品タイプは、欧州や北米などの先進地域における需要の高まりにより、2021年には68.0%以上の高い売上シェアを占めました。
欧州は、衣料品に対する女性の購買意欲の高まりによる婦人服の需要増から、市場を独占し、2021年の売上高シェアは36.0%超となりました。
2022年から2030年にかけては、ミレニアル世代のファッション意識の高まりにより、メンズアパレルが2番目に早いCAGR(8.4%)で推移すると予測される
目次
第1章 調査手法と範囲
- 市場セグメンテーションと範囲
- 市場の定義
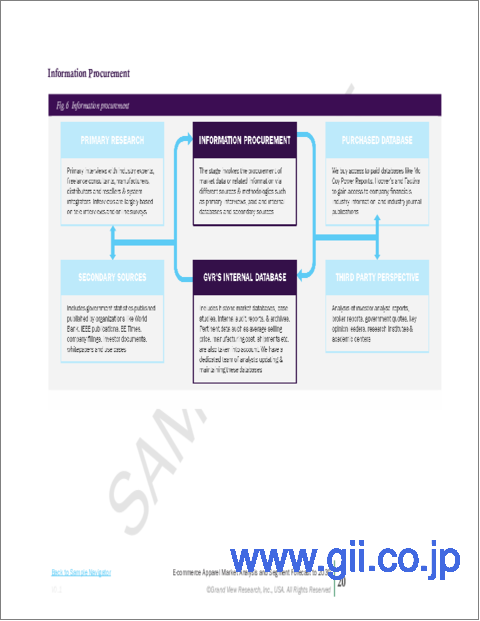
- 情報調達
- 購入したデータベース
- GVRの内部データベース
- セカンダリとサードパーティの視点
- 1次調査
- 情報分析
- データ分析モデル
- 市場情報とデータの視覚化
- データの検証と公開
第2章 エグゼクティブサマリー
- 市場概況
- タイプ別見通し
- 競合他社の洞察
第3章 eコマースアパレル市場の変数、動向、範囲
- 市場イントロダクション
- 浸透と成長の見通しのマッピング
- 業界バリューチェーン分析
- 販売・小売チャネル分析
- 利益率分析
- 市場力学
- 市場促進要因分析
- 市場抑制要因分析
- 業界の課題
- 業界の機会
- 事業環境分析
- 業界分析- ポーターズ
- サプライヤーの力
- 買い手の交渉力
- 代替の脅威
- 新規参入者からの脅威
- 競争企業間の敵対関係
- 業界分析- ポーターズ
- eコマースアパレル市場のロードマップ
- 市場参入戦略
- COVID-19の影響
第4章 消費者行動分析
- 消費者動向と嗜好
- 購入決定に影響を与える要因
- 消費者タイプの採用
- 考察と提言
第5章 eコマースアパレル市場:タイプ別の推定・動向分析
- タイプ別の変動分析と市場シェア、2021年と2030年
- レディースアパレル
- メンズアパレル
- 子供服
第6章 eコマースアパレル市場:地域別の推定・動向分析
- 地域別の変動分析と市場シェア、2021年と2030年
- 北米
- 米国
- 欧州
- ドイツ
- 英国
- フランス
- アジア太平洋地域
- 中国
- 日本
- 中南米
- ブラジル
- 中東とアフリカ
- 南アフリカ
第7章 競合分析
- 主要な世界プレーヤー、最近の動向、業界への影響
- 主要企業/競合の分類(主要なイノベーター、市場リーダー、新興企業)
- ベンダー情勢
- 主要企業の市場シェア分析、2021年
第8章 企業プロファイル
- Wal-Mart, Inc.
- 会社概要
- 財務実績
- 製品のベンチマーク
- 戦略的イニシアチブ
- Amazon, Inc.
- 会社概要
- 財務実績
- 製品のベンチマーク
- 戦略的イニシアチブ
- JD.com
- 会社概要
- 財務実績
- 製品のベンチマーク
- 戦略的イニシアチブ
- Alibaba
- 会社概要
- 財務実績
- 製品のベンチマーク
- 戦略的イニシアチブ
- EBay.com
- 会社概要
- 財務実績
- 製品のベンチマーク
- 戦略的イニシアチブ
- Flipkart
- 会社概要
- 財務実績
- 製品のベンチマーク
- 戦略的イニシアチブ
- Shopify
- 会社概要
- 財務実績
- 製品のベンチマーク
- 戦略的イニシアチブ
List of Tables
- Table 1 E-commerce apparel market - Driving factor market analysis
- Table 2 E-commerce apparel market - Restraint factor market analysis
- Table 3 Women's apparel market estimates and forecasts, 2017 - 2030 (USD Billion)
- Table 4 Men's apparel market estimates and forecasts, 2017 - 2030 (USD Billion)
- Table 5 Children's apparel market estimates and forecasts, 2017 - 2030 (USD Billion)
- Table 6 North America e-commerce apparel market estimates and forecasts, 2017 - 2030 (USD Billion)
- Table 7 North America e-commerce apparel market estimates and forecasts, by type, 2017 - 2030 (USD Billion)
- Table 8 U.S. e-commerce apparel market estimates and forecasts, 2017 - 2030 (USD Billion)
- Table 9 U.S. e-commerce apparel market estimates and forecast, by type, 2017 - 2030 (USD Billion)
- Table 10 Europe e-commerce market estimates and forecasts, 2017 - 2030 (USD Billion)
- Table 11 Europe e-commerce apparel market estimates and forecast, by type, 2017 - 2030 (USD Billion)
- Table 12 U.K. e-commerce market estimates and forecasts, 2017 - 2030 (USD Billion)
- Table 13 U.K. e-commerce apparel market estimates and forecast, by type, 2017 - 2030 (USD Billion)
- Table 14 Germany e-commerce apparel market estimates and forecasts, 2017 - 2030 (USD Billion)
- Table 15 Germany e-commerce apparel market estimates and forecast, by type, 2017 - 2030 (USD Billion)
- Table 16 France e-commerce apparel market estimates and forecasts, 2017 - 2030 (USD Billion)
- Table 17 France e-commerce apparel market estimates and forecast, by type, 2017 - 2030 (USD Billion)
- Table 18 Asia Pacific e-commerce apparel market estimates and forecasts, 2017 - 2030 (USD Billion)
- Table 19 Asia Pacific e-commerce apparel market estimates and forecast, by type, 2017 - 2030 (USD Billion)
- Table 20 China e-commerce apparel market estimates and forecasts, 2017 - 2030 (USD Billion)
- Table 21 China e-commerce apparel market estimates and forecast, by type, 2017 - 2030 (USD Billion)
- Table 22 Japan e-commerce apparel market estimates and forecasts, 2017 - 2030 (USD Billion)
- Table 23 Japan e-commerce apparel market estimates and forecast, by type, 2017 - 2030 (USD Billion)
- Table 24 Central & South America e-commerce apparel market estimates and forecast, 2017 - 2030 (USD Billion)
- Table 25 Central & South America e-commerce apparel market estimates and forecast, by type, 2017 - 2030 (USD Billion)
- Table 26 Brazil e-commerce apparel market estimates and forecast, 2017 - 2030 (USD Billion)
- Table 27 Brazil e-commerce apparel market estimates and forecast, by type, 2017 - 2030 (USD Billion)
- Table 28 Middle East & Africa e-commerce apparel market estimates and forecast, 2017 - 2030 (USD Billion)
- Table 29 Middle East & Africa e-commerce apparel market estimates and forecast, by type, 2017 - 2030 (USD Billion)
- Table 30 South Africa e-commerce apparel market estimates and forecast, 2017 - 2030 (USD Billion)
- Table 31 South Africa e-commerce apparel market estimates and forecast, by type, 2017 - 2030 (USD Billion)
- Table 32 Company categorization
- Table 33 Key e-commerce apparel company market share analysis, 2021
List of Figures
- Fig. 1 E-commerce apparel market segmentation
- Fig. 2 Information procurement
- Fig. 3 Primary research pattern
- Fig. 4 Primary research approaches
- Fig. 5 Primary research process
- Fig. 6 Market Snapshot
- Fig. 7 Segment Snapshot
- Fig. 8 Competitive Landscape Snapshot
- Fig. 9 E-commerce sales by country in 2021 (USD Billion)
- Fig. 10 E-commerce apparel market - Penetration & growth prospect mapping
- Fig. 11 E-Commerce apparel market - Value chain analysis
- Fig. 12 E-Commerce apparel market - Sales channel analysis
- Fig. 13 E-Commerce apparel market - Profit margin analysis
- Fig. 14 E-Commerce apparel market: Porter's five forces analysis
- Fig. 15 Roadmap of the E-Commerce Apparel Market
- Fig. 16 Factors affecting buying decision of e-commerce apparel
- Fig. 17 E-commerce apparel market: Product share (%) analysis, 2021 & 2030
- Fig. 18 E-commerce apparel market: Region share (%) analysis, 2021 & 2030
- Fig. 19 Key e-commerce apparel company market share analysis, 2021
E-Commerce Apparel Market Growth & Trends:
The global e-commerce apparel market size is expected to reach USD 1,160.56 billion in 2030, registering a CAGR of 8.6% during the forecast period, according to a new report by Grand View Research, Inc. This can be accredited to growing demand for apparel from developed countries.
Boom in the e-commerce segment has been acting as a promoter for global market growth. The luxurious brands, which formerly were limited to the superior section of the civilization, traveling to fashion destinations like Paris and Milan have embraced people of all classes via the e-commerce channel. Ease of Payments, accessibility, and easy return policies are all producing a push for the market and are expected to accelerate the market growth during the forecast period.
Moreover, a lockdown circumstance has been observed throughout the COVID-19, and it showed an impact on the apparel market due to delayed supply of the raw material products. However, it significantly impacted the supply chain of the apparel market and manufacturing of the apparel products, across the globe. Moreover, the increasing acceptance of the e-commerce channels from the customers owing to changing buying patterns after the COVID outbreak had created opportunities for the market players. Thus, the market is expected to witness a healthy market growth rate during the forecast period.
The children's apparel segment has been growing at a faster pace than the men's and women's apparel segments. The increasing trend of children's fashion showcases a wide range of attractive products, which is likely to accelerate the consumption rate. The increasing participation of the children in various activities like sports and arts is also expected to drive demand for the appropriate apparel in the coming years.
In North America, the market is projected to show a lucrative growth rate of 8.7% from 2022 to 2030 owing to rising demand for the women's apparel across the region. Additionally, the U.S. has a vast number of brands actively functioning in the market, which includes Tommy Hilfiger, Ralph Lauren, Hollister, and Calvin Klein. Thus, the market has deep roots in the region and has an enormous influence across the globe. Moreover, changing consumers' preferences and lifestyles is expected to propel the market growth during the forecast period. Thus all these factors are estimated to drive growth of this market within this region.
E-Commerce Apparel Market Report Highlights:
- In Asia Pacific, the market is expected to witness the fastest CAGR of 9.4% from 2022 to 2030 owing to growing demand for the men's and children's apparel from developing nations such as China and India
- The women's apparel type segment accounted for the highest revenue share of more than 68.0% in 2021 owing to the rising demand for these products from the developed regions such as Europe and North America
- Europe dominated the market and accounted for the revenue share of more than 36.0% in 2021 owing to rising demand for the women's apparel as a result of the growing purchasing power of the women towards clothing
- The men's apparel type segment is expected to foresee the second-fastest CAGR of 8.4% from 2022 to 2030 due to the growing fashion consciousness amongst millennials
Table of Contents
Chapter 1. Methodology and Scope
- 1.1. Market Segmentation & Scope
- 1.2. Market Definition
- 1.3. Information Procurement
- 1.3.1. Purchased Database
- 1.3.2. GVR's Internal Database
- 1.3.3. Secondary s & Third-Party Perspectives
- 1.3.4. Primary Research
- 1.4. Information Analysis
- 1.4.1. Data Analysis Models
- 1.5. Market Information & Data Visualization
- 1.6. Data Validation & Publishing
Chapter 2. Executive Summary
- 2.1. Market Outlook
- 2.2. Type Outlook
- 2.3. Competitive Insights
Chapter 3. E-Commerce Apparel Market Variables, Trends & Scope
- 3.1. Market Introduction
- 3.2. Penetration & Growth Prospect Mapping
- 3.3. Industry Value Chain Analysis
- 3.3.1. Sales/Retail Channel Analysis
- 3.3.2. Profit Margin Analysis
- 3.4. Market Dynamics
- 3.4.1. Market Driver Analysis
- 3.4.2. Market Restraint Analysis
- 3.4.3. Industry Challenges
- 3.4.4. Industry Opportunities
- 3.5. Business Environment Analysis
- 3.5.1. Industry Analysis - Porter's
- 3.5.1.1. Supplier Power
- 3.5.1.2. Buyer Power
- 3.5.1.3. Substitution Threat
- 3.5.1.4. Threat from New Entrant
- 3.5.1.5. Competitive Rivalry
- 3.5.1. Industry Analysis - Porter's
- 3.6. Roadmap of E-Commerce Apparel Market
- 3.7. Market Entry Strategies
- 3.8. Impact of COVID-19
Chapter 4. Consumer Behavior Analysis
- 4.1. Consumer Trends and Preferences
- 4.2. Factors Affecting Buying Decision
- 4.3. Consumer Type Adoption
- 4.4. Observations & Recommendations
Chapter 5. E-Commerce Apparel Market: Type Estimates & Trend Analysis
- 5.1. Type Movement Analysis & Market Share, 2021 & 2030
- 5.2. Women's Apparel
- 5.2.1. Market estimates and forecast, 2017 - 2030 (USD Million)
- 5.3. Men's Apparel
- 5.3.1. Market estimates and forecast, 2017 - 2030 (USD Million)
- 5.4. Children's Apparel
- 5.4.1. Market estimates and forecast, 2017 - 2030 (USD Million)
Chapter 6. E-Commerce Apparel Market: Regional Estimates & Trend Analysis
- 6.1. Regional Movement Analysis & Market Share, 2021 & 2030
- 6.2. North America
- 6.2.1. Market estimates and forecast, 2017 - 2030 (USD Million)
- 6.2.2. Market estimates and forecast, By Type, 2017 - 2030 (USD Million)
- 6.2.3. U.S.
- 6.2.3.1. Market estimates and forecast, 2017 - 2030 (USD Million)
- 6.2.3.2. Market estimates and forecast, By Type, 2017 - 2030 (USD Million)
- 6.3. Europe
- 6.3.1. Market estimates and forecast, 2017 - 2030 (USD Million)
- 6.3.2. Market estimates and forecast, By Type, 2017 - 2030 (USD Million)
- 6.3.3. Germany
- 6.3.3.1. Market estimates and forecast, 2017 - 2030 (USD Million)
- 6.3.3.2. Market estimates and forecast, By Type, 2017 - 2030 (USD Million)
- 6.3.4. U.K.
- 6.3.4.1. Market estimates and forecast, 2017 - 2030 (USD Million)
- 6.3.4.2. Market estimates and forecast, By Type, 2017 - 2030 (USD Million)
- 6.3.5. France
- 6.3.5.1. Market estimates and forecast, 2017 - 2030 (USD Million)
- 6.3.5.2. Market estimates and forecast, By Type, 2017 - 2030 (USD Million)
- 6.4. Asia Pacific
- 6.4.1. Market estimates and forecast, 2017 - 2030 (USD Million)
- 6.4.2. Market estimates and forecast, By Type, 2017 - 2030 (USD Million)
- 6.4.3. China
- 6.4.3.1. Market estimates and forecast, 2017 - 2030 (USD Million)
- 6.4.3.2. Market estimates and forecast, By Type, 2017 - 2030 (USD Million)
- 6.4.4. Japan
- 6.4.4.1. Market estimates and forecast, 2017 - 2030 (USD Million)
- 6.4.4.2. Market estimates and forecast, By Type, 2017 - 2030 (USD Million)
- 6.5. Central & South America
- 6.5.1. Market estimates and forecast, 2017 - 2030 (USD Million)
- 6.5.2. Market estimates and forecast, By Type, 2017 - 2030 (USD Million)
- 6.5.3. Brazil
- 6.5.3.1. Market estimates and forecast, 2017 - 2030 (USD Million)
- 6.5.3.2. Market estimates and forecast, By Type, 2017 - 2030 (USD Million)
- 6.6. Middle East & Africa
- 6.6.1. Market estimates and forecast, 2017 - 2030 (USD Million)
- 6.6.2. Market estimates and forecast, By Type, 2017 - 2030 (USD Million)
- 6.6.3. South Africa
- 6.6.3.1. Market estimates and forecast, 2017 - 2030 (USD Million)
- 6.6.3.2. Market estimates and forecast, By Type, 2017 - 2030 (USD Million)
Chapter 7. Competitive Analysis
- 7.1. Key global players, recent developments & their impact on the industry
- 7.2. Key Company/Competition Categorization (Key innovators, Market leaders, Emerging players)
- 7.3. Vendor Landscape
- 7.3.1. Key company market share analysis, 2021
Chapter 8. Company Profiles
- 8.1. Wal-Mart, Inc.
- 8.1.1. Company Overview
- 8.1.2. Financial Performance
- 8.1.3. Product Benchmarking
- 8.1.4. Strategic Initiatives
- 8.2. Amazon, Inc.
- 8.2.1. Company Overview
- 8.2.2. Financial Performance
- 8.2.3. Product Benchmarking
- 8.2.4. Strategic Initiatives
- 8.3. JD.com
- 8.3.1. Company Overview
- 8.3.2. Financial Performance
- 8.3.3. Product Benchmarking
- 8.3.4. Strategic Initiatives
- 8.4. Alibaba
- 8.4.1. Company Overview
- 8.4.2. Financial Performance
- 8.4.3. Product Benchmarking
- 8.4.4. Strategic Initiatives
- 8.5. EBay.com
- 8.5.1. Company Overview
- 8.5.2. Financial Performance
- 8.5.3. Product Benchmarking
- 8.5.4. Strategic Initiatives
- 8.6. Flipkart
- 8.6.1. Company Overview
- 8.6.2. Financial Performance
- 8.6.3. Product Benchmarking
- 8.6.4. Strategic Initiatives
- 8.7. Shopify
- 8.7.1. Company Overview
- 8.7.2. Financial Performance
- 8.7.3. Product Benchmarking
- 8.7.4. Strategic Initiatives