|
|
市場調査レポート
商品コード
1122275
ブレンドスパイスの市場規模、シェア、動向分析レポート:タイプ別(ガラムマサラ、ベルベール、五香粉、七味唐辛子)、流通チャネル別(B2B、B2C)、地域別、セグメント別予測、2022年~2030年Blended Spices Market Size, Share & Trends Analysis Report By Type (Garam Masala, Berbere, 5 Chinese Spices, Shichimi Togarashi), By Distribution Channel (B2B, B2C), By Region, And Segment Forecasts, 2022 - 2030 |
||||||
|
|
|||||||
|
● お客様のご希望に応じて、既存データの加工や未掲載情報(例:国別セグメント)の追加などの対応が可能です。 詳細はお問い合わせください。 |
|||||||


| ブレンドスパイスの市場規模、シェア、動向分析レポート:タイプ別(ガラムマサラ、ベルベール、五香粉、七味唐辛子)、流通チャネル別(B2B、B2C)、地域別、セグメント別予測、2022年~2030年 |
|
出版日: 2022年08月18日
発行: Grand View Research
ページ情報: 英文 80 Pages
納期: 2~10営業日
|
- 全表示
- 概要
- 図表
- 目次
ブレンドスパイスの市場成長・動向
Grand View Research, Inc.の新しいレポートによると、世界のブレンドスパイス市場規模は2030年までに325億8000万米ドルに達し、2022年から2030年までCAGR5.4%で拡大すると予測されています。消費者の健康意識の高まりが、市場の成長を後押ししています。ブレンドスパイスの需要増加の背景には、天然香料、有機食品、安全な栄養補助食品という3つの主な理由があります。ブレンドスパイスは、香ばしいスナックや調理済み食品など、さまざまな用途に適しているため、この地域のいくつかのセグメントの人々の間で人気が高まっています。このことは、予測期間中、市場関係者に十分なビジネスチャンスをもたらしています。
インド、中国、タイ、ベトナムの料理には、さまざまなスパイスが使用され、料理に異なる風味と味を与えています。米国では、家庭料理への関心が高まっています。その結果、コショウやショウガなどのブレンドスパイスの売り上げが大幅に伸びています。ブレンドスパイスの市場を牽引しているのは、さまざまなプロジェクトだけでなく、同国の人々がストレス発散のために家庭でもっと料理をするようになることを意図した取り組みです。また、北米のブレンドスパイスは風味が豊かです。最近では、中東の地中海風スパイスを北米の食品に混ぜたブレンドが注目されており、ターメリックやコリアンダー、温かみのあるブラウンスパイスなどがミックスされています。
2021年の市場は、ガラムマサラ部門が35.0%以上の収益シェアを占め、市場を独占しています。ガラムマサラは、コレステロールや血糖値を下げ、老化を遅らせ、抗炎症作用があることから、世界中で大きく好まれるブレンドスパイスの一種です。さらに、消化を助け、免疫力と代謝を高め、ダイエットを促進するスパイスとして評価されています。南アジアで多く使用されているブレンドスパイスです。
2021年には、アジア太平洋地域が最大の収益シェアを占めました。これは、可処分所得の増加、様々な土着のスパイスビジネスの創出、広告および販売活動の増加により、同地域でブレンドスパイスの消費が増加していることに起因していると考えられます。スパイスの大半はインド、ベトナム、中国、タイなどの国々で栽培されており、この地域は世界有数の輸出国となっています。市場の世界化や人の移動に伴い、消費者の食に対する志向も変化しており、外食産業では様々なブレンドスパイスを料理に取り入れる新たな機会が生まれています。市場参加者の中には、さまざまな場所で活動し、忠実な顧客基盤を持つ者もいるため、市場参加者は互いに強い競争に直面しています。また、小規模なプレイヤーが複数存在することも、競争の激化につながっています。
ブレンドスパイス市場レポートハイライト
北米は2022年から2030年にかけて有利な成長を遂げると予想されています。これは、米国の消費者の50%が新しい刺激的なフレーバーを試したがっていることを示す様々な調査に起因しています。
ベルベールタイプセグメントは、2022年から2030年にかけて著しいCAGRを示すと予想されます。ベルベーレスパイスは、様々なスパイスを使用したしっかりとしたフレーバーで、世界中の料理で継続的に人気を集めています。
B2B流通チャネルセグメントは、2021年に最大の収益シェアを占めました。生産者から顧客へ製品を直接流通させる最もシンプルなチャネルです。
目次
第1章 調査手法と範囲
- 市場セグメンテーションと範囲
- 市場の定義
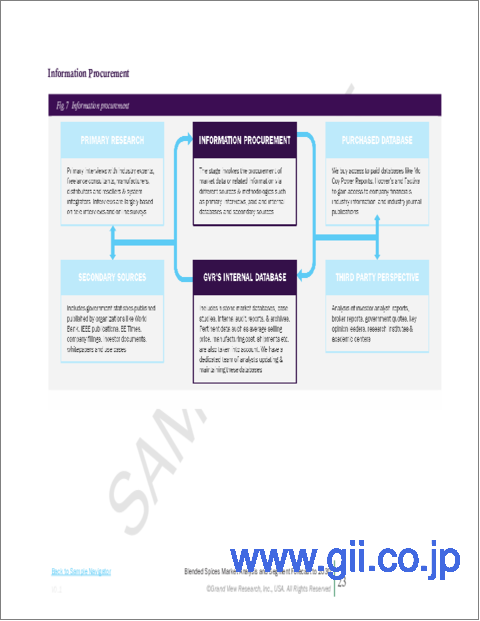
- 情報調達
- 購入したデータベース
- GVRの内部データベース
- 二次情報と第三者の視点
- 1次調査
- 情報分析
- データ分析モデル
- 市場形成とデータ可視化
- データの検証と公開
第2章 エグゼクティブサマリー
- 市場の見通し
- タイプ Outlook
- 流通経路の見通し
- 地域の見通し
第3章 ブレンドスパイス市場の変数、動向、範囲
- 市場イントロダクション
- 浸透と成長の見通しのマッピング
- 業界バリューチェーン分析
- 販売・小売チャネル分析
- 利益率分析
- 市場力学
- 市場促進要因分析
- 市場制約分析
- 業界の課題
- 業界の機会
- 事業環境分析
- 業界分析- ポーターズ
- サプライヤーの力
- 買い手の交渉力
- 代替の脅威
- 新規参入者からの脅威
- 競争企業間の敵対関係
- 業界分析- ポーターズ
- ブレンドスパイス市場のロードマップ
- 市場参入戦略
- 混合スパイス市場に対するCOVID-19の影響
第4章 消費者行動分析
- 人口統計分析
- 消費者の動向と好み
- 購入決定に影響を与える要因
- 消費者製品の採用
- 所見と推奨事項
第5章ブレンドスパイス市場:種類の推定・動向分析
- タイプの変動分析と市場シェア、2021年と2030年
- ガラムマサラ
- ベルベル
- 5つの中国の香辛料
- 七味唐辛子
- その他
第6章 ブレンドスパイス市場の流通チャネルの推定・動向分析
- 流通チャネルの変動分析と市場シェア、2021年と2030年
- B2B
- B2C
第7章 ブレンドスパイス市場:地域推定・動向分析
- 地域別変動分析と市場シェア、2021年と2030年
- 北米
- 米国
- カナダ
- メキシコ
- 欧州
- 英国
- ドイツ
- フランス
- イタリア
- アジア太平洋地域
- 中国
- バングラデシュ
- インド
- インドネシア
- タイ
- 中南米
- ブラジル
- 中東とアフリカ
- アラブ首長国連邦
- サウジアラビア
第8章 競合分析
- 主要な世界プレーヤー、最近の動向、業界への影響
- 主要企業/競合の分類(主要なイノベーター、市場リーダー、新興企業)
- ベンダー情勢
- 主要企業の市場シェア分析、2021年
第9章 企業プロファイル
- Spices, Inc.
- 会社概要
- 財務実績
- 製品ベンチマーク
- 戦略的イニシアチブ
- Tony Chachere's
- 会社概要
- 財務実績
- 製品ベンチマーク
- 戦略的イニシアチブ
- Empresas Tajin
- 会社概要
- 財務実績
- 製品ベンチマーク
- 戦略的イニシアチブ
- Badia Spices, Inc.
- 会社概要
- 財務実績
- 製品ベンチマーク
- 戦略的イニシアチブ
- Mahashian Di Hatti Private Limited
- 会社概要
- 財務実績
- 製品ベンチマーク
- 戦略的イニシアチブ
- Shan Foods(Pvt.)Ltd.
- 会社概要
- 財務実績
- 製品ベンチマーク
- 戦略的イニシアチブ
- McCormick &Company, Incorporated
- 会社概要
- 財務実績
- 製品ベンチマーク
- 戦略的イニシアチブ
- Everest Food Products Pvt. Ltd.
- 会社概要
- 財務実績
- 製品ベンチマーク
- 戦略的イニシアチブ
- World of Spice Ltd.
- 会社概要
- 財務実績
- 製品ベンチマーク
- 戦略的イニシアチブ
- MTR Foods Pvt Ltd.
- 会社概要
- 財務実績
- 製品のベンチマーク
- 戦略的イニシアチブ
List of Tables
- 1. Blended spices market - Driving factor market analysis
- 2. Blended spices market - Restraint factor market analysis
- 3. Blended spices operators' sales analysis 2018 vs. 2019
- 4. Garam Masala blended spices market estimates and forecast, 2017 - 2030 (USD Million)
- 5. Berbere blended spices market estimates and forecast, 2017 - 2030 (USD Million)
- 6. 5 Chinese Spices blended spices market estimates and forecast, 2017 - 2030 (USD Million)
- 7. Shichimi Togarashi blended spices market estimates and forecast, 2017 - 2030 (USD Million)
- 8. Other blended spices market estimates and forecast, 2017 - 2030 (USD Million)
- 9. Blended spices market estimates and forecast for B2B, 2017 - 2030 (USD Million)
- 10. Blended spices market estimates and forecast for B2C, 2017 - 2030 (USD Million)
- 11. North America blended spices market estimates and forecast, 2017 - 2030, (USD Million)
- 12. North America blended spices market estimates and forecast, by type, 2017 - 2030 (USD Million)
- 13. North America blended spices market estimates and forecast, by distribution channel, 2017 - 2030 (USD Million)
- 14. U.S. blended spices market estimates and forecast, 2017 - 2030 (USD Million)
- 15. U.S. blended spices market estimates and forecast, by type, 2017 - 2030 (USD Million)
- 16. U.S. blended spices market estimates and forecast, by distribution channel, 2017 - 2030 (USD Million)
- 17. Canada blended spices market estimates and forecast, 2017 - 2030 (USD Million) 82
- 18. Canada blended spices market estimates and forecast, by type, 2017 - 2030 (USD Million)
- 19. Canada blended spices market estimates and forecast, by distribution channel, 2017 - 2030 (USD Million)
- 20. Mexico blended spices market estimates and forecast, 2017 - 2030 (USD Million)
- 21. Mexico blended spices market estimates and forecast, by type, 2017 - 2030 (USD Million)
- 22. Mexico blended spices market estimates and forecast, by distribution channel, 2017 - 2030 (USD Million)
- 23. Europe blended spices market estimates and forecast, 2017 - 2030, (USD Million)
- 24. Europe blended spices market estimates and forecast, by type, 2017 - 2030 (USD Million)
- 25. Europe blended spices market estimates and forecast, by distribution channel, 2017 - 2030 (USD Million)
- 26. U.K. blended spices market estimates and forecast, 2017 - 2030 (USD Million)
- 27. U.K. blended spices market estimates and forecast, by type, 2017 - 2030 (USD Million)
- 28. U.K. blended spices market estimates and forecast, by distribution channel, 2017 - 2030 (USD Million)
- 29. Germany blended spices market estimates and forecast, 2017 - 2030 (USD Million)
- 30. Germany blended spices market estimates and forecast, by type, 2017 - 2030 (USD Million)
- 31. Germany blended spices market estimates and forecast, by distribution channel, 2017 - 2030 (USD Million)
- 32. France blended spices market estimates and forecast, 2017 - 2030 (USD Million)
- 33. France blended spices market estimates and forecast, by type, 2017 - 2030 (USD Million)
- 34. France blended spices market estimates and forecast, by distribution channel, 2017 - 2030 (USD Million)
- 35. Italy blended spices market estimates and forecast, 2017 - 2030 (USD Million)
- 36. Italy blended spices market estimates and forecast, by type, 2017 - 2030 (USD Million)
- 37. Italy blended spices market estimates and forecast, by distribution channel, 2017 - 2030 (USD Million)
- 38. Asia Pacific blended spices market estimates and forecast, 2017 - 2030 (USD Million)
- 39. Asia Pacific blended spices market estimates and forecast, by type, 2017 - 2030 (USD Million)
- 40. Asia Pacific blended spices market estimates and forecast, by distribution channel, 2017 - 2030 (USD Million)
- 41. China blended spices market estimates and forecast, 2017 - 2030 (USD Million)
- 42. China blended spices market estimates and forecast, by type, 2017 - 2030 (USD Million)
- 43. China blended spices market estimates and forecast, by distribution channel, 2017 - 2030 (USD Million)
- 44. Bangladesh blended spices market estimates and forecast, 2017 - 2030 (USD Million)
- 45. Bangladesh blended spices market estimates and forecast, by type, 2017 - 2030 (USD Million)
- 46. Bangladesh blended spices market estimates and forecast, by distribution channel, 2017 - 2030 (USD Million)
- 47. India blended spices market estimates and forecast, 2017 - 2030 (USD Million)
- 48. India blended spices market estimates and forecast, by type, 2017 - 2030 (USD Million)
- 49. India blended spices market estimates and forecast, by distribution channel, 2017 - 2030 (USD Million)
- 50. Indonesia blended spices market estimates and forecast, 2017 - 2030 (USD Million)
- 51. Indonesia blended spices market estimates and forecast, by type, 2017 - 2030 (USD Million)
- 52. Indonesia blended spices market estimates and forecast, by distribution channel, 2017 - 2030 (USD Million)
- 53. Thailand blended spices market estimates and forecast, 2017 - 2030 (USD Million)
- 54. Thailand blended spices market estimates and forecast, by type, 2017 - 2030 (USD Million)
- 55. Thailand blended spices market estimates and forecast, by distribution channel, 2017 - 2030 (USD Million)
- 56. Central & South America blended spices market estimates and forecast, 2017 - 2030, (USD Million)
- 57. Central & South America blended spices market estimates and forecast, by type, 2017 - 2030 (USD Million)
- 58. Central & South America blended spices market estimates and forecast, by distribution channel, 2017 - 2030 (USD Million)
- 59. Brazil blended spices market estimates and forecast, 2017 - 2030 (USD Million) 107
- 60. Brazil blended spices market estimates and forecast, by type, 2017 - 2030 (USD Million)
- 61. Brazil blended spices market estimates and forecast, by distribution channel, 2017 - 2030 (USD Million)
- 62. Middle East & Africa blended spices market estimates and forecast, 2017 - 2030, (USD Million)
- 63. Middle East & Africa blended spices market estimates and forecast, by type, 2017 - 2030 (USD Million)
- 64. Middle East & Africa blended spices market estimates and forecast, by distribution channel, 2017 - 2030 (USD Million)
- 65. UAE blended spices market estimates and forecast, 2017 - 2030 (USD Million)
- 66. UAE blended spices market estimates and forecast, by type, 2017 - 2030 (USD Million)
- 67. UAE blended spices market estimates and forecast, by distribution channel, 2017 - 2030 (USD Million)
- 68. Saudi Arabia blended spices market estimates and forecast, 2017 - 2030 (USD Million)
- 69. Saudi Arabiab lended spices market estimates and forecast, by type, 2017 - 2030 (USD Million)
- 70. Saudi Arabiabl ended spices market estimates and forecast, by distribution channel, 2017 - 2030 (USD Million)
- 71. Company categorization
List of Figures
- 1. Blended spices market segmentation
- 2. Information procurement
- 3. Primary research pattern
- 4. Primary research approaches
- 5. Primary research process
- 6. Blended spices market: Value chain analysis
- 7. Blended spicessales/retail channel analysis
- 8. Blended spices market: Porter's five forces analysis
- 9. Blended spices market: Type share (%) analysis, 2021 & 2030
- 10. Blended spices market: Distribution Channel share (%) analysis, 2021 & 2030
- 11. Blended spices market: Regional share (%) analysis, 2021 & 2030
Blended Spices Market Growth & Trends:
The global blended spices market size is expected to reach USD 32.58 billion by 2030, according to a new report by Grand View Research, Inc., expanding at a CAGR of 5.4% from 2022 to 2030. The growing health consciousness among consumers is fuelling the growth of the market. The three main reasons behind the increasing demand for blended spices include natural flavoring, organic foods, and safe dietary supplements. Blended spices have observed an increase in popularity among several segments of people in the region as they are suitable in numerous applications, such as savory snacks and ready meals. This is, in turn, creating ample opportunities for market players over the forecast period.
Indian, Chinese, Thailand, and Vietnamese cuisines use a variety of spices to give their food a different flavor and taste. In the U.S., most people are getting more interested in home cooking. As a result, sales of blended spices such as pepper and ginger have increased considerably. The market for blended spices has been driven by a range of projects as well as initiatives intended to inspire people in the country to cook more food at home to release stress. Additionally, spice blends from North American nations have rich flavor levels. In recent times, there has been a lot of interest in blends mixing the Middle Eastern Mediterranean blended spice in North American foods, which include a mix of turmeric, coriander, and warm brown spices.
The garam masala segment dominated the market in 2021 with a revenue share of over 35.0%. Garam masala is a largely preferred blended spice type all over the world as it lowers cholesterol and blood sugar, slows down aging, and is anti-inflammatory. Moreover, it is lauded as a spice that helps digestion, increases immunity and metabolism, and promotes weight loss. It is a spice blend mostly used throughout South Asia.
Asia Pacific held the largest revenue share in 2021. This can be attributed to the rising consumption of blended spices in the region due to the increasing disposable income, the creation of various indigenous spice businesses, and increased advertising and sales activities. The majority of spices are grown in countries such as India, Vietnam, China, and Thailand, making the region one of the world's leading exporters. Consumer food inclinations have changed as a result of market globalization and migration, providing new opportunities for food service establishments to add a range of blended spices to their cuisines. The market players face strong competition from each other as some of them function at various locations and have loyal customer bases. The existence of several small-scale players is also leading to augmented competition.
Blended Spices Market Report Highlights:
- North America is expected to witness lucrative growth from 2022 to 2030. This is attributed to the various studies that have depicted that 50% of U.S. consumers seek to try new, exciting flavors
- The berbere type segment is expected to exhibit a significant CAGR from 2022 to 2030. Berbere spices are continually gaining popularity across the cuisines globally with their robust flavors featuring a range of spices
- The B2B distribution channel segment held the largest revenue share in 2021. It is the simplest channel of direct distribution of products from producer to customer
Table of Contents
Chapter 1. Methodology and Scope
- 1.1. Market Segmentation & Scope
- 1.2. Market Definition
- 1.3. Information Procurement
- 1.3.1. Purchased Database
- 1.3.2. GVR's Internal Database
- 1.3.3. Secondary Sources & Third-Party Perspectives
- 1.3.4. Primary Research
- 1.4. Information Analysis
- 1.4.1. Data Analysis Models
- 1.5. Market Formulation & Data Visualization
- 1.6. Data Validation & Publishing
Chapter 2. Executive Summary
- 2.1. Market Outlook
- 2.2. Type Outlook
- 2.3. Distribution Channel Outlook
- 2.4. Regional Outlook
Chapter 3. Blended Spices Market Variables, Trends & Scope
- 3.1. Market Introduction
- 3.2. Penetration & Growth Prospect Mapping
- 3.3. Industry Value Chain Analysis
- 3.3.1. Sales/Retail Channel Analysis
- 3.3.2. Profit Margin Analysis
- 3.4. Market Dynamics
- 3.4.1. Market Driver Analysis
- 3.4.2. Market Restraint Analysis
- 3.4.3. Industry Challenges
- 3.4.4. Industry Opportunities
- 3.5. Business Environment Analysis
- 3.5.1. Industry Analysis - Porter's
- 3.5.1.1. Supplier Power
- 3.5.1.2. Buyer Power
- 3.5.1.3. Substitution Threat
- 3.5.1.4. Threat from New Entrant
- 3.5.1.5. Competitive Rivalry
- 3.5.1. Industry Analysis - Porter's
- 3.6. Roadmap of Blended Spices Market
- 3.7. Market Entry Strategies
- 3.8. Impact of COVID-19 on the Blended Spices Market
Chapter 4. Consumer Behavior Analysis
- 4.1. Demographic Analysis
- 4.2. Consumer Trends and Preferences
- 4.3. Factors Affecting Buying Decision
- 4.4. Consumer Product Adoption
- 4.5. Observations & Recommendations
Chapter 5. Blended SpicesMarket: Type Estimates & Trend Analysis
- 5.1. Type Movement Analysis & Market Share, 2021 & 2030
- 5.2. Garam Masala
- 5.2.1. Marketestimates and forecast,2017 - 2030 (USD Million)
- 5.3. Berbere
- 5.3.1. Market estimates and forecast, 2017 - 2030 (USD Million)
- 5.4. 5 Chinese Spices
- 5.4.1. Market estimates and forecast, 2017 - 2030 (USD Million)
- 5.5. Shichimi Togarashi
- 5.5.1. Market estimates and forecast, 2017 - 2030 (USD Million)
- 5.6. Others
- 5.6.1. Market estimates and forecast, 2017 - 2030 (USD Million)
Chapter 6. Blended Spices Market Distribution Channel Estimates & Trend Analysis
- 6.1. Distribution Channel Movement Analysis & Market Share, 2021 & 2030
- 6.2. B2B
- 6.2.1. Market estimates and forecast, through off-trade channel, 2017 - 2030 (USD Million)
- 6.3. B2C
- 6.3.1. Market estimates and forecast, through off-trade channel, 2017 - 2030 (USD Million)
Chapter 7. Blended Spices Market: Regional Estimates & Trend Analysis
- 7.1. Regional Movement Analysis & Market Share, 2021 & 2030
- 7.2. North America
- 7.2.1. Market estimates and forecast, 2017 - 2030 (USD Million)
- 7.2.2. Market estimates and forecast, by type, 2017 - 2030 (USD Million)
- 7.2.3. Market estimates and forecast, by distribution channel, 2017 - 2030 (USD Million)
- 7.2.4. U.S.
- 7.2.4.1. Market estimates and forecast, 2017 - 2030 (USD Million)
- 7.2.4.2. Market estimates and forecast, by type, 2017 - 2030 (USD Million)
- 7.2.4.3. Market estimates and forecast, by distribution channel, 2017 - 2030 (USD Million)
- 7.2.5. Canada
- 7.2.5.1. Market estimates and forecast, 2017 - 2030 (USD Million)
- 7.2.5.2. Market estimates and forecast, by type, 2017 - 2030 (USD Million)
- 7.2.5.3. Market estimates and forecast, by distribution channel, 2017 - 2030 (USD Million)
- 7.2.6. Mexico
- 7.2.6.1. Market estimates and forecast, 2017 - 2030 (USD Million)
- 7.2.6.2. Market estimates and forecast, by type, 2017 - 2030 (USD Million)
- 7.2.6.3. Market estimates and forecast, by distribution channel, 2017 - 2030 (USD Million)
- 7.3. Europe
- 7.3.1. Market estimates and forecast, 2017 - 2030 (USD Million)
- 7.3.2. Market estimates and forecast, by type, 2017 - 2030 (USD Million)
- 7.3.3. Market estimates and forecast, by distribution channel, 2017 - 2030 (USD Million)
- 7.3.4. U.K.
- 7.3.4.1. Market estimates and forecast, 2017 - 2030 (USD Million)
- 7.3.4.2. Market estimates and forecast, by type, 2017 - 2030 (USD Million)
- 7.3.4.3. Market estimates and forecast, by distribution channel, 2017 - 2030 (USD Million)
- 7.3.5. Germany
- 7.3.5.1. Market estimates and forecast, 2017 - 2030 (USD Million)
- 7.3.5.2. Market estimates and forecast, by type, 2017 - 2030 (USD Million)
- 7.3.5.3. Market estimates and forecast, by distribution channel, 2017 - 2030 (USD Million)
- 7.3.6. France
- 7.3.6.1. Market estimates and forecast, 2017 - 2030 (USD Million)
- 7.3.6.2. Market estimates and forecast, by type, 2017 - 2030 (USD Million)
- 7.3.6.3. Market estimates and forecast, by distribution channel, 2017 - 2030 (USD Million)
- 7.3.7. Italy
- 7.3.7.1. Market estimates and forecast, 2017 - 2030 (USD Million)
- 7.3.7.2. Market estimates and forecast, by type, 2017 - 2030 (USD Million)
- 7.3.7.3. Market estimates and forecast, by distribution channel, 2017 - 2030 (USD Million)
- 7.4. Asia Pacific
- 7.4.1. Market estimates and forecast, 2017 - 2030 (USD Million)
- 7.4.2. Market estimates and forecast, by type, 2017 - 2030 (USD Million)
- 7.4.3. Market estimates and forecast, by distribution channel, 2017 - 2030 (USD Million)
- 7.4.4. China
- 7.4.4.1. Market estimates and forecast, 2017 - 2030 (USD Million)
- 7.4.4.2. Market estimates and forecast, by type, 2017 - 2030 (USD Million)
- 7.4.4.3. Market estimates and forecast, by distribution channel, 2017 - 2030 (USD Million)
- 7.4.5. Bangladesh
- 7.4.5.1. Market estimates and forecast, 2017 - 2030 (USD Million)
- 7.4.5.2. Market estimates and forecast, by type, 2017 - 2030 (USD Million)
- 7.4.5.3. Market estimates and forecast, by distribution channel, 2017 - 2030 (USD Million)
- 7.4.6. India
- 7.4.6.1. Market estimates and forecast, 2017 - 2030 (USD Million)
- 7.4.6.2. Market estimates and forecast, by type, 2017 - 2030 (USD Million)
- 7.4.6.3. Market estimates and forecast, by distribution channel, 2017 - 2030 (USD Million)
- 7.4.7. Indonesia
- 7.4.7.1. Market estimates and forecast, 2017 - 2030 (USD Million)
- 7.4.7.2. Market estimates and forecast, by type, 2017 - 2030 (USD Million)
- 7.4.7.3. Market estimates and forecast, by distribution channel, 2017 - 2030 (USD Million)
- 7.4.8. Thailand
- 7.4.8.1. Market estimates and forecast, 2017 - 2030 (USD Million)
- 7.4.8.2. Market estimates and forecast, by type, 2017 - 2030 (USD Million)
- 7.4.8.3. Market estimates and forecast, by distribution channel, 2017 - 2030 (USD Million)
- 7.5. Central & South America
- 7.5.1. Market estimates and forecast, 2017 - 2030 (USD Million)
- 7.5.2. Market estimates and forecast, by type, 2017 - 2030 (USD Million)
- 7.5.3. Market estimates and forecast, by distribution channel, 2017 - 2030 (USD Million)
- 7.5.4. Brazil
- 7.5.4.1. Market estimates and forecast, 2017 - 2030 (USD Million)
- 7.5.4.2. Market estimates and forecast, by type, 2017 - 2030 (USD Million)
- 7.5.4.3. Market estimates and forecast, by distribution channel, 2017 - 2030 (USD Million)
- 7.6. Middle East & Africa
- 7.6.1. Market estimates and forecast, 2017 - 2030 (USD Million)
- 7.6.2. Market estimates and forecast, by type, 2017 - 2030 (USD Million)
- 7.6.3. Market estimates and forecast, by distribution channel, 2017 - 2030 (USD Million)
- 7.6.4. UAE
- 7.6.4.1. Market estimates and forecast, 2017 - 2030 (USD Million)
- 7.6.4.2. Market estimates and forecast, by type, 2017 - 2030 (USD Million)
- 7.6.4.3. Market estimates and forecast, by distribution channel, 2017 - 2030 (USD Million)
- 7.6.5. Saudi Arabia
- 7.6.5.1. Market estimates and forecast, 2017 - 2030 (USD Million)
- 7.6.5.2. Market estimates and forecast, by type, 2017 - 2030 (USD Million)
- 7.6.5.3. Market estimates and forecast, by distribution channel, 2017 - 2030 (USD Million)
Chapter 8. Competitive Analysis
- 8.1. Key global players, recent developments & their impact on the industry
- 8.2. Key Company/Competition Categorization (Key innovators, Market leaders, Emerging players)
- 8.3. Vendor Landscape
- 8.3.1. Key company market share analysis, 2021
Chapter 9. Company Profiles
- 9.1. Spices, Inc.
- 9.1.1. Company Overview
- 9.1.2. Financial Performance
- 9.1.3. ProductBenchmarking
- 9.1.4. Strategic Initiatives
- 9.2. Tony Chachere's
- 9.2.1. Company Overview
- 9.2.2. Financial Performance
- 9.2.3. ProductBenchmarking
- 9.2.4. Strategic Initiatives
- 9.3. Empresas Tajin
- 9.3.1. Company Overview
- 9.3.2. Financial Performance
- 9.3.3. ProductBenchmarking
- 9.3.4. Strategic Initiatives
- 9.4. Badia Spices, Inc.
- 9.4.1. Company Overview
- 9.4.2. Financial Performance
- 9.4.3. ProductBenchmarking
- 9.4.4. Strategic Initiatives
- 9.5. Mahashian Di Hatti Private Limited
- 9.5.1. Company Overview
- 9.5.2. Financial Performance
- 9.5.3. ProductBenchmarking
- 9.5.4. Strategic Initiatives
- 9.6. Shan Foods (Pvt.) Ltd.
- 9.6.1. Company Overview
- 9.6.2. Financial Performance
- 9.6.3. ProductBenchmarking
- 9.6.4. Strategic Initiatives
- 9.7. McCormick & Company, Incorporated
- 9.7.1. Company Overview
- 9.7.2. Financial Performance
- 9.7.3. ProductBenchmarking
- 9.7.4. Strategic Initiatives
- 9.8. Everest Food Products Pvt. Ltd.
- 9.8.1. Company Overview
- 9.8.2. Financial Performance
- 9.8.3. ProductBenchmarking
- 9.8.4. Strategic Initiatives
- 9.9. World of Spice Ltd.
- 9.9.1. Company Overview
- 9.9.2. Financial Performance
- 9.9.3. ProductBenchmarking
- 9.9.4. Strategic Initiatives
- 9.10. MTR Foods Pvt Ltd.
- 9.10.1. Company Overview
- 9.10.2. Financial Performance
- 9.10.3. Product Benchmarking
- 9.10.4. Strategic Initiatives