|
|
市場調査レポート
商品コード
1122247
低糖質食品と飲料の市場規模、シェア、動向分析レポート:製品別(ベーカリー、飲料、菓子類、乳製品、スナック)、流通チャネル別(スーパーマーケット、ハイパーマーケット)、地域別、セグメント別予測、2022~2030年版Reduced Sugar Food & Beverages Market Size, Share & Trends Analysis Report By Product (Bakery, Beverages, Confectionery, Dairy, Snacks), By Distribution Channel (Supermarkets & Hypermarkets), By Region, And Segment Forecasts, 2022 - 2030 |
||||||
|
|
|||||||
|
● お客様のご希望に応じて、既存データの加工や未掲載情報(例:国別セグメント)の追加などの対応が可能です。 詳細はお問い合わせください。 |
|||||||


| 低糖質食品と飲料の市場規模、シェア、動向分析レポート:製品別(ベーカリー、飲料、菓子類、乳製品、スナック)、流通チャネル別(スーパーマーケット、ハイパーマーケット)、地域別、セグメント別予測、2022~2030年版 |
|
出版日: 2022年08月03日
発行: Grand View Research
ページ情報: 英文 80 Pages
納期: 2~10営業日
|
- 全表示
- 概要
- 図表
- 目次
低糖質食品と飲料の市場成長と動向
Grand View Research, Inc.の最新レポートによると、世界の低糖質食品&飲食品の市場規模は、予測期間中にCAGR 8.9%を記録し、2030年までに997億9000万米ドルに達すると予想されています。糖分やカロリーを抑えた健康的な食品に対する世界の意識の高まりが、市場成長の主要な推進要因となっています。さらに、世界各地でロックダウンしている消費者の食品消費パターンが大きく変化していることも、市場成長の一因となっています。市場成長に寄与するその他の要因としては、世界中で糖尿病および肥満の人口が増加していることが挙げられます。
複数の健康上の利点があるため、COVID-19の大流行時に低糖質食品と飲料の需要が急増しました。カロリーや糖分を最小限に抑えた健康食品は、栄養価の高い食材の需要に応えるため、パンデミックの間に人気を博しました。体力維持に重点が置かれるようになったことが、COVID-19の流行期間中に市場の成長を促す主な要因となっています。また、WHOなどの各種保健機関も、免疫システムを強固に維持し、COVID-19に感染するリスクを下げるために、甘味料をあまり含まないバランスの取れた食事を推奨しています。さらに、パンデミック時にオンライン食料品販売が増加したことも、市場拡大につながりました。
2021年の市場シェアは、飲料部門が大きく寄与しています。この市場は主に、世界中で健康的で甘味の少ないエネルギー飲料やスポーツドリンクに対する大きな需要があるために牽引されています。さらに、砂糖が少なくミネラルを多く含むフレーバーウォーターや炭酸飲料の需要の高まりが、市場の成長にさらに寄与しています。さまざまな健康団体が、飲料の砂糖摂取量を制限することで、人工甘味料を使用しない清涼飲料水の利用が世界的に増加すると提唱しています。
オンライン分野は、予測期間中にかなりの成長を記録すると予想されます。製品販売を改善するためのeコマース技術の導入に対する飲食品企業の注目が高まっていることが、市場成長の要因として挙げられます。オンライン販売プラットフォームを活用することで、低糖質食品と飲料プロバイダーは、最小限の在職期間でのドアステップデリバリーを選択しました。さらに、食料品買い物のためのオンラインプラットフォームに対する世界の消費者の魅力の拡大は、予測期間中の市場拡大につながります。
欧州は、長期的な健康を維持するために英国、ドイツ、フランスで健康とウェルネス食品に対する需要が増加しているため、かなりの収益シェアを占め、これが市場成長を促進しています。また、スペインやイタリアでは、低糖質のパンや菓子類の販売が大幅に伸びており、市場シェアに貢献しています。さらに、ソーシャルメディアを通じての低糖質スナックのプロモーションの拡大が、同地域での低糖質食品・飲料の需要を高めています。
低糖質食品と飲料市場のレポートハイライト
欧州は2021年に25%以上の大きな収益シェアを占め、2022年から2030年にかけてCAGR8.7%で成長すると予測されています。この市場貢献は、すべての年齢層の市民にとって最高の健康的な食事の選択肢として、低糖食品&飲料の著しい人気があることに起因しています。
2021年には、飲料分野が40%以上の最大の市場シェアを占めると推定されます。世界中で糖分を抑えた様々なスポーツドリンクやエナジードリンクの需要が高まっていることが最大のシェアに貢献しています。
オンライン分野は、2022年から2030年までのCAGRが10.1%となり、予測期間中に最も速い成長を記録すると予想されます。世界中で食料品の買い物にオンラインショッピングポータルやモバイルアプリを利用する人が増えていることが、セグメントの成長を支えるものと予想されます。
目次
第1章 調査手法と範囲
- 市場セグメンテーションと範囲
- 市場の定義
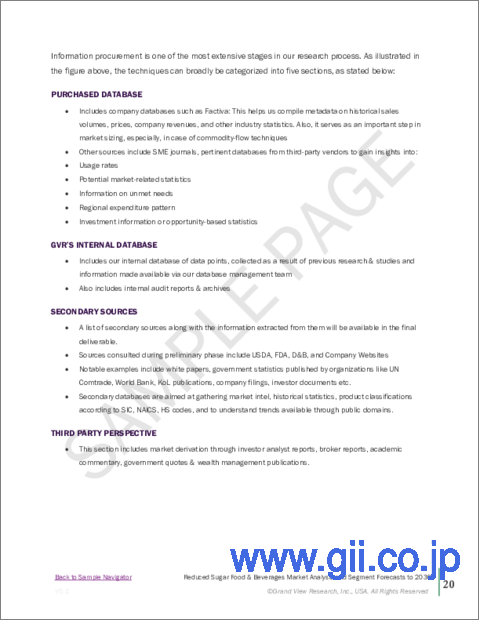
- 情報調達
- 購入したデータベース
- GVRの内部データベース
- 二次製品とサードパーティの視点
- 1次調査
- 情報分析
- データ分析モデル
- 市場形成とデータ可視化
- データの検証と公開
第2章 エグゼクティブサマリー
- 市場の見通し
- 製品の見通し
- 流通経路の見通し
- 地域の見通し
第3章 低糖質食品と飲料市場の変数、動向、および範囲
- 市場イントロダクション
- 浸透と成長の見通しのマッピング
- 業界バリューチェーン分析
- 販売・小売チャネル分析
- 利益率分析
- 市場力学
- 市場促進要因分析
- 市場制約分析
- 業界の課題
- 業界の機会
- 事業環境分析
- 業界分析- ポーターズ
- サプライヤーの力
- 買い手の交渉力
- 代替の脅威
- 新規参入者からの脅威
- 競争企業間の敵対関係
- 業界分析- ポーターズ
- 減糖食品・飲料市場のロードマップ
- 市場参入戦略
- 低糖質食品と飲料市場に対するCOVID-19の影響
第4章 消費者行動分析
- 人口統計分析
- 消費者の動向と好み
- 購入決定に影響を与える要因
- 消費者製品の採用
- 所見と推奨事項
第5章 低糖質食品と飲料市場:製品の推定・動向分析
- 製品変動分析と市場シェア、2021年と2030年
- ベーカリー
- 飲料
- 菓子類
- 乳製品
- おやつ
- その他
第6章 低糖質食品と飲料市場:流通チャネルの推定・動向分析
- 流通チャネルの変動分析と市場シェア、2021年と2030年
- スーパーマーケットとハイパーマーケット
- コンビニエンスストア
- オンライン
- その他
第7章 低糖質食品と飲料市場:地域推定・動向分析
- 地域別変動分析と市場シェア、2021年と2030年
- 北米
- 米国
- カナダ
- メキシコ
- 欧州
- 英国
- ドイツ
- フランス
- スウェーデン
- スペイン
- アジア太平洋地域
- 中国
- インド
- 日本
- 韓国
- オーストラリア
- 中南米
- ブラジル
- 中東とアフリカ
- 南アフリカ
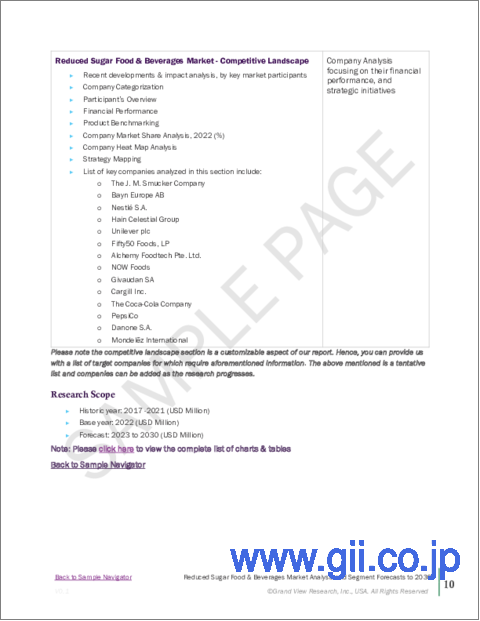
第8章 競合分析
- 主要な世界プレーヤー、最近の動向、業界への影響
- 主要企業/競合の分類(主要なイノベーター、市場リーダー、新興企業)
- ベンダー情勢
- 主要企業の市場シェア分析、2021年
第9章 企業プロファイル
- The JM Smucker Company
- 会社概要
- 財務実績
- 製品のベンチマーク
- 戦略的イニシアチブ
- Bayn Europe AB
- 会社概要
- 財務実績
- 製品のベンチマーク
- 戦略的イニシアチブ
- Nestle SA
- 会社概要
- 財務実績
- 製品のベンチマーク
- 戦略的イニシアチブ
- Hain Celestial Group
- 会社概要
- 財務実績
- 製品のベンチマーク
- 戦略的イニシアチブ
- Unilever plc
- 会社概要
- 財務実績
- 製品のベンチマーク
- 戦略的イニシアチブ
- Fifty50 Foods, LP.
- 会社概要
- 財務実績
- 製品のベンチマーク
- 戦略的イニシアチブ
- Alchemy Foodtech Pte. Ltd.
- 会社概要
- 財務実績
- 製品のベンチマーク
- 戦略的イニシアチブ
- NOW Foods
- 会社概要
- 財務実績
- 製品のベンチマーク
- 戦略的イニシアチブ
- Givaudan SA
- 会社概要
- 財務実績
- 製品のベンチマーク
- 戦略的イニシアチブ
- Cargill Inc.
- 会社概要
- 財務実績
- 製品のベンチマーク
- 戦略的イニシアチブ
- The Coca-Cola Company
- 会社概要
- 財務実績
- 製品のベンチマーク
- 戦略的イニシアチブ
- PepsiCo.
- 会社概要
- 財務実績
- 製品のベンチマーク
- 戦略的イニシアチブ
- Danone SA
- 会社概要
- 財務実績
- 製品のベンチマーク
- 戦略的イニシアチブ
- Mondelez International
- 会社概要
- 財務実績
- 製品のベンチマーク
- 戦略的イニシアチブ
List of Tables
- 1. Reduced sugar food & beverages market- key market driver analysis
- 2. Reduced sugar food & beverages market- key market restraint analysis
- 3. Global reduced sugar bakery market estimates and forecast, 2017 - 2030 (USD Million)
- 4. Global reduced sugar beverages market estimates and forecast, 2017 - 2030 (USD Million)
- 5. Global reduced sugar confectionery market estimates and forecast, 2017 - 2030 (USD Million)
- 6. Global reduced sugar dairy market estimates and forecast, 2017 - 2030 (USD Million)
- 7. Global reduced sugar snacks market estimates and forecast, 2017 - 2030 (USD Million)
- 8. Global reduced sugar other products market estimates and forecast, 2017 - 2030 (USD Million)
- 9. Global reduced sugar food & beverages market estimates and forecast through supermarkets and hypermarkets, 2017 - 2030 (USD Million)
- 10. Global reduced sugar food & beverages market estimates and forecast through convenience stores, 2017 - 2030 (USD Million)
- 11. Global reduced sugar food & beverages market estimates and forecast through online channel, 2017 - 2030 (USD Million)
- 12. Global reduced sugar food & beverages market estimates and forecast through other distribution channels, 2017 - 2030 (USD Million)
- 13. North America reduced sugar food & beverages market estimates and forecast, 2017 - 2030 (USD Million)
- 14. North America reduced sugar food & beverages market estimates and forecast, by product, 2017 - 2030 (USD Million)
- 15. North America reduced sugar food & beverages market estimates and forecast, by distribution channel, 2017 - 2030 (USD Million)
- 16. U.S. reduced sugar food & beverages market estimates and forecast, 2017 - 2030 (USD Million)
- 17. U.S. reduced sugar food & beverages market estimates and forecast by product, 2017 - 2030 (USD Million)
- 18. U.S. reduced sugar food & beverages market estimates and forecast by distribution channel, 2017 - 2030 (USD Million)
- 19. Canada reduced sugar food & beverages market estimates and forecast, 2017 - 2030 (USD Million)
- 20. Canada reduced sugar food & beverages market estimates and forecast by product, 2017 - 2030 (USD Million)
- 21. Canada reduced sugar food & beverages market estimates and forecast by distribution channel, 2017 - 2030 (USD Million)
- 22. Mexico reduced sugar food & beverages market estimates and forecast, 2017 - 2030 (USD Million)
- 23. Mexico reduced sugar food & beverages market estimates and forecast by product, 2017 - 2030 (USD Million)
- 24. Mexico reduced sugar food & beverages market estimates and forecast by distribution channel, 2017 - 2030 (USD Million)
- 25. Europe reduced sugar food & beverages market estimates and forecast, 2017 - 2030 (USD Million)
- 26. Europe reduced sugar food & beverages market estimates and forecast by product, 2017 - 2030 (USD Million)
- 27. Europe reduced sugar food & beverages market estimates and forecast by distribution channel, 2017 - 2030 (USD Million)
- 28. U.K. reduced sugar food & beverages market estimates and forecast, 2017 - 2030 (USD Million)
- 29. U.K. reduced sugar food & beverages market estimates and forecast by product, 2017 - 2030 (USD Million)
- 30. U.K. reduced sugar food & beverages market estimates and forecast by distribution channel, 2017 - 2030 (USD Million)
- 31. Germany reduced sugar food & beverages market estimates and forecast, 2017 - 2030 (USD Million)
- 32. Germany reduced sugar food & beverages market estimates and forecast by product, 2017 - 2030 (USD Million)
- 33. Germany reduced sugar food & beverages market estimates and forecast by distribution channel, 2017 - 2030 (USD Million)
- 34. France reduced sugar food & beverages market estimates and forecast, 2017 - 2030 (USD Million)
- 35. France reduced sugar food & beverages market estimates and forecast by product, 2017 - 2030 (USD Million)
- 36. France reduced sugar food & beverages market estimates and forecast by distribution channel, 2017 - 2030 (USD Million)
- 37. Sweden reduced sugar food & beverages market estimates and forecast, 2017 - 2030 (USD Million)
- 38. Sweden reduced sugar food & beverages market estimates and forecast by product, 2017 - 2030 (USD Million)
- 39. Sweden reduced sugar food & beverages market estimates and forecast by distribution channel, 2017 - 2030 (USD Million)
- 40. Spain reduced sugar food & beverages market estimates and forecast, 2017 - 2030 (USD Million)
- 41. Spain reduced sugar food & beverages market estimates and forecast by product, 2017 - 2030 (USD Million)
- 42. Spain reduced sugar food & beverages market estimates and forecast by distribution channel, 2017 - 2030 (USD Million)
- 43. Asia Pacific reduced sugar food & beverages market estimates and forecast, 2017 - 2030 (USD Million)
- 44. Asia Pacific reduced sugar food & beverages market estimates and forecast by product, 2017 - 2030 (USD Million)
- 45. Asia Pacific reduced sugar food & beverages market estimates and forecast by distribution channel, 2017 - 2030 (USD Million)
- 46. China reduced sugar food & beverages market estimates and forecast, 2017 - 2030 (USD Million)
- 47. China reduced sugar food & beverages market estimates and forecast by product, 2017 - 2030 (USD Million)
- 48. China reduced sugar food & beverages market estimates and forecast by distribution channel, 2017 - 2030 (USD Million)
- 49. India reduced sugar food & beverages market estimates and forecast, 2017 - 2030 (USD Million)
- 50. India reduced sugar food & beverages market estimates and forecast by product, 2017 - 2030 (USD Million)
- 51. India reduced sugar food & beverages market estimates and forecast by distribution channel, 2017 - 2030 (USD Million)
- 52. Japan reduced sugar food & beverages market estimates and forecast, 2017 - 2030 (USD Million)
- 53. Japan reduced sugar food & beverages market estimates and forecast by product, 2017 - 2030 (USD Million)
- 54. Japan reduced sugar food & beverages market estimates and forecast by distribution channel, 2017 - 2030 (USD Million)
- 55. South Korea reduced sugar food & beverages market estimates and forecast, 2017 - 2030 (USD Million)
- 56. South Korea reduced sugar food & beverages market estimates and forecast by product, 2017 - 2030 (USD Million)
- 57. South Korea reduced sugar food & beverages market estimates and forecast by distribution channel, 2017 - 2030 (USD Million)
- 58. Australia reduced sugar food & beverages market estimates and forecast, 2017 - 2030 (USD Million)
- 59. Australia reduced sugar food & beverages market estimates and forecast by product, 2017 - 2030 (USD Million)
- 60. Australia reduced sugar food & beverages market estimates and forecast by distribution channel, 2017 - 2030 (USD Million)
- 61. Central & South America reduced sugar food & beverages market estimates and forecast, 2017 - 2030 (USD Million)
- 62. Central & South America reduced sugar food & beverages market estimates and forecast by product, 2017 - 2030 (USD Million)
- 63. Central & South America reduced sugar food & beverages market estimates and forecast by distribution channel, 2017 - 2030 (USD Million)
- 64. Brazil reduced sugar food & beverages market estimates and forecast, 2017 - 2030 (USD Million)
- 65. Brazil reduced sugar food & beverages market estimates and forecast by product, 2017 - 2030 (USD Million)
- 66. Brazil reduced sugar food & beverages market estimates and forecast by distribution channel, 2017 - 2030 (USD Million)
- 67. Middle East & Africa reduced sugar food & beverages market estimates and forecast, 2017 - 2030 (USD Million)
- 68. Middle East & Africa reduced sugar food & beverages market estimates and forecast by product, 2017 - 2030 (USD Million)
- 69. Middle East & Africa reduced sugar food & beverages market estimates and forecast by distribution channel, 2017 - 2030 (USD Million)
- 70. South Africa reduced sugar food & beverages market estimates and forecast, 2017 - 2030 (USD Million)
- 71. South Africa reduced sugar food & beverages market estimates and forecast by product, 2017 - 2030 (USD Million)
- 72. South Africa reduced sugar food & beverages market estimates and forecast by distribution channel, 2017 - 2030 (USD Million)
- 73. Vendor landscape
List of Figures
- 1. Reduced sugar food & beverages market snapshot
- 2. Reduced sugar food & beverages market segmentation & scope
- 3. Reduced sugar food & beverages market penetration & growth prospect mapping
- 4. Reduced sugar food & beverages market value chain analysis
- 5. Reduced sugar food & beverages market dynamics
- 6. Reduced sugar food & beverages market porter's analysis
- 7. Reduced sugar food & beverages market: product movement analysis
- 8. Reduced sugar food & beverages market: distribution channel movement analysis
- 9. Reduced sugar food & beverages market: regional movement analysis
Reduced Sugar Food & Beverages Market Growth & Trends:
The global reduced sugar food & beverages market size is expected to reach USD 99.79 billion by 2030, registering a CAGR of 8.9% over the forecast period, according to a new report by Grand View Research, Inc. The growing global awareness of healthy foods with reduced sugar and calories is a primary driving factor for market growth. Furthermore, significant changes in the food consumption patterns of consumers in lockdown across the globe aided market growth. The other factors that contribute to market growth include the growing diabetic and obese population across the globe.
Due to the multiple health benefits, the demand for reduced sugar food and beverages has surged during the COVID-19 pandemic. Healthy foods with minimal calorie and sugar content gained popularity during the pandemic to meet the demand for nutritious ingredients. The increased emphasis on maintaining physical fitness is a primary factor driving the market growth during the COVID-19 outbreak. In addition, various health organizations such as WHO also recommended a well-balanced diet that contains less sweetened goods to maintain a robust immune system and lower the risk of acquiring COVID-19. Furthermore, the increase in online grocery sales during the pandemic led to market expansion.
The beverages segment contributed to a significant market share in 2021. The market is mainly driven owing to the significant demand for healthy and less sweetened energy and sports drinks across the globe. Moreover, the rising demand for flavored water and carbonated soft drinks containing less sugar and high minerals further contributes to the market growth. Various health groups have advocated that limiting sugar intake in beverages increases the global use of fewer artificial sweetener-based soft drinks.
The online segment is expected to register considerable growth during the forecast years. The growing attention of food and beverage businesses on implementing e-commerce technology to improve product sales can be attributed to the market growth. By utilizing the online sales platform, the reduced sugar food and beverage providers have chosen door-step delivery with minimal tenure. Furthermore, the expanding global consumer attraction toward an online platform for grocery shopping leads to market expansion over the forecast period.
Europe accounted for a substantial revenue share due to increased demand for health and wellness food products in the U.K., Germany, and France to preserve long-term health, which is driving the market growth. Furthermore, considerable growth in sales of low-sugar bread and confectionery items in Spain and Italy contributed to the market share. Furthermore, the expanding promotion of fewer sugar-based snacks via social media raised the demand for reduced sugar food and beverages in the region.
Reduced Sugar Food & Beverages Market Report Highlights:
- Europe holds a significant revenue share of over 25% in 2021 and is expected to grow with a CAGR of 8.7% from 2022 to 2030. This market contribution is attributed to the significant popularity of the low sugar food & beverages as the best healthy diet option for all age groups citizens
- The beverages segment is estimated to contribute the largest market share of over 40% of the market in 2021. The rising demand for various sports and energy drinks having less sugar content across the globe contributed to the largest share
- The online segment is expected to register the fastest growth during the forecast years, with a CAGR of 10.1% from 2022 to 2030. The increasing use of online shopping portals and mobile apps for grocery shopping around the world is expected to support segment growth
Table of Contents
Chapter 1. Methodology and Scope
- 1.1. Market Segmentation & Scope
- 1.2. Market Definition
- 1.3. Information Procurement
- 1.3.1. Purchased Database
- 1.3.2. GVR's Internal Database
- 1.3.3. Secondary Products & Third-Party Perspectives
- 1.3.4. Primary Research
- 1.4. Information Analysis
- 1.4.1. Data Analysis Models
- 1.5. Market Formulation & Data Visualization
- 1.6. Data Validation & Publishing
Chapter 2. Executive Summary
- 2.1. Market Outlook
- 2.2. Product Outlook
- 2.3. Distribution Channel Outlook
- 2.4. Regional Outlook
Chapter 3. Reduced Sugar Food & Beverages Market Variables, Trends & Scope
- 3.1. Market Introduction
- 3.2. Penetration & Growth Prospect Mapping
- 3.3. Industry Value Chain Analysis
- 3.3.1. Sales/Retail Channel Analysis
- 3.3.2. Profit Margin Analysis
- 3.4. Market Dynamics
- 3.4.1. Market Driver Analysis
- 3.4.2. Market Restraint Analysis
- 3.4.3. Industry Challenges
- 3.4.4. Industry Opportunities
- 3.5. Business Environment Analysis
- 3.5.1. Industry Analysis - Porter's
- 3.5.1.1. Supplier Power
- 3.5.1.2. Buyer Power
- 3.5.1.3. Substitution Threat
- 3.5.1.4. Threat from New Entrant
- 3.5.1.5. Competitive Rivalry
- 3.5.1. Industry Analysis - Porter's
- 3.6. Roadmap of reduced sugar food & beverages market
- 3.7. Market Entry Strategies
- 3.8. Impact of COVID-19 on the reduced sugar food & beverages market
Chapter 4. Consumer Behavior Analysis
- 4.1. Demographic Analysis
- 4.2. Consumer Trends and Preferences
- 4.3. Factors Affecting Buying Decision
- 4.4. Consumer Product Adoption
- 4.5. Observations & Recommendations
Chapter 5. Reduced Sugar Food & Beverages Market: Product Estimates & Trend Analysis
- 5.1. Product Movement Analysis & Market Share, 2021 & 2030
- 5.2. Bakery
- 5.2.1. Market estimates and forecast, 2017 - 2030 (USD Million)
- 5.3. Beverages
- 5.3.1. Market estimates and forecast, 2017 - 2030 (USD Million)
- 5.4. Confectionery
- 5.4.1. Market estimates and forecast, 2017 - 2030 (USD Million)
- 5.5. Dairy
- 5.5.1. Market estimates and forecast, 2017 - 2030 (USD Million)
- 5.6. Snacks
- 5.6.1. Market estimates and forecast, 2017 - 2030 (USD Million)
- 5.7. Others
- 5.7.1. Market estimates and forecast, 2017 - 2030 (USD Million)
Chapter 6. Reduced Sugar Food & Beverages Market: Distribution Channel Estimates & Trend Analysis
- 6.1. Distribution Channel Movement Analysis & Market Share, 2021 & 2030
- 6.2. Supermarkets and Hypermarkets
- 6.2.1. Market estimates and forecast, 2017 - 2030 (USD Million)
- 6.3. Convenience Stores
- 6.3.1. Market estimates and forecast, 2017 - 2030 (USD Million)
- 6.4. Online
- 6.4.1. Market estimates and forecast, 2017 - 2030 (USD Million)
- 6.5. Others
- 6.5.1. Market estimates and forecast, 2017 - 2030 (USD Million)
Chapter 7. Reduced Sugar Food & Beverages Market: Regional Estimates & Trend Analysis
- 7.1. Regional Movement Analysis & Market Share, 2021 & 2030
- 7.2. North America
- 7.2.1. Market estimates and forecast, 2017 - 2030 (USD Million)
- 7.2.2. Market estimates and forecast, by product, 2017 - 2030 (USD Million)
- 7.2.3. Market estimates and forecast, by distribution channel, 2017 - 2030 (USD Million)
- 7.2.4. U.S.
- 7.2.4.1. Market estimates and forecast, 2017 - 2030 (USD Million)
- 7.2.4.2. Market estimates and forecast, by product, 2017 - 2030 (USD Million)
- 7.2.4.3. Market estimates and forecast, by distribution channel, 2017 - 2030 (USD Million)
- 7.2.5. Canada
- 7.2.5.1. Market estimates and forecast, 2017 - 2030 (USD Million)
- 7.2.5.2. Market estimates and forecast, by product, 2017 - 2030 (USD Million)
- 7.2.5.3. Market estimates and forecast, by distribution channel, 2017 - 2030 (USD Million)
- 7.2.6. Mexico
- 7.2.6.1. Market estimates and forecast, 2017 - 2030 (USD Million)
- 7.2.6.2. Market estimates and forecast, by product, 2017 - 2030 (USD Million)
- 7.2.6.3. Market estimates and forecast, by distribution channel, 2017 - 2030 (USD Million)
- 7.3. Europe
- 7.3.1. Market estimates and forecast, 2017 - 2030 (USD Million)
- 7.3.2. Market estimates and forecast, by product, 2017 - 2030 (USD Million)
- 7.3.3. Market estimates and forecast, by distribution channel, 2017 - 2030 (USD Million)
- 7.3.4. U.K.
- 7.3.4.1. Market estimates and forecast, 2017 - 2030 (USD Million)
- 7.3.4.2. Market estimates and forecast, by product, 2017 - 2030 (USD Million)
- 7.3.4.3. Market estimates and forecast, by distribution channel, 2017 - 2030 (USD Million)
- 7.3.5. Germany
- 7.3.5.1. Market estimates and forecast, 2017 - 2030 (USD Million)
- 7.3.5.2. Market estimates and forecast, by product, 2017 - 2030 (USD Million)
- 7.3.5.3. Market estimates and forecast, by distribution channel, 2017 - 2030 (USD Million)
- 7.3.6. France
- 7.3.6.1. Market estimates and forecast, 2017 - 2030 (USD Million)
- 7.3.6.2. Market estimates and forecast, by product, 2017 - 2030 (USD Million)
- 7.3.6.3. Market estimates and forecast, by distribution channel, 2017 - 2030 (USD Million)
- 7.3.7. Sweden
- 7.3.7.1. Market estimates and forecast, 2017 - 2030 (USD Million)
- 7.3.7.2. Market estimates and forecast, by product, 2017 - 2030 (USD Million)
- 7.3.7.3. Market estimates and forecast, by distribution channel, 2017 - 2030 (USD Million)
- 7.3.8. Spain
- 7.3.8.1. Market estimates and forecast, 2017 - 2030 (USD Million)
- 7.3.8.2. Market estimates and forecast, by product, 2017 - 2030 (USD Million)
- 7.3.8.3. Market estimates and forecast, by distribution channel, 2017 - 2030 (USD Million)
- 7.4. Asia Pacific
- 7.4.1. Market estimates and forecast, 2017 - 2030 (USD Million)
- 7.4.2. Market estimates and forecast, by product, 2017 - 2030 (USD Million)
- 7.4.3. Market estimates and forecast, by distribution channel, 2017 - 2030 (USD Million)
- 7.4.4. China
- 7.4.4.1. Market estimates and forecast, 2017 - 2030 (USD Million)
- 7.4.4.2. Market estimates and forecast, by product, 2017 - 2030 (USD Million)
- 7.4.4.3. Market estimates and forecast, by distribution channel, 2017 - 2030 (USD Million)
- 7.4.5. India
- 7.4.5.1. Market estimates and forecast, 2017 - 2030 (USD Million)
- 7.4.5.2. Market estimates and forecast, by product, 2017 - 2030 (USD Million)
- 7.4.5.3. Market estimates and forecast, by distribution channel, 2017 - 2030 (USD Million)
- 7.4.6. Japan
- 7.4.6.1. Market estimates and forecast, 2017 - 2030 (USD Million)
- 7.4.6.2. Market estimates and forecast, by product, 2017 - 2030 (USD Million)
- 7.4.6.3. Market estimates and forecast, by distribution channel, 2017 - 2030 (USD Million)
- 7.4.7. South Korea
- 7.4.7.1. Market estimates and forecast, 2017 - 2030 (USD Million)
- 7.4.7.2. Market estimates and forecast, by product, 2017 - 2030 (USD Million)
- 7.4.7.3. Market estimates and forecast, by distribution channel, 2017 - 2030 (USD Million)
- 7.4.8. Australia
- 7.4.8.1. Market estimates and forecast, 2017 - 2030 (USD Million)
- 7.4.8.2. Market estimates and forecast, by product, 2017 - 2030 (USD Million)
- 7.4.8.3. Market estimates and forecast, by distribution channel, 2017 - 2030 (USD Million)
- 7.5. Central & South America
- 7.5.1. Market estimates and forecast, 2017 - 2030 (USD Million)
- 7.5.2. Market estimates and forecast, by product, 2017 - 2030 (USD Million)
- 7.5.3. Market estimates and forecast, by distribution channel, 2017 - 2030 (USD Million)
- 7.5.4. Brazil
- 7.5.4.1. Market estimates and forecast, 2017 - 2030 (USD Million)
- 7.5.4.2. Market estimates and forecast, by product, 2017 - 2030 (USD Million)
- 7.5.4.3. Market estimates and forecast, by distribution channel, 2017 - 2030 (USD Million)
- 7.6. Middle East & Africa
- 7.6.1. Market estimates and forecast, 2017 - 2030 (USD Million)
- 7.6.2. Market estimates and forecast, by product, 2017 - 2030 (USD Million)
- 7.6.3. Market estimates and forecast, by distribution channel, 2017 - 2030 (USD Million)
- 7.6.4. South Africa
- 7.6.4.1. Market estimates and forecast, 2017 - 2030 (USD Million)
- 7.6.4.2. Market estimates and forecast, by product, 2017 - 2030 (USD Million)
- 7.6.4.3. Market estimates and forecast, by distribution channel, 2017 - 2030 (USD Million)
Chapter 8. Competitive Analysis
- 8.1. Key global players, recent developments & their impact on the industry
- 8.2. Key Company/Competition Categorization (Key innovators, Market leaders, Emerging players)
- 8.3. Vendor Landscape
- 8.3.1. Key company market share analysis, 2021
Chapter 9. Company Profiles
- 9.1. The J. M. Smucker Company
- 9.1.1. Company Overview
- 9.1.2. Financial Performance
- 9.1.3. Product Benchmarking
- 9.1.4. Strategic Initiatives
- 9.2. Bayn Europe AB
- 9.2.1. Company Overview
- 9.2.2. Financial Performance
- 9.2.3. Product Benchmarking
- 9.2.4. Strategic Initiatives
- 9.3. Nestle S.A.
- 9.3.1. Company Overview
- 9.3.2. Financial Performance
- 9.3.3. Product Benchmarking
- 9.3.4. Strategic Initiatives
- 9.4. Hain Celestial Group
- 9.4.1. Company Overview
- 9.4.2. Financial Performance
- 9.4.3. Product Benchmarking
- 9.4.4. Strategic Initiatives
- 9.5. Unilever plc
- 9.5.1. Company Overview
- 9.5.2. Financial Performance
- 9.5.3. Product Benchmarking
- 9.5.4. Strategic Initiatives
- 9.6. Fifty50 Foods, LP.
- 9.6.1. Company Overview
- 9.6.2. Financial Performance
- 9.6.3. Product Benchmarking
- 9.6.4. Strategic Initiatives
- 9.7. Alchemy Foodtech Pte. Ltd.
- 9.7.1. Company Overview
- 9.7.2. Financial Performance
- 9.7.3. Product Benchmarking
- 9.7.4. Strategic Initiatives
- 9.8. NOW Foods
- 9.8.1. Company Overview
- 9.8.2. Financial Performance
- 9.8.3. Product Benchmarking
- 9.8.4. Strategic Initiatives
- 9.9. Givaudan SA
- 9.9.1. Company Overview
- 9.9.2. Financial Performance
- 9.9.3. Product Benchmarking
- 9.9.4. Strategic Initiatives
- 9.10. Cargill Inc.
- 9.10.1. Company Overview
- 9.10.2. Financial Performance
- 9.10.3. Product Benchmarking
- 9.10.4. Strategic Initiatives
- 9.11. The Coca-Cola Company
- 9.11.1. Company Overview
- 9.11.2. Financial Performance
- 9.11.3. Product Benchmarking
- 9.11.4. Strategic Initiatives
- 9.12. PepsiCo.
- 9.12.1. Company Overview
- 9.12.2. Financial Performance
- 9.12.3. Product Benchmarking
- 9.12.4. Strategic Initiatives
- 9.13. Danone S.A.
- 9.13.1. Company Overview
- 9.13.2. Financial Performance
- 9.13.3. Product Benchmarking
- 9.13.4. Strategic Initiatives
- 9.14. Mondelez International
- 9.14.1. Company Overview
- 9.14.2. Financial Performance
- 9.14.3. Product Benchmarking
- 9.14.4. Strategic Initiatives