|
|
市場調査レポート
商品コード
1751309
更年期障害の市場規模、シェア、動向分析レポート:治療別、地域別、セグメント予測、2025年~2030年Menopause Market Size, Share & Trends Analysis Report By Treatment (Dietary Supplements, OTC Pharma Products), By Region (NA, Europe, APAC, Latin America, MEA), And Segment Forecasts, 2025 - 2030 |
||||||
|
|||||||
カスタマイズ可能
|
|||||||

| 更年期障害の市場規模、シェア、動向分析レポート:治療別、地域別、セグメント予測、2025年~2030年 |
|
出版日: 2025年05月02日
発行: Grand View Research
ページ情報: 英文 210 Pages
納期: 2~10営業日
|

全表示
- 概要
- 図表
- 目次
更年期障害市場の成長と動向:
Grand View Research, Inc.の最新レポートによると、世界の更年期障害市場規模は2025年から2030年にかけてCAGR 5.42%を記録し、2030年までに243億5,000万米ドルに達すると予測されています。
閉経後症候群の有病率の上昇、更年期に関連する健康面に関する意識の高まり、女性向け健康アプリの採用率の高さなどの要因が市場成長を牽引すると予測されます。
市場は、HRTに対する栄養補助食品の利点を支持する調査の高まりによって牽引されると予測されます。ブラックコホシュ、レッドクローバー、大豆イソフラボン、アンベレンなどの成分を含む多くの栄養補助食品が市場で入手可能です。メーカー各社も、更年期症状に対応する新製品の開発に取り組んでいます。例えば、モルファス社は2023年に、更年期と更年期障害の最も差し迫った症状のいくつかに対処するためのサプリメント製品をいくつか発売しました。最初に発売された製品はFiberUsで、グアー繊維から作られた無香料の水溶性プレバイオティック繊維です。
栄養補助食品とOTC医薬品の需要は、医師の予約の遅れ、ホルモン補充療法の再延期、小売薬局やオンライン・チャネルからのOTC医薬品の容易な入手により、パンデミック後のシナリオで増加しました。しかし、規制の緩和と更年期障害に対する意識の高まりにより、市場は現在安定しつつあります。
ほてりや寝汗の治療を目的とした医薬品のFDA承認が急増していることも、市場の成長を後押しする大きな要因となっています。2023年5月、FDAは、更年期に個人がしばしば経験する寝汗やほてりに対処する新しい非ホルモン薬を承認しました。フェゾリネタントと呼ばれるこの処方薬は、ホルモン療法を受けることができず、乳がん生存者などの血管運動症状に悩む人々のために特別にデザインされたものです。この薬はVeozahというブランド名で販売されています。
更年期障害市場レポートハイライト
- 治療法に基づくと、2024年には栄養補助食品治療分野が市場を独占し、予測期間中に最も速い成長が見込まれます。同分野の成長は、高齢者人口の増加や革新的製品の発売など、いくつかの要因によるものと考えられます。例えば、2021年4月、韓国の栄養補助食品会社であるPulmuone社は、更年期障害関連症状の治療のために大豆とホップの抽出物を含む製品を発表しました。
- OTC医薬品治療セグメントは、非ホルモン性製品とホルモン性製品に分類されます。更年期を迎えた女性は、市販の(OTC)ホルモン製品を使用することが多くなっています。このセグメントの主要製品には、局所プロゲステロン、イブプロフェン、デヒドロエピアンドロステロン(DHEA)、メラトニンなどがあります。
- 2024年には北米が最大の売上シェアを占めました。食事に関する意識が高まっており、高齢女性の間で特定の栄養ニーズに対する需要が高まっています。
- 2022年1月、Amyris, Inc.は、更年期障害の治療、女性の健康に関する調査、更年期障害に対する社会の理解増進に注力する女性創業企業MenoLabs, LLC.の資産を買収する独占契約を締結したと発表しました。
- 2023年1月、女性の健康ブランドであるオーポジティブは、史上初の更年期グミ・ビタミンを発売し、更年期の女性に便利でおいしい方法で症状を管理できるようにしました。
目次
第1章 調査手法と範囲
第2章 エグゼクティブサマリー
第3章 更年期市場の変数、動向、範囲
- 市場系統の見通し
- 親市場の見通し
- 市場力学
- 市場促進要因分析
- 市場抑制要因分析
- COVID-19による更年期市場への影響に関する定性分析
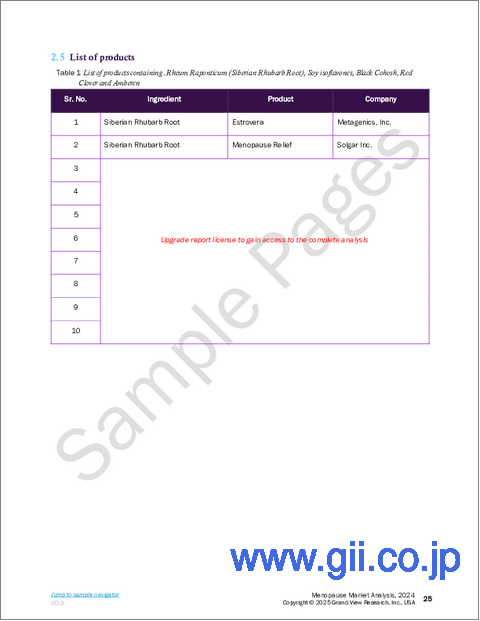
- 製品リスト
- ビジネス環境分析
- 業界分析- ポーターのファイブフォース分析
- PESTEL分析
第4章 更年期障害市場セグメント分析、治療別、2018年~2030年
- 更年期障害市場:治療別変動分析と市場シェア
- 更年期障害市場:治療別セグメントダッシュボード
- 栄養補助食品
- OTC医薬品
- ホルモン製品
- 非ホルモン製品
第5章 地域別、治療別、2018年~2030年
- 地域市場ダッシュボード
- 地域マーケットプレース:主なポイント
- 北米
- 北米の栄養補助食品市場
- 北米のOTC医薬品市場
- 米国
- カナダ
- メキシコ
- 欧州
- 欧州の栄養補助食品市場
- 欧州のOTC医薬品市場
- 英国
- ドイツ
- フランス
- イタリア
- スペイン
- オーストリア
- ノルウェー
- スウェーデン
- デンマーク
- アジア太平洋
- アジア太平洋地域の栄養補助食品市場
- アジア太平洋地域のOTC医薬品市場
- 日本
- 中国
- インド
- オーストラリア
- 韓国
- タイ
- 台湾
- マレーシア
- シンガポール
- ベトナム
- 香港
- ラテンアメリカ
- ラテンアメリカの栄養補助食品市場
- ラテンアメリカのOTC医薬品市場
- ブラジル
- アルゼンチン
- 中東・アフリカ
- MEAの栄養補助食品市場
- MEA OTC医薬品市場
- 南アフリカ
- サウジアラビア
- アラブ首長国連邦
- クウェート
第6章 競合情勢
- 主要市場参入企業による最近の動向と影響分析
- 企業分類
- ベンダー情勢
- 企業プロファイル
- Bayer AG
- Theramex
- AbbVie, Inc.
- Pure Encapsulations, LLC
- Dr. Reddy's Laboratories Ltd.
- ReNew Life Holdings Corporation
- Padagis
List of Tables
- Table 1 List of secondary sources
- Table 2 List of abbreviations
- Table 3 Global menopause market, by treatment, 2018 - 2030 (USD Million)
- Table 4 Global menopause market, by region, 2018 - 2030 (USD Million)
- Table 5 North America menopause market, by country, 2018 - 2030 (USD Million)
- Table 6 North America menopause market, by treatment, 2018 - 2030 (USD Million)
- Table 7 US menopause market, by treatment, 2018 - 2030 (USD Million)
- Table 8 Canada menopause market, by treatment, 2018 - 2030 (USD Million)
- Table 9 Mexico menopause market, by treatment, 2018 - 2030 (USD Million)
- Table 10 Europe menopause market, by country, 2018 - 2030 (USD Million)
- Table 11 Europe menopause market, by treatment, 2018 - 2030 (USD Million)
- Table 12 Germany menopause market, by treatment, 2018 - 2030 (USD Million)
- Table 13 UK menopause market, by treatment, 2018 - 2030 (USD Million)
- Table 14 France menopause market, by treatment, 2018 - 2030 (USD Million)
- Table 15 Italy menopause market, by treatment, 2018 - 2030 (USD Million)
- Table 16 Spain menopause market, by treatment, 2018 - 2030 (USD Million)
- Table 17 Norway menopause market, by treatment, 2018 - 2030 (USD Million)
- Table 18 Sweden menopause market, by treatment, 2018 - 2030 (USD Million)
- Table 19 Denmark menopause market, by treatment, 2018 - 2030 (USD Million)
- Table 20 Asia Pacific menopause market, by country, 2018 - 2030 (USD Million)
- Table 21 Asia Pacific menopause market, by treatment, 2018 - 2030 (USD Million)
- Table 22 China menopause market, by treatment, 2018 - 2030 (USD Million)
- Table 23 Japan menopause market, by treatment, 2018 - 2030 (USD Million)
- Table 24 India menopause market, by treatment, 2018 - 2030 (USD Million)
- Table 25 Australia menopause market, by treatment, 2018 - 2030 (USD Million)
- Table 26 South Korea menopause market, by treatment, 2018 - 2030 (USD Million)
- Table 27 Thailand menopause market, by treatment, 2018 - 2030 (USD Million)
- Table 28 Latin America menopause market, by country, 2018 - 2030 (USD Million)
- Table 29 Latin America menopause market, by treatment, 2018 - 2030 (USD Million)
- Table 30 Brazil menopause market, by treatment, 2018 - 2030 (USD Million)
- Table 31 Argentina menopause market, by treatment, 2018 - 2030 (USD Million)
- Table 32 Middle East & Africa menopause market, by country, 2018 - 2030 (USD Million)
- Table 33 Middle East & Africa menopause market, by treatment, 2018 - 2030 (USD Million)
- Table 34 South Africa menopause market, by treatment, 2018 - 2030 (USD Million)
- Table 35 Saudi Arabia menopause market, by treatment, 2018 - 2030 (USD Million)
- Table 36 UAE menopause market, by treatment, 2018 - 2030 (USD Million)
- Table 37 Kuwait menopause market, by treatment, 2018 - 2030 (USD Million)
- Table 38 List of products containing. Rheum Raponticum (Siberian Rhubarb Root), Soy isoflavones, Black Cohosh, Red Clover and Amberen
- Table 39 Regulatory scenario for new product approval in Mexico
- Table 40 Regulations for health food filing and registration in China
- Table 41 New health food filing system in China
- Table 42 Regulatory scenario for new product approval in Brazil
List of Figures
- Fig. 1 Menopause market segmentation
- Fig. 2 Market research process
- Fig. 3 Information procurement
- Fig. 4 Primary research pattern
- Fig. 5 Market research approaches
- Fig. 6 Value-chain-based sizing & forecasting
- Fig. 7 Market formulation & validation
- Fig. 8 Commodity flow analysis
- Fig. 9 Menopause market snapshot
- Fig. 10 Menopause market segment snapshot
- Fig. 11 Competitive landscape snapshot
- Fig. 12 Menopause market: Parent market outlook
- Fig. 13 Menopause market: Ancillary market outlook
- Fig. 14 Menopause market dynamics
- Fig. 15 Market driver relevance analysis (Current & future impact)
- Fig. 16 Market restraint relevance analysis (Current & future impact)
- Fig. 17 Menopause market: Porter's five forces analysis
- Fig. 18 Menopause market: PESTLE analysis
- Fig. 19 Menopause market treatment outlook: Key takeaways
- Fig. 20 Menopause market: Treatment movement analysis, 2024 & 2030
- Fig. 21 Menopause dietary supplements market, 2018 - 2030 (USD Million)
- Fig. 22 Menopause OTC pharma products market, 2018 - 2030 (USD Million)
- Fig. 23 Menopause hormonal products market, 2018 - 2030 (USD Million)
- Fig. 24 Menopause non-hormonal products market, 2018 - 2030 (USD Million)
- Fig. 25 Menopause market revenue, by region
- Fig. 26 Regional key marketplace takeaways
- Fig. 27 Regional key marketplace takeaways
- Fig. 28 North America dietary supplements market estimates and forecast, 2018 - 2030 (USD Million)
- Fig. 29 North America OTC pharma products market estimates and forecast, 2018 - 2030 (USD Million)
- Fig. 30 U.S. menopausal women target population (45 to 60 years), 2018 - 2023 in millions
- Fig. 31 U.S. dietary supplements market estimates and forecast, 2018 - 2030 (USD Million)
- Fig. 32 U.S. OTC pharma products market estimates and forecast, 2018 - 2030 (USD Million)
- Fig. 33 Canada menopausal women target population (45 to 60 years), 2018 - 2023 in millions
- Fig. 34 Canada dietary supplements market estimates and forecast, 2018 - 2030 (USD Million)
- Fig. 35 Canada OTC pharma products market estimates and forecast, 2018 - 2030 (USD Million)
- Fig. 36 Mexico menopausal women target population (45 to 60 years), 2018 - 2023 in millions
- Fig. 37 Mexico dietary supplements market estimates and forecast, 2018 - 2030 (USD Million)
- Fig. 38 Mexico OTC pharma products market estimates and forecast, 2018 - 2030 (USD Million)
- Fig. 39 Europe dietary supplements market estimates and forecast, 2018 - 2030 (USD Million)
- Fig. 40 Europe OTC pharma products market estimates and forecast, 2018 - 2030 (USD Million)
- Fig. 41 UK menopausal women target population (45 to 60 years), 2018 - 2023 in millions
- Fig. 42 UK dietary supplements market estimates and forecast, 2018 - 2030 (USD Million)
- Fig. 43 UK OTC pharma products market estimates and forecast, 2018 - 2030 (USD Million)
- Fig. 44 Germany menopausal women target population (45 to 60 years), 2018 - 2023 in millions
- Fig. 45 Germany dietary supplements market estimates and forecast, 2018 - 2030 (USD Million)
- Fig. 46 Germany OTC pharma products market estimates and forecast, 2018 - 2030 (USD Million)
- Fig. 47 France menopausal women target population (45 to 60 years), 2018 - 2023 in millions
- Fig. 48 France dietary supplements market estimates and forecast, 2018 - 2030 (USD Million)
- Fig. 49 France OTC pharma products market estimates and forecast, 2018 - 2030 (USD Million)
- Fig. 50 Italy menopausal women target population (45 to 60 years), 2018 - 2023 in millions
- Fig. 51 Italy dietary supplements market estimates and forecast, 2018 - 2030 (USD Million)
- Fig. 52 Italy OTC pharma products market estimates and forecast, 2018 - 2030 (USD Million)
- Fig. 53 Spain menopausal women target population (45 to 60 years), 2018 - 2023 in millions
- Fig. 54 Spain dietary supplements market estimates and forecast, 2018 - 2030 (USD Million)
- Fig. 55 Spain OTC pharma products market estimates and forecast, 2018 - 2030 (USD Million)
- Fig. 56 Austria menopausal women target population (45 to 60 years), 2018 - 2023 in millions
- Fig. 57 Austria dietary supplements market estimates and forecast, 2018 - 2030 (USD Million)
- Fig. 58 Austria OTC pharma products market estimates and forecast, 2018 - 2030 (USD Million)
- Fig. 59 Denmark menopausal women target population (45 to 60 years), 2018 - 2023 in Million
- Fig. 60 Denmark dietary supplements market estimates and forecast, 2018 - 2030 (USD Million)
- Fig. 61 Denmark OTC pharma products market estimates and forecast, 2018 - 2030 (USD Million)
- Fig. 62 Sweden menopausal women target population (45 to 60 years), 2018 - 2023 in Million
- Fig. 63 Sweden dietary supplements market estimates and forecast, 2018 - 2030 (USD Million)
- Fig. 64 Sweden OTC pharma products market estimates and forecast, 2018 - 2030 (USD Million)
- Fig. 65 Norway menopausal women target population (45 to 60 years), 2018 - 2023 in Million
- Fig. 66 Norway dietary supplements market estimates and forecast, 2018 - 2030 (USD Million)
- Fig. 67 Norway OTC pharma products market estimates and forecast, 2018 - 2030 (USD Million)
- Fig. 68 Asia Pacific dietary supplements market estimates and forecast, 2018 - 2030 (USD Million)
- Fig. 69 Asia Pacific OTC pharma products market estimates and forecast, 2018 - 2030 (USD Million)
- Fig. 70 Japan menopausal women target population (45 to 60 years), 2018 - 2023 in millions
- Fig. 71 Japan dietary supplements market estimates and forecast, 2018 - 2030 (USD Million)
- Fig. 72 Japan OTC pharma products market estimates and forecast, 2018 - 2030 (USD Million)
- Fig. 73 China menopausal women target population (45 to 60 years), 2018 - 2023 in millions
- Fig. 74 China dietary supplements market estimates and forecast, 2018 - 2030 (USD Million)
- Fig. 75 China OTC pharma products market estimates and forecast, 2018 - 2030 (USD Million)
- Fig. 76 India menopausal women target population (45 to 60 years), 2018 - 2023 in millions
- Fig. 77 India dietary supplements market estimates and forecast, 2018 - 2030 (USD Million)
- Fig. 78 India OTC pharma products market estimates and forecast, 2018 - 2030 (USD Million)
- Fig. 79 South Korea menopausal women target population (45 to 60 years), 2018 - 2023 in millions
- Fig. 80 South Korea dietary supplements market estimates and forecast, 2018 - 2030 (USD Million)
- Fig. 81 South Korea OTC pharma products market estimates and forecast, 2018 - 2030 (USD Million)
- Fig. 82 Australia menopausal women target population (45 to 60 years), 2018 - 2023 in Million
- Fig. 83 Australia dietary supplements market estimates and forecast, 2018 - 2030 (USD Million)
- Fig. 84 Australia OTC pharma products market estimates and forecast, 2018 - 2030 (USD Million)
- Fig. 85 Thailand menopausal women target population (45 to 60 years), 2018 - 2023 in Million
- Fig. 86 Thailand dietary supplements market estimates and forecast, 2018 - 2030 (USD Million)
- Fig. 87 Thailand OTC pharma products market estimates and forecast, 2018 - 2030 (USD Million)
- Fig. 88 Taiwan menopausal women target population (45 to 60 years), 2018 - 2023 in millions
- Fig. 89 Taiwan dietary supplements market estimates and forecast, 2018 - 2030 (USD Million)
- Fig. 90 Taiwan OTC pharma products market estimates and forecast, 2018 - 2030 (USD Million)
- Fig. 91 Malaysia menopausal women target population (45 to 60 years), 2018 - 2023 in millions
- Fig. 92 Malaysia dietary supplements market estimates and forecast, 2018 - 2030 (USD Million)
- Fig. 93 Malaysia OTC pharma products market estimates and forecast, 2018 - 2030 (USD Million)
- Fig. 94 Singapore menopausal women target population (45 to 60 years), 2018 - 2023 in millions
- Fig. 95 Singapore dietary supplements market estimates and forecast, 2018 - 2030 (USD Million)
- Fig. 96 Singapore OTC pharma products market estimates and forecast, 2018 - 2030 (USD Million)
- Fig. 97 Vietnam menopausal women target population (45 to 60 years), 2018 - 2023 in millions
- Fig. 98 Vietnam dietary supplements market estimates and forecast, 2018 - 2030 (USD Million)
- Fig. 99 Vietnam OTC pharma products market estimates and forecast, 2018 - 2030 (USD Million)
- Fig. 100 Hong Kong menopausal women target population (45 to 60 years), 2018 - 2023 in millions
- Fig. 101 Hong Kong dietary supplements market estimates and forecast, 2018 - 2030 (USD Million)
- Fig. 102 Hong Kong OTC pharma products market estimates and forecast, 2018 - 2030 (USD Million)
- Fig. 103 Latin dietary supplements market estimates and forecast, 2018 - 2030 (USD Million)
- Fig. 104 Latin America OTC pharma products market estimates and forecast, 2018 - 2030 (USD Million)
- Fig. 105 Brazil menopausal women target population (45 to 60 years), 2018 - 2023 in millions
- Fig. 106 Brazil dietary supplements market estimates and forecast, 2018 - 2030 (USD Million)
- Fig. 107 Brazil OTC pharma products market estimates and forecast, 2018 - 2030 (USD Million)
- Fig. 108 Argentina menopausal women target population (45 to 60 years), 2018 - 2023 in millions
- Fig. 109 Argentina dietary supplements market estimates and forecast, 2018 - 2030 (USD Million)
- Fig. 110 Argentina OTC pharma products market estimates and forecast, 2018 - 2030 (USD Million)
- Fig. 111 MEA dietary supplements market estimates and forecast, 2018 - 2030 (USD Million)
- Fig. 112 MEA OTC pharma products market estimates and forecast, 2018 - 2030 (USD Million)
- Fig. 113 South Africa menopausal women target population (45 to 60 years), 2018 - 2023 in millions
- Fig. 114 South Africa dietary supplements market estimates and forecast, 2018 - 2030 (USD Million)
- Fig. 115 South Africa OTC pharma products market estimates and forecast, 2018 - 2030 (USD Million)
- Fig. 116 Saudi Arabia menopausal women target population (45 to 60 years), 2018 - 2023 in Million
- Fig. 117 Saudi Arabia dietary supplements market estimates and forecast, 2018 - 2030 (USD Million)
- Fig. 118 Saudi Arabia OTC pharma products market estimates and forecast, 2018 - 2030 (USD Million)
- Fig. 119 UAE menopausal women target population (45 to 60 years), 2018 - 2023 in Million
- Fig. 120 UAE dietary supplements market estimates and forecast, 2018 - 2030 (USD Million)
- Fig. 121 UAE OTC pharma products market estimates and forecast, 2018 - 2030 (USD Million)
- Fig. 122 Kuwait menopausal women target population (45 to 60 years), 2018 - 2023 in millions
- Fig. 123 Kuwait dietary supplements market estimates and forecast, 2018 - 2030 (USD Million)
- Fig. 124 Kuwait OTC pharma products market estimates and forecast, 2018 - 2030 (USD Million)
- Fig. 125 Company categorization
- Fig. 126 Company market position analysis
- Fig. 127 Strategy mapping
Menopause Market Growth & Trends:
The global menopause market size is expected to reach USD 24.35 billion by 2030, registering a CAGR of 5.42% from 2025 to 2030, according to a new report by Grand View Research, Inc. The market growth is expected to be driven by factors such as rising prevalence of post-menopausal syndrome, increasing awareness regarding menopause-associated health aspects, and high adoption of women's health apps.
The market is projected to be driven by rising research supporting the benefits of dietary supplements over HRT. Many dietary supplements are available in the market that contain ingredients such as black cohosh, red clover, soy isoflavones, and amberen. Manufacturers are also involved in developing new products to address menopausal symptoms. For instance, Morphus launched several supplement products in 2023 to address some of the most pressing symptoms of menopause and perimenopause. The first product launched was FiberUs, an unflavored soluble prebiotic fiber made from guar fiber.
The demand for dietary supplements and OTC pharma products increased in the post-pandemic scenario due to the delays in physician's appointments, rescheduling of hormonal replacement therapies, and the easy availability of OTC drugs from retail pharmacies and online channels. However, the market is now stabilizing due to the ease of restrictions and the increasing awareness of menopause.
The surge in FDA approvals for drugs aimed at treating hot flashes and night sweats is a significant factor propelling the growth of the market. In May 2023, the FDA gave their approval for a new non-hormonal medication to address night sweats and hot flashes that are often experienced by individuals during menopause. This prescription drug, called fezolinetant, is specifically designed for those who are unable to take hormonal therapy and who are struggling with vasomotor symptoms, such as breast cancer survivors. The medication is branded under the name Veozah.
Menopause Market Report Highlights:
- Based on treatment, the dietary supplements treatment segment dominated the market in 2024 and is expected to witness the fastest growth during the forecast period. The growth of the segment can be attributed to several factors, including the increasing geriatric population and the launch of innovative products. For instance, in April 2021, Pulmuone, a South Korea-based dietary supplement firm, introduced a product that contains soybean and hop extracts for the treatment of menopause-related symptoms
- The OTC pharmaceutical products treatment segment is categorized into non-hormonal and hormonal products. Women undergoing menopause are increasingly using over-the-counter (OTC) hormone products. Major products in this segment include topical progesterone, ibuprofen, Dehydroepiandrosterone (DHEA), and melatonin
- North America held the largest revenue share in 2024. There is a growing awareness about dietary requirements, which is leading to a greater demand among older women for specific nutritional needs
- In January 2022, Amyris, Inc. announced that it has entered into exclusive agreements to acquire the assets of a women-founded company MenoLabs, LLC. that focuses on treating menopause symptoms, conducting research of women's health and increasing society's understanding of menopause
- In January 2023, O Positiv, a women's health brand, launched the first-ever menopause gummy vitamin, providing menopausal women with a convenient and tasty way to manage their symptoms
Table of Contents
Chapter 1. Methodology and Scope
- 1.1. Market Segmentation & Scope
- 1.1.1. Segment scope
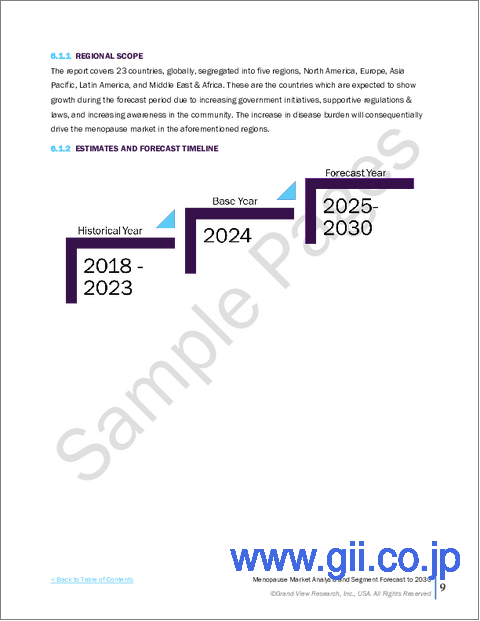
- 1.1.2. Regional scope
- 1.1.3. Estimates and forecast timeline
- 1.2. Research Methodology
- 1.3. Information Procurement
- 1.3.1. Purchased database
- 1.3.2. GVR's internal database
- 1.3.3. Secondary sources
- 1.3.4. Primary research
- 1.3.5. Details of primary research
- 1.4. Information or Data Analysis
- 1.4.1. Data analysis models
- 1.5. Market Formulation & Validation
- 1.6. Model Details
- 1.6.1. Commodity flow analysis (Model 1)
- 1.6.1.1. Approach 1: Commodity flow approach
- 1.6.1. Commodity flow analysis (Model 1)
- 1.7. Research Assumptions
- 1.8. List of Secondary Sources
- 1.9. List of Primary Sources
Chapter 2. Executive Summary
- 2.1. Market Outlook
- 2.2. Segment Outlook
- 2.3. Competitive Insights
Chapter 3. Menopause Market Variables, Trends & Scope
- 3.1. Market Lineage Outlook
- 3.1.1. Parent market outlook
- 3.2. Market Dynamics
- 3.2.1. Market driver analysis
- 3.2.1.1. A growing number of women experiencing menopause
- 3.2.1.2. Increasing awareness regarding the treatment of menopausal symptoms
- 3.2.1.3. Innovation in products available for the management of Menopause
- 3.2.1.4. Increasing research supporting the advantages of dietary supplements
- 3.2.2. Market restraint analysis
- 3.2.2.1. Social stigma associated with menopause and adverse effects of products
- 3.2.2.2. Lack of well-defined regulations
- 3.2.1. Market driver analysis
- 3.3. Qualitative Analysis Impact of COVID-19 on Menopause Market
- 3.4. List of Products
- 3.5. Business Environment Analysis
- 3.5.1. Industry Analysis - Porter's Five Forces Analysis
- 3.5.1.1. Supplier power
- 3.5.1.2. Buyer power
- 3.5.1.3. Substitution threat
- 3.5.1.4. Threat of new entrants
- 3.5.1.5. Competitive rivalry
- 3.5.2. PESTEL Analysis
- 3.5.1. Industry Analysis - Porter's Five Forces Analysis
Chapter 4. Menopause Market Segment Analysis, By Treatment, 2018 - 2030 (USD Million)
- 4.1. Menopause Market: Treatment Movement Analysis and Market Share
- 4.2. Menopause Market: Treatment Segment Dashboard
- 4.3. Dietary Supplements
- 4.3.1. Dietary supplements market, 2018 - 2030 (USD Million)
- 4.4. OTC Pharma Products
- 4.4.1. OTC pharma products market, 2018 - 2030 (USD Million)
- 4.4.2. Hormonal Products
- 4.4.2.1. Hormonal products market, 2018 - 2030 (USD Million)
- 4.4.3. Non-hormonal products
- 4.4.3.1. Non-hormonal products market, 2018 - 2030 (USD Million)
Chapter 5. Region, By Treatment, 2018 - 2030 (USD Million)
- 5.1. Regional Market Dashboard
- 5.2. Regional marketplace: Key takeaways
- 5.3. North America
- 5.3.1. North America dietary supplements market
- 5.3.1.1. North America dietary supplements market estimates and forecast, 2018 - 2030 (USD million)
- 5.3.2. North America OTC pharma products market
- 5.3.2.1. North America OTC pharma products market estimates and forecast, 2018 - 2030 (USD million)
- 5.3.3. U.S.
- 5.3.3.1. U.S. menopausal women target population (45 to 60 years), 2018 - 2023 in millions
- 5.3.3.2. U.S. dietary supplements market
- 5.3.3.2.1. Regulatory scenario
- 5.3.3.2.2. Competitive insights
- 5.3.3.2.3. U.S. dietary supplements market, 2018 - 2030 (USD Million)
- 5.3.3.3. U.S. OTC pharma products market
- 5.3.3.3.1. Regulatory scenario
- 5.3.3.3.2. Competitive insights
- 5.3.3.3.3. U.S. OTC pharma products market, 2018 - 2030 (USD Million)
- 5.3.4. Canada
- 5.3.4.1. Canada menopausal women target population (45 to 60 years), 2018 - 2023 in millions
- 5.3.4.2. Canada dietary supplements market
- 5.3.4.2.1. Regulatory scenario
- 5.3.4.2.2. Competitive insights
- 5.3.4.2.3. Canada dietary supplements market, 2018 - 2030 (USD Million)
- 5.3.4.3. Canada OTC pharma products market
- 5.3.4.3.1. Regulatory scenario
- 5.3.4.3.2. Competitive insights
- 5.3.4.3.3. Canada OTC pharma products market, 2018 - 2030 (USD Million)
- 5.3.5. Mexico
- 5.3.5.1. Mexico menopausal women target population (45 to 60 years), 2018 - 2023 in millions
- 5.3.5.2. Mexico dietary supplements market
- 5.3.5.2.1. Regulatory scenario
- 5.3.5.2.2. Competitive insights
- 5.3.5.2.3. Mexico dietary supplements market, 2018 - 2030 (USD Million)
- 5.3.5.3. Mexico OTC pharma products market
- 5.3.5.3.1. Regulatory scenario
- 5.3.5.3.2. Competitive insights
- 5.3.5.3.3. Mexico OTC pharma products market, 2018 - 2030 (USD Million)
- 5.3.1. North America dietary supplements market
- 5.4. Europe
- 5.4.1. Europe dietary supplements market
- 5.4.1.1. Europe dietary supplements market estimates and forecast, 2018 - 2030 (USD million)
- 5.4.2. Europe OTC pharma products market
- 5.4.2.1. Europe OTC pharma products market estimates and forecast, 2018 - 2030 (USD million)
- 5.4.3. UK
- 5.4.3.1. Canada menopausal women target population (45 to 60 years), 2018 - 2023 in millions
- 5.4.3.2. Canada dietary supplements market
- 5.4.3.2.1. Regulatory scenario
- 5.4.3.2.2. Competitive insights
- 5.4.3.2.3. Canada dietary supplements market, 2018 - 2030 (USD Million)
- 5.4.3.3. Canada OTC pharma products market
- 5.4.3.3.1. Regulatory scenario
- 5.4.3.3.2. Competitive insights
- 5.4.3.3.3. Canada OTC pharma products market, 2018 - 2030 (USD Million)
- 5.4.4. Germany
- 5.4.4.1. Germany menopausal women target population (45 to 60 years), 2018 - 2023 in millions
- 5.4.4.2. Germany dietary supplements market
- 5.4.4.2.1. Regulatory scenario
- 5.4.4.2.2. Competitive insights
- 5.4.4.2.3. Germany dietary supplements market, 2018 - 2030 (USD Million)
- 5.4.4.3. Germany OTC pharma products market
- 5.4.4.3.1. Regulatory scenario
- 5.4.4.3.2. Competitive insights
- 5.4.4.3.3. Germany OTC pharma products market, 2018 - 2030 (USD Million)
- 5.4.5. France
- 5.4.5.1. France menopausal women target population (45 to 60 years), 2018 - 2023 in millions
- 5.4.5.2. France dietary supplements market
- 5.4.5.2.1. Regulatory scenario
- 5.4.5.2.2. Competitive insights
- 5.4.5.2.3. France dietary supplements market, 2018 - 2030 (USD Million)
- 5.4.5.3. France OTC pharma products market
- 5.4.5.3.1. Regulatory scenario
- 5.4.5.3.2. Competitive insights
- 5.4.5.3.3. France OTC pharma products market, 2018 - 2030 (USD Million)
- 5.4.6. Italy
- 5.4.6.1. Italy menopausal women target population (45 to 60 years), 2018 - 2023 in millions
- 5.4.6.2. Italy dietary supplements market
- 5.4.6.2.1. Regulatory scenario
- 5.4.6.2.2. Competitive insights
- 5.4.6.2.3. Italy dietary supplements market, 2018 - 2030 (USD Million)
- 5.4.6.3. Italy OTC pharma products market
- 5.4.6.3.1. Regulatory scenario
- 5.4.6.3.2. Competitive insights
- 5.4.6.3.3. Italy OTC pharma products market, 2018 - 2030 (USD Million)
- 5.4.7. Spain
- 5.4.7.1. Spain menopausal women target population (45 to 60 years), 2018 - 2023 in millions
- 5.4.7.2. Spain dietary supplements market
- 5.4.7.2.1. Regulatory scenario
- 5.4.7.2.2. Competitive insights
- 5.4.7.2.3. Spain dietary supplements market, 2018 - 2030 (USD Million)
- 5.4.7.3. Spain OTC pharma products market
- 5.4.7.3.1. Regulatory scenario
- 5.4.7.3.2. Competitive insights
- 5.4.7.3.3. Spain OTC pharma products market, 2018 - 2030 (USD Million)
- 5.4.8. Austria
- 5.4.8.1. Austria menopausal women target population (45 to 60 years), 2018 - 2023 in millions
- 5.4.8.2. Austria dietary supplements market
- 5.4.8.2.1. Regulatory scenario
- 5.4.8.2.2. Competitive insights
- 5.4.8.2.3. Austria dietary supplements market, 2018 - 2030 (USD Million)
- 5.4.8.3. Austria OTC pharma products market
- 5.4.8.3.1. Regulatory scenario
- 5.4.8.3.2. Competitive insights
- 5.4.8.3.3. Austria OTC pharma products market, 2018 - 2030 (USD Million)
- 5.4.9. Norway
- 5.4.9.1. Norway menopausal women target population (45 to 60 years), 2018 - 2023 in millions
- 5.4.9.2. Norway dietary supplements market
- 5.4.9.2.1. Regulatory scenario
- 5.4.9.2.2. Competitive insights
- 5.4.9.2.3. Norway dietary supplements market, 2018 - 2030 (USD Million)
- 5.4.9.3. Norway OTC pharma products market
- 5.4.9.3.1. Regulatory scenario
- 5.4.9.3.2. Competitive insights
- 5.4.9.3.3. Norway OTC pharma products market, 2018 - 2030 (USD Million)
- 5.4.10. Sweden
- 5.4.10.1. Sweden menopausal women target population (45 to 60 years), 2018 - 2023 in millions
- 5.4.10.2. Sweden dietary supplements market
- 5.4.10.2.1. Regulatory scenario
- 5.4.10.2.2. Competitive insights
- 5.4.10.2.3. Sweden dietary supplements market, 2018 - 2030 (USD Million)
- 5.4.10.3. Sweden OTC pharma products market
- 5.4.10.3.1. Regulatory scenario
- 5.4.10.3.2. Competitive insights
- 5.4.10.3.3. Sweden OTC pharma products market, 2018 - 2030 (USD Million)
- 5.4.11. Denmark
- 5.4.11.1. Denmark menopausal women target population (45 to 60 years), 2018 - 2023 in millions
- 5.4.11.2. Denmark dietary supplements market
- 5.4.11.2.1. Regulatory scenario
- 5.4.11.2.2. Competitive insights
- 5.4.11.2.3. Denmark dietary supplements market, 2018 - 2030 (USD Million)
- 5.4.11.3. Denmark OTC pharma products market
- 5.4.11.3.1. Regulatory scenario
- 5.4.11.3.2. Competitive insights
- 5.4.11.3.3. Denmark OTC pharma products market, 2018 - 2030 (USD Million)
- 5.4.1. Europe dietary supplements market
- 5.5. Asia Pacific
- 5.5.1. Asia Pacific dietary supplements market
- 5.5.1.1. Asia Pacific dietary supplements market estimates and forecast, 2018 - 2030 (USD million)
- 5.5.2. Asia Pacific OTC pharma products market
- 5.5.2.1. Asia Pacific OTC pharma products market estimates and forecast, 2018 - 2030 (USD million)
- 5.5.3. Japan
- 5.5.3.1. Japan menopausal women target population (45 to 60 years), 2018 - 2023 in millions
- 5.5.3.2. Japan dietary supplements market
- 5.5.3.2.1. Regulatory scenario
- 5.5.3.2.2. Competitive insights
- 5.5.3.2.3. Japan dietary supplements market, 2018 - 2030 (USD Million)
- 5.5.3.3. Japan OTC pharma products market
- 5.5.3.3.1. Regulatory scenario
- 5.5.3.3.2. Competitive insights
- 5.5.3.3.3. Japan OTC pharma products market, 2018 - 2030 (USD Million)
- 5.5.4. China
- 5.5.4.1. China menopausal women target population (45 to 60 years), 2018 - 2023 in millions
- 5.5.4.2. China dietary supplements market
- 5.5.4.2.1. Regulatory scenario
- 5.5.4.2.2. Competitive insights
- 5.5.4.2.3. China dietary supplements market, 2018 - 2030 (USD Million)
- 5.5.4.3. China OTC pharma products market
- 5.5.4.3.1. Regulatory scenario
- 5.5.4.3.2. Competitive insights
- 5.5.4.3.3. China OTC pharma products market, 2018 - 2030 (USD Million)
- 5.5.5. India
- 5.5.5.1. India menopausal women target population (45 to 60 years), 2018 - 2023 in millions
- 5.5.5.2. India dietary supplements market
- 5.5.5.2.1. Regulatory scenario
- 5.5.5.2.2. Competitive insights
- 5.5.5.2.3. India dietary supplements market, 2018 - 2030 (USD Million)
- 5.5.5.3. India OTC pharma products market
- 5.5.5.3.1. Regulatory scenario
- 5.5.5.3.2. Competitive insights
- 5.5.5.3.3. India OTC pharma products market, 2018 - 2030 (USD Million)
- 5.5.6. Australia
- 5.5.6.1. Australia menopausal women target population (45 to 60 years), 2018 - 2023 in millions
- 5.5.6.2. Australia dietary supplements market
- 5.5.6.2.1. Regulatory scenario
- 5.5.6.2.2. Competitive insights
- 5.5.6.2.3. Australia dietary supplements market, 2018 - 2030 (USD Million)
- 5.5.6.3. Australia OTC pharma products market
- 5.5.6.3.1. Regulatory scenario
- 5.5.6.3.2. Competitive insights
- 5.5.6.3.3. Australia OTC pharma products market, 2018 - 2030 (USD Million)
- 5.5.7. South Korea
- 5.5.7.1. South Korea menopausal women target population (45 to 60 years), 2018 - 2023 in millions
- 5.5.7.2. South Korea dietary supplements market
- 5.5.7.2.1. Regulatory scenario
- 5.5.7.2.2. Competitive insights
- 5.5.7.2.3. South Korea dietary supplements market, 2018 - 2030 (USD Million)
- 5.5.7.3. South Korea OTC pharma products market
- 5.5.7.3.1. Regulatory scenario
- 5.5.7.3.2. Competitive insights
- 5.5.7.3.3. South Korea OTC pharma products market, 2018 - 2030 (USD Million)
- 5.5.8. Thailand
- 5.5.8.1. Thailand menopausal women target population (45 to 60 years), 2018 - 2023 in millions
- 5.5.8.2. Thailand dietary supplements market
- 5.5.8.2.1. Regulatory scenario
- 5.5.8.2.2. Competitive insights
- 5.5.8.2.3. Thailand dietary supplements market, 2018 - 2030 (USD Million)
- 5.5.8.3. Thailand OTC pharma products market
- 5.5.8.3.1. Regulatory scenario
- 5.5.8.3.2. Competitive insights
- 5.5.8.3.3. Thailand OTC pharma products market, 2018 - 2030 (USD Million)
- 5.5.9. Taiwan
- 5.5.9.1. Taiwan menopausal women target population (45 to 60 years), 2018 - 2023 in millions
- 5.5.9.2. Taiwan dietary supplements market
- 5.5.9.2.1. Regulatory scenario
- 5.5.9.2.2. Competitive insights
- 5.5.9.2.3. Taiwan dietary supplements market, 2018 - 2030 (USD Million)
- 5.5.9.3. Taiwan OTC pharma products market
- 5.5.9.3.1. Regulatory scenario
- 5.5.9.3.2. Competitive insights
- 5.5.9.3.3. Taiwan OTC pharma products market, 2018 - 2030 (USD Million)
- 5.5.10. Malaysia
- 5.5.10.1. Malaysia menopausal women target population (45 to 60 years), 2018 - 2023 in millions
- 5.5.10.2. Malaysia dietary supplements market
- 5.5.10.2.1. Regulatory scenario
- 5.5.10.2.2. Competitive insights
- 5.5.10.2.3. Malaysia dietary supplements market, 2018 - 2030 (USD Million)
- 5.5.10.3. Malaysia OTC pharma products market
- 5.5.10.3.1. Regulatory scenario
- 5.5.10.3.2. Competitive insights
- 5.5.10.3.3. Malaysia OTC pharma products market, 2018 - 2030 (USD Million)
- 5.5.11. Singapore
- 5.5.11.1. Singapore menopausal women target population (45 to 60 years), 2018 - 2023 in millions
- 5.5.11.2. Singapore dietary supplements market
- 5.5.11.2.1. Regulatory scenario
- 5.5.11.2.2. Competitive insights
- 5.5.11.2.3. Singapore dietary supplements market, 2018 - 2030 (USD Million)
- 5.5.11.3. Singapore OTC pharma products market
- 5.5.11.3.1. Regulatory scenario
- 5.5.11.3.2. Competitive insights
- 5.5.11.3.3. Singapore OTC pharma products market, 2018 - 2030 (USD Million)
- 5.5.12. Vietnam
- 5.5.12.1. Vietnam menopausal women target population (45 to 60 years), 2018 - 2023 in millions
- 5.5.12.2. Vietnam dietary supplements market
- 5.5.12.2.1. Regulatory scenario
- 5.5.12.2.2. Competitive insights
- 5.5.12.2.3. Vietnam dietary supplements market, 2018 - 2030 (USD Million)
- 5.5.12.3. Vietnam OTC pharma products market
- 5.5.12.3.1. Regulatory scenario
- 5.5.12.3.2. Competitive insights
- 5.5.12.3.3. Vietnam OTC pharma products market, 2018 - 2030 (USD Million)
- 5.5.13. Hong Kong
- 5.5.13.1. Hong Kong menopausal women target population (45 to 60 years), 2018 - 2023 in millions
- 5.5.13.2. Hong Kong dietary supplements market
- 5.5.13.2.1. Regulatory scenario
- 5.5.13.2.2. Competitive insights
- 5.5.13.2.3. Hong Kong dietary supplements market, 2018 - 2030 (USD Million)
- 5.5.13.3. Hong Kong OTC pharma products market
- 5.5.13.3.1. Regulatory scenario
- 5.5.13.3.2. Competitive insights
- 5.5.13.3.3. Hong Kong OTC pharma products market, 2018 - 2030 (USD Million)
- 5.5.1. Asia Pacific dietary supplements market
- 5.6. Latin America
- 5.6.1. Latin America dietary supplements market
- 5.6.1.1. Latin America dietary supplements market estimates and forecast, 2018 - 2030 (USD million)
- 5.6.2. Latin America OTC pharma products market
- 5.6.2.1. Latin America OTC pharma products market estimates and forecast, 2018 - 2030 (USD million)
- 5.6.3. Brazil
- 5.6.3.1. Brazil menopausal women target population (45 to 60 years), 2018 - 2023 in millions
- 5.6.3.2. Brazil dietary supplements market
- 5.6.3.2.1. Regulatory scenario
- 5.6.3.2.2. Competitive insights
- 5.6.3.2.3. Brazil dietary supplements market, 2018 - 2030 (USD Million)
- 5.6.3.3. Brazil OTC pharma products market
- 5.6.3.3.1. Regulatory scenario
- 5.6.3.3.2. Competitive insights
- 5.6.3.3.3. Brazil OTC pharma products market, 2018 - 2030 (USD Million)
- 5.6.4. Argentina
- 5.6.4.1. Argentina menopausal women target population (45 to 60 years), 2018 - 2023 in millions
- 5.6.4.2. Argentina dietary supplements market
- 5.6.4.2.1. Regulatory scenario
- 5.6.4.2.2. Competitive insights
- 5.6.4.2.3. Argentina dietary supplements market, 2018 - 2030 (USD Million)
- 5.6.4.3. Argentina OTC pharma products market
- 5.6.4.3.1. Regulatory scenario
- 5.6.4.3.2. Competitive insights
- 5.6.4.3.3. Argentina OTC pharma products market, 2018 - 2030 (USD Million)
- 5.6.1. Latin America dietary supplements market
- 5.7. MEA
- 5.7.1. MEA dietary supplements market
- 5.7.1.1. MEA dietary supplements market estimates and forecast, 2018 - 2030 (USD million)
- 5.7.2. MEA OTC pharma products market
- 5.7.2.1. MEA OTC pharma products market estimates and forecast, 2018 - 2030 (USD million)
- 5.7.3. South Africa
- 5.7.3.1. South Africa menopausal women target population (45 to 60 years), 2018 - 2023 in millions
- 5.7.3.2. South Africa dietary supplements market
- 5.7.3.2.1. Regulatory scenario
- 5.7.3.2.2. Competitive insights
- 5.7.3.2.3. South Africa dietary supplements market, 2018 - 2030 (USD Million)
- 5.7.3.3. South Africa OTC pharma products market
- 5.7.3.3.1. Regulatory scenario
- 5.7.3.3.2. Competitive insights
- 5.7.3.3.3. South Africa OTC pharma products market, 2018 - 2030 (USD Million)
- 5.7.4. Saudi Arabia
- 5.7.4.1. Saudi Arabia menopausal women target population (45 to 60 years), 2018 - 2023 in millions
- 5.7.4.2. Saudi Arabia dietary supplements market
- 5.7.4.2.1. Regulatory scenario
- 5.7.4.2.2. Competitive insights
- 5.7.4.2.3. Saudi Arabia dietary supplements market, 2018 - 2030 (USD Million)
- 5.7.4.3. Saudi Arabia OTC pharma products market
- 5.7.4.3.1. Regulatory scenario
- 5.7.4.3.2. Competitive insights
- 5.7.4.3.3. Saudi Arabia OTC pharma products market, 2018 - 2030 (USD Million)
- 5.7.5. UAE
- 5.7.5.1. UAE menopausal women target population (45 to 60 years), 2018 - 2023 in millions
- 5.7.5.2. UAE dietary supplements market
- 5.7.5.2.1. Regulatory scenario
- 5.7.5.2.2. Competitive insights
- 5.7.5.2.3. UAE dietary supplements market, 2018 - 2030 (USD Million)
- 5.7.5.3. UAE OTC pharma products market
- 5.7.5.3.1. Regulatory scenario
- 5.7.5.3.2. Competitive insights
- 5.7.5.3.3. UAE OTC pharma products market, 2018 - 2030 (USD Million)
- 5.7.6. Kuwait
- 5.7.6.1. Kuwait menopausal women target population (45 to 60 years), 2018 - 2023 in millions
- 5.7.6.2. Kuwait dietary supplements market
- 5.7.6.2.1. Regulatory scenario
- 5.7.6.2.2. Competitive insights
- 5.7.6.2.3. Kuwait dietary supplements market, 2018 - 2030 (USD Million)
- 5.7.6.3. Kuwait OTC pharma products market
- 5.7.6.3.1. Regulatory scenario
- 5.7.6.3.2. Competitive insights
- 5.7.6.3.3. Kuwait OTC pharma products market, 2018 - 2030 (USD Million)
- 5.7.1. MEA dietary supplements market
Chapter 6. Competitive Landscape
- 6.1. Recent Developments & Impact Analysis, By Key Market Participants
- 6.2. Company Categorization
- 6.3. Vendor Landscape
- 6.3.1. List of key distributors and channel partners
- 6.3.2. Key customers
- 6.4. Company Profiles
- 6.4.1. Bayer AG
- 6.4.1.1. Company overview
- 6.4.1.2. Financial performance
- 6.4.1.3. Product benchmarking
- 6.4.1.4. Strategic initiatives
- 6.4.2. Theramex
- 6.4.2.1. Company overview
- 6.4.2.2. Financial performance
- 6.4.2.3. Product benchmarking
- 6.4.2.4. Strategic initiatives
- 6.4.3. AbbVie, Inc.
- 6.4.3.1. Company overview
- 6.4.3.2. Financial performance
- 6.4.3.3. Product benchmarking
- 6.4.3.4. Strategic initiatives
- 6.4.4. Pure Encapsulations, LLC
- 6.4.4.1. Company overview
- 6.4.4.2. Financial performance
- 6.4.4.3. Product benchmarking
- 6.4.4.4. Strategic initiatives
- 6.4.5. Dr. Reddy's Laboratories Ltd.
- 6.4.5.1. Company overview
- 6.4.5.2. Financial performance
- 6.4.5.3. Product benchmarking
- 6.4.5.4. Strategic initiatives
- 6.4.6. ReNew Life Holdings Corporation
- 6.4.6.1. Company overview
- 6.4.6.2. Financial performance
- 6.4.6.3. Product benchmarking
- 6.4.6.4. Strategic initiatives
- 6.4.7. Padagis
- 6.4.7.1. Company overview
- 6.4.7.2. Financial performance
- 6.4.7.3. Product benchmarking
- 6.4.7.4. Strategic initiatives
- 6.4.1. Bayer AG

