
パワースポーツの市場機会、成長要因、業界動向分析、および2026年~2035年の予測
Power Sports Market Opportunity, Growth Drivers, Industry Trend Analysis, and Forecast 2026 - 2035- 発行日
- ページ情報
- 英文 275 Pages
- 納期
- 2~3営業日
- 商品コード
- 2019167
- カスタマイズ可能 お客様のご希望に応じて、既存データの加工や未掲載情報(例:国別セグメント)の追加などの対応が可能です。詳細はお問い合わせください。
- 翻訳ツール提供対象 PDF対応AI翻訳ツールの無料貸し出しサービスのご利用が可能です
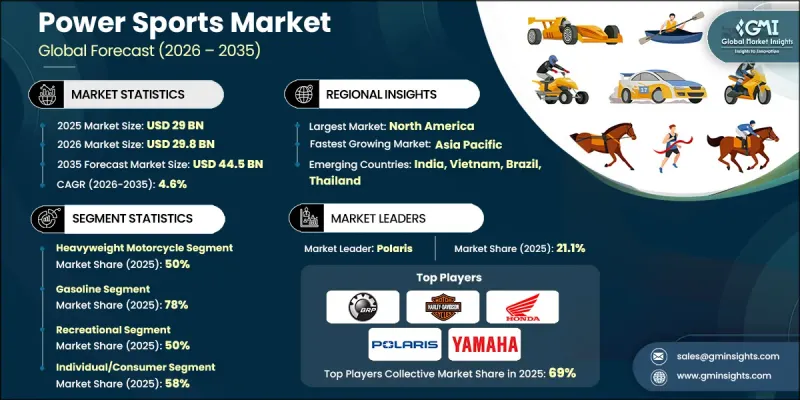
世界のパワースポーツ市場は、2025年に290億米ドルと評価され、CAGR 4.6%で成長し、2035年までに445億米ドルに達すると推定されています。
世界中でアウトドアレクリエーションやアドベンチャー志向のアクティビティが勢いを増し続けていることから、この業界は着実な成長を遂げています。探検型の体験やレジャー用モビリティに対する消費者の関心の高まりが、オフロードや水上でのアクティビティへの参加拡大を後押ししています。この動向は、複数のセグメントにわたるパワースポーツ車両の需要に直接的な影響を与えています。アウトドアライフスタイルへの関与の高まりは、パフォーマンス重視のレクリエーション用機器を求める消費者層の拡大にも寄与しています。さらに、車両の耐久性や性能の向上により、愛好家だけでなく一般ユーザーの間でも製品の魅力が高まっています。また、レクリエーション用モビリティソリューションへの認知度の高まりや、様々な地形や利用ニーズに合わせた多種多様な車両が利用可能になったことも、市場をさらに後押ししています。流通ネットワークの拡大や堅調な買い替え需要も、地域を問わず市場の拡大を持続させる上で重要な役割を果たしています。
| 市場範囲 | |
|---|---|
| 開始年 | 2025年 |
| 予測期間 | 2026年~2035年 |
| 開始時の市場規模 | 290億米ドル |
| 予測金額 | 445億米ドル |
| CAGR | 4.6% |
パワースポーツ産業の拡大は、エンジニアリングおよび車両技術の継続的な進歩に強く影響されています。メーカー各社は、エンジン効率の向上、サスペンションシステムの改良、そして高度な安全機構の統合に注力し、全体的な乗り心地と耐久性の向上を図っています。様々な地形や運転条件において性能を最適化するため、最新の駆動系システムや電子制御機能が開発されています。これらの革新により、パワースポーツ車両の信頼性と機能性が向上し、より幅広い層にとって魅力的なものとなっています。車両制御の高度化、安定性の向上、そしてハンドリング性能の改善は、より洗練されたユーザー体験に貢献しており、これが長期的な市場成長を支え続けています。
大型バイクセグメントは2025年に50%のシェアを占め、2026年から2035年にかけてCAGR4.2%で成長すると予想されています。このセグメントは、長距離のレクリエーション走行や高性能なツーリング体験との強い関連性により、引き続き市場を牽引しています。このカテゴリーのオートバイは、その排気量、安定性、そしてパワフルなライディング体験を提供できる点から広く好まれています。消費者は、レジャー旅行やパフォーマンス重視の用途において、ますますこれらの車両に惹かれています。快適性、操作性、耐久性に焦点を当てた継続的な製品改良が、このセグメント内の需要をさらに強化しています。レジャー目的のライダーと愛好家の双方のニーズに応えることができる点が、市場における同セグメントの主導的な地位を確固たるものにしています。
ガソリン車セグメントは2025年に78%のシェアを占め、2035年までCAGR3.4%で成長すると予測されています。ガソリン車は、高い出力や速い加速といった優れた性能特性により、依然として主流の地位を維持しています。これらの車両は、その信頼性と長距離にわたる効率的な走行能力から、様々なパワースポーツカテゴリーで広く利用されています。消費者は、多様な地形や過酷な環境下でも安定した性能を発揮する点から、ガソリンエンジンを引き続き好んでいます。メーカー各社は、性能基準を維持しつつ燃費効率を高めるため、ガソリンエンジンシステムの改良に注力しており、これによりセグメント全体での需要が持続することが見込まれます。
米国パワースポーツ市場は85%のシェアを占め、2025年には131億米ドルの市場規模に達しました。同国における市場の成長は、アウトドアレクリエーションに対する強い文化と、レクリエーション用車両の利用を支える確立されたエコシステムによって牽引されています。消費者は陸上および水上でのアクティビティに積極的に参加しており、これがパワースポーツ車両に対する安定した需要を生み出し続けています。広範な販売店ネットワークと豊富な製品ラインナップの存在が、市場浸透をさらに強化しています。さらに、メーカーの強力な存在感と継続的な製品革新が、着実な成長の維持に寄与しています。消費者の関心、アクセスのしやすさ、そして製品の多様性が相まって、米国はこの地域における主要市場としての地位を維持し続けています。
よくあるご質問
目次
第1章 調査手法
第2章 エグゼクティブサマリー
第3章 業界考察
- エコシステム分析
- サプライヤーの情勢
- 利益率分析
- コスト構造
- 各段階における付加価値
- バリューチェーンに影響を与える要因
- ディスラプション
- 業界への影響要因
- 促進要因
- アウトドアレクリエーションへの参加者の増加
- アドベンチャー・ツーリズムの拡大
- 製品の革新と車両性能の向上
- レクリエーション用車両の所有台数の増加
- 業界の潜在的リスク&課題
- 高い購入および維持コスト
- 安全性への懸念と事故リスク
- 市場機会
- 電動スポーツ車両の成長
- レクリエーション・ツーリズム・パークの拡大
- コネクテッドカーおよびスマートカーの展開
- 促進要因
- 成長可能性分析
- 規制情勢
- 北米
- 米国のオフロード車両の安全性およびCPSC規制
- 連邦政府の土地利用およびオフロード車両管理に関する政策
- オフロードエンジン向けのEPA排出ガス基準
- カナダのオフロード車両の安全基準および登録要件
- 欧州
- EUにおける二輪車およびオフロード車の型式認定
- UNECEの車両安全および制動に関する規制
- 各国の自動車型式認定および使用制限
- 環境および騒音排出基準
- アジア太平洋地域
- 中国のオフロード車製造および排出ガス規制
- インドの四輪軽自動車および二輪車の型式認定基準
- 日本の自動車安全およびモビリティに関する規制
- オーストラリアのオフロード車安全基準
- ASEANの自動車認証枠組み
- ラテンアメリカ
- ブラジルのオフロード車両に関する安全および環境規制
- アルゼンチンのオフロード車登録規制
- メキシコの自動車製造および安全基準
- 地域別のレクリエーション用車両に関する規制枠組み
- 中東・アフリカ
- UAEのオフロード車ライセンシング規制
- サウジアラビアの自動車安全検査基準
- 南アフリカのオフロード車登録基準
- 北米
- ポーター分析
- PESTEL分析
- 技術とイノベーションの動向
- 現在の技術動向
- 新興技術
- 価格分析(1次調査に基づく)
- 過去の価格動向分析
- プレイヤータイプ別の価格戦略
- 取引データ分析(有料データベースに基づく)
- 輸出入数量・金額の動向
- 主要な貿易ルートと関税の影響
- 生産能力および生産動向(1次調査に基づく)
- 地域別・主要生産者別の導入容量
- 稼働率および拡張計画
- コスト内訳分析
- 特許分析(1次調査に基づく)
- サステナビリティおよび環境面
- 持続可能な取り組み
- 廃棄物削減戦略
- 生産におけるエネルギー効率
- 環境に配慮した取り組み
- カーボンフットプリントに関する考察
- AIおよび生成AIが市場に与える影響
- AIによる既存ビジネスモデルの変革
- セグメント別の生成AIの使用事例と導入ロードマップ
- リスク、制約、および規制上の考慮事項
- 予測の前提条件およびシナリオ分析(1次調査に基づく)
- ベースケース-CAGRを牽引する主要なマクロ経済および業界変数
- 楽観的シナリオ- マクロ経済および業界における追い風
- 悲観シナリオ- マクロ経済の減速または業界の逆風
第4章 競合情勢
- イントロダクション
- 企業の市場シェア分析
- 北米
- 欧州
- アジア太平洋地域
- ラテンアメリカ
- 中東・アフリカ(MEA)
- 主要市場企業の競合分析
- 競合ポジショニングマトリックス
- 主な発展
- 合併・買収
- 提携・協業
- 新製品の発売
- 事業拡大計画と資金調達
第5章 市場推計・予測:車両別、2022-2035
- サイド・バイ・サイド車
- 全地形対応車
- 大型バイク
- 水上バイク
- スノーモービル
第6章 市場推計・予測:推進力別、2022-2035
- ガソリン
- ディーゼル
- 電気
第7章 市場推計・予測:用途別、2022-2035
- レクリエーション
- 公益事業
- 商業用
- スポーツ
- 建設
- 防衛
第8章 市場推計・予測:エンドユーザー別、2022-2035
- 個人/消費者
- 商業用
- 政府・軍事
- レンタル・ツアーオペレーター
- その他
第9章 市場推計・予測:地域別、2022-2035
- 北米
- 米国
- カナダ
- 欧州
- ドイツ
- 英国
- フランス
- イタリア
- スペイン
- ロシア
- ノルウェー
- オランダ
- スウェーデン
- アジア太平洋地域
- 中国
- インド
- 日本
- オーストラリア
- 韓国
- シンガポール
- タイ
- インドネシア
- ベトナム
- ラテンアメリカ
- ブラジル
- メキシコ
- アルゼンチン
- 中東・アフリカ(MEA)
- 南アフリカ
- サウジアラビア
- アラブ首長国連邦
- トルコ
第10章 企業プロファイル
- 世界企業
- BRP
- CFMOTO
- Harley Davidson
- Honda Motor
- Kawasaki
- KYMCO
- Polaris
- Suzuki Motor
- Textron
- Yamaha Motor
- 地域プレイヤー
- Argo
- Hisun Motors
- Linhai
- Massimo Motor
- TGB Taiwan Golden Bee
- Tracker Off Road
- 新興企業・ディスラプター
- DRR USA
- ODES Industries
- Segway Powersports
- Volcon
- 発行日
- 発行
- Global Market Insights Inc.
- ページ情報
- 英文 275 Pages
- 納期
- 2~3営業日


