
|
市場調査レポート
商品コード
1750558
WtE(廃棄物発電)市場機会、成長促進要因、産業動向分析、2025~2034年予測Waste to Energy Market Opportunity, Growth Drivers, Industry Trend Analysis, and Forecast 2025 - 2034 |
||||||
カスタマイズ可能
|
|||||||
| WtE(廃棄物発電)市場機会、成長促進要因、産業動向分析、2025~2034年予測 |
|
出版日: 2025年05月05日
発行: Global Market Insights Inc.
ページ情報: 英文 123 Pages
納期: 2~3営業日
|

全表示
- 概要
- 目次
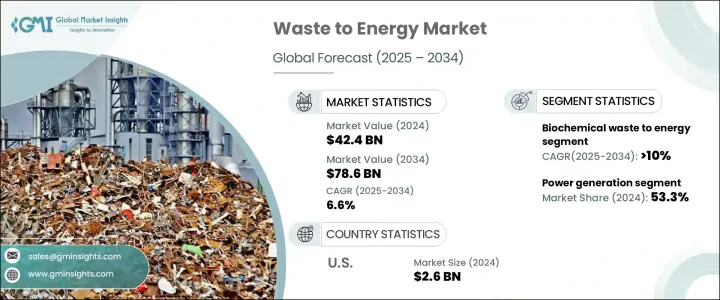
2024年の世界WtE(廃棄物発電)の市場規模は424億米ドルで、2034年にはCAGR 6.6%で成長し786億米ドルに達すると推定されています。
急速な都市化と都市固形廃棄物の増加により、より効率的な廃棄物管理ソリューションの必要性が高まっています。埋立地の容量が限界に達するにつれ、廃棄物発電(WtE)技術の採用が広まりつつあります。また、特に廃棄物量が増え続けている都市部では、分散型の廃棄物治療システムが普及しつつあります。政府も企業も同様に、循環型経済と再生可能エネルギー源を促進する技術に投資しており、市場情勢をさらに強化しています。
埋立地の使用量を削減する規制措置は、特にアジアや欧州などの地域でWtEソリューションの採用を加速させています。各国は、埋立地に送られる廃棄物を削減する国家目標を設定しており、これがエネルギー回収技術の機会を生み出しています。産業活動、特に製造業は廃棄物発生量の増加に寄与しており、WtEシステムの需要をさらに高めています。一方、世界の貿易政策や関税、特に米国で導入された関税は、市場の成長に影響を与える可能性があります。こうした課題にもかかわらず、技術の進歩と排出に関する環境規制の強化は、廃棄物発電セクターを前進させるものと期待されています。
| 市場範囲 | |
|---|---|
| 開始年 | 2024 |
| 予測年 | 2025-2034 |
| 開始金額 | 424億米ドル |
| 予測金額 | 786億米ドル |
| CAGR | 6.6% |
熱廃棄物発電分野は、エネルギー回収とシステム全体の効率を向上させる熱電併給技術を備えた高度な焼却プラントの利用が増加しているため、2034年までに650億米ドルの売上が見込まれています。火力発電所では電気と熱の両方を生成できるため、より持続可能でエネルギー効率が高くなります。これらの施設は、運転を最適化し、ダウンタイムを減らし、性能監視を強化するように設計されています。廃棄物発電ソリューションの需要は、廃棄物の量が多い都市部で高く、信頼性の高いエネルギー源の必要性は高まり続けています。
廃棄物発電市場の発電用途セグメントはかなりの部分を占め、2024年のシェアは53.3%です。電気と熱を供給する効率的な廃棄物燃料コージェネレーション・ユニットに対するニーズと、グリッド・バランシング設備に対する需要の高まりが、このセグメントの成長の主な原動力となっています。都市化が加速し、固形廃棄物の発生量が増加するにつれて、エネルギーニーズと廃棄物管理問題に対処するための廃棄物発電システムへの依存度が高まっています。発電部門は、再生可能エネルギーと循環型経済慣行の重視の高まりから恩恵を受け、廃棄物発電技術への投資をさらに後押ししています。
欧州のWtE(廃棄物発電)野心的なネットゼロ排出目標へのコミットメントと、埋立地利用の削減と持続可能なエネルギーソリューションの奨励を目的とした強固な規制枠組みにより、欧州市場は2034年までにCAGR 8%で成長します。埋立地税の上昇が触媒となり、自治体がより環境に優しい廃棄物管理の選択肢を見つけるよう後押ししています。これにより、廃棄物量を削減するだけでなく再生可能エネルギーを生産する廃棄物発電所の導入が促進され、地域の環境・エネルギー目標に貢献しています。
Hitz日立造船、ヴェオリア、三菱重工業など、世界のWtE(廃棄物発電)市場の主要企業は、市場のリーダーシップを維持するため、技術革新、エネルギー効率の改善、新技術の統合に注力しています。これらの企業は戦略的パートナーシップを結び、廃棄物発電システムを改善するための研究開発に投資しています。例えば、Babcock &WilcoxとSUEZは焼却技術の進歩に注力しており、Enerkemは廃棄物のクリーンエネルギーへの変換効率を高める方法を模索しています。こうした努力は、市場シェアを拡大し競争力を強化する上で極めて重要です。
目次
第1章 調査手法と範囲
第2章 エグゼクティブサマリー
第3章 業界考察
- 業界エコシステム
- トランプ政権の関税分析
- 貿易への影響
- 貿易量の混乱
- 報復措置
- 業界への影響
- 供給側の影響(原材料)
- 主要原材料の価格変動
- サプライチェーンの再構築
- 生産コストへの影響
- 需要側の影響(販売価格)
- 最終市場への価格伝達
- 市場シェアの動向
- 消費者の反応パターン
- 供給側の影響(原材料)
- 影響を受ける主要企業
- 戦略的な業界対応
- サプライチェーンの再構成
- 価格設定と製品戦略
- 政策関与
- 展望と今後の検討事項
- 貿易への影響
- 規制情勢
- 業界への影響要因
- 促進要因
- 業界の潜在的リスク&課題
- 成長可能性分析
- ポーター分析
- PESTEL分析
第4章 競合情勢
- イントロダクション
- 戦略的ダッシュボード
- 戦略的取り組み
- 企業の市場シェア
- 競合ベンチマーキング
- イノベーションと持続可能性の情勢
第5章 市場規模・予測:工程別、2021-2034
- 主要動向
- サーマル
- CHP焼却
- 混焼
- 熱ガス化
- 残留燃料プラント
- 生化学的
第6章 市場規模・予測:用途別、2021-2034
- 主要動向
- 発電
- 加熱
- その他
第7章 市場規模・予測:地域別、2021-2034
- 主要動向
- 北米
- 米国
- カナダ
- 欧州
- スウェーデン
- デンマーク
- ノルウェー
- イタリア
- オランダ
- アジア太平洋地域
- 中国
- インド
- 日本
- 韓国
- インドネシア
- タイ
第8章 企業プロファイル
- Babcock &Wilcox
- Enerkem
- Everbright Environment
- Hitachi Zosen
- JFE Engineering
- Marubeni
- Mitsubishi Heavy Industries
- Reworld
- SUEZ
- Stellar3
- Veolia
- WM Intellectual Property Holdings
The Global Waste to Energy Market was valued at USD 42.4 billion in 2024 and is estimated to grow at a CAGR of 6.6% to reach USD 78.6 billion by 2034, driven by rapid urbanization and the increasing generation of municipal solid waste, both of which are pushing the need for more efficient waste management solutions. As landfill capacities reach their limits, adopting waste-to-energy (WtE) technologies is becoming more widespread. Additionally, decentralized waste treatment systems are gaining traction, especially in urban areas, where waste volumes continue to rise. Governments and businesses alike are investing in technologies that promote a circular economy and renewable energy sources, further strengthening the market landscape.
Regulatory measures that reduce landfill usage are accelerating the adoption of WtE solutions, particularly in regions like Asia and Europe. Countries are setting national targets to reduce waste sent to landfills, which is creating opportunities for energy recovery technologies. Industrial activities, especially in manufacturing, contribute to the rise in waste generation, further fueling the demand for WtE systems. Meanwhile, global trade policies and tariffs, particularly those introduced in the US, may impact the market's growth. Despite these challenges, technological advancements and tighter environmental regulations on emissions are expected to propel the waste-to-energy sector forward.
| Market Scope | |
|---|---|
| Start Year | 2024 |
| Forecast Year | 2025-2034 |
| Start Value | $42.4 Billion |
| Forecast Value | $78.6 Billion |
| CAGR | 6.6% |
The thermal waste-to-energy segment is anticipated to generate USD 65 billion by 2034 due to the increasing use of advanced incineration plants with combined heat and power technologies, which improve energy recovery and overall system efficiency. Thermal plants allow for the generation of both electricity and heat, making them more sustainable and energy-efficient. These facilities are designed to optimize operations, reduce downtime, and enhance performance monitoring. The demand for waste-to-electricity solutions is high in urban areas where waste volumes are large, and the need for reliable energy sources continues to grow.
The power generation application segment of the waste-to-energy market accounted for a substantial portion, contributing a 53.3% share in 2024. The need for efficient waste-fed cogeneration units, which provide electricity and heat, and the growing demand for grid-balancing facilities are key drivers of this segment's growth. As urbanization continues to accelerate and solid waste generation rises, there is an increasing reliance on waste-to-energy systems to address energy needs and waste management issues. The power generation segment benefits from the growing emphasis on renewable energy and circular economy practices, which further incentivize investments in waste-to-energy technologies.
Europe Waste to Energy Market will grow at a CAGR of 8% by 2034 due to the region's commitment to ambitious net-zero emission targets and a robust regulatory framework aimed at reducing landfill usage and encouraging sustainable energy solutions. Rising landfill taxes act as a catalyst, pushing municipalities to find more eco-friendly waste management alternatives. This is promoting the adoption of waste-to-energy plants that not only reduce waste volumes but also produce renewable energy, thus contributing to the region's environmental and energy goals.
Leading companies in the Global Waste to Energy Market, such as Hitachi Zosen, Veolia, and Mitsubishi Heavy Industries, are focusing on innovation, improving energy efficiency, and integrating new technologies to maintain their market leadership. These companies are forming strategic partnerships and investing in research and development to improve waste-to-energy systems. Babcock & Wilcox and SUEZ, for instance, are concentrating on advancing their incineration technologies, while Enerkem is exploring ways to enhance the efficiency of waste conversion into clean energy. These efforts are crucial for expanding market share and strengthening their competitive positions.
Table of Contents
Chapter 1 Methodology & Scope
- 1.1 Research design
- 1.2 Base estimates & calculations
- 1.3 Forecast calculation
- 1.4 Primary research & validation
- 1.4.1 Primary sources
- 1.4.2 Data mining sources
- 1.5 Market definitions
Chapter 2 Executive Summary
- 2.1 Industry synopsis, 2021 - 2034
Chapter 3 Industry Insights
- 3.1 Industry ecosystem
- 3.2 Trump administration tariff analysis
- 3.2.1 Impact on trade
- 3.2.1.1 Trade volume disruptions
- 3.2.1.2 Retaliatory measures
- 3.2.2 Impact on the industry
- 3.2.2.1 Supply-side impact (raw materials)
- 3.2.2.1.1 Price volatility in key materials
- 3.2.2.1.2 Supply chain restructuring
- 3.2.2.1.3 Production cost implications
- 3.2.2.2 Demand-side impact (selling price)
- 3.2.2.2.1 Price transmission to end markets
- 3.2.2.2.2 Market share dynamics
- 3.2.2.2.3 Consumer response patterns
- 3.2.2.1 Supply-side impact (raw materials)
- 3.2.3 Key companies impacted
- 3.2.4 Strategic industry responses
- 3.2.4.1 Supply chain reconfiguration
- 3.2.4.2 Pricing and product strategies
- 3.2.4.3 Policy engagement
- 3.2.5 Outlook and future considerations
- 3.2.1 Impact on trade
- 3.3 Regulatory landscape
- 3.4 Industry impact forces
- 3.4.1 Growth drivers
- 3.4.2 Industry pitfalls & challenges
- 3.5 Growth potential analysis
- 3.6 Porter's analysis
- 3.6.1 Bargaining power of suppliers
- 3.6.2 Bargaining power of buyers
- 3.6.3 Threat of new entrants
- 3.6.4 Threat of substitutes
- 3.7 PESTEL analysis
Chapter 4 Competitive landscape, 2024
- 4.1 Introduction
- 4.2 Strategic dashboard
- 4.3 Strategic initiative
- 4.4 Company market share
- 4.5 Competitive benchmarking
- 4.6 Innovation & sustainability landscape
Chapter 5 Market Size and Forecast, By Process, 2021 - 2034 (USD Billion)
- 5.1 Key trends
- 5.2 Thermal
- 5.2.1 CHP incineration
- 5.2.2 Co-combustion
- 5.2.3 Thermal gasification
- 5.2.4 Residual derived fuel plant
- 5.3 Biochemical
Chapter 6 Market Size and Forecast, By Application, 2021 - 2034 (USD Billion)
- 6.1 Key trends
- 6.2 Power generation
- 6.3 Heating
- 6.4 Others
Chapter 7 Market Size and Forecast, By Region, 2021 - 2034 (USD Billion)
- 7.1 Key trends
- 7.2 North America
- 7.2.1 U.S.
- 7.2.2 Canada
- 7.3 Europe
- 7.3.1 Sweden
- 7.3.2 Denmark
- 7.3.3 Norway
- 7.3.4 Italy
- 7.3.5 Netherlands
- 7.4 Asia Pacific
- 7.4.1 China
- 7.4.2 India
- 7.4.3 Japan
- 7.4.4 South Korea
- 7.4.5 Indonesia
- 7.4.6 Thailand
Chapter 8 Company Profiles
- 8.1 Babcock & Wilcox
- 8.2 Enerkem
- 8.3 Everbright Environment
- 8.4 Hitachi Zosen
- 8.5 JFE Engineering
- 8.6 Marubeni
- 8.7 Mitsubishi Heavy Industries
- 8.8 Reworld
- 8.9 SUEZ
- 8.10 Stellar3
- 8.11 Veolia
- 8.12 WM Intellectual Property Holdings
