
|
市場調査レポート
商品コード
1892854
往復動式発電エンジン市場の機会、成長要因、業界動向分析、および2026年から2035年までの予測Reciprocating Power Generating Engine Market Opportunity, Growth Drivers, Industry Trend Analysis, and Forecast 2026 - 2035 |
||||||
カスタマイズ可能
|
|||||||
| 往復動式発電エンジン市場の機会、成長要因、業界動向分析、および2026年から2035年までの予測 |
|
出版日: 2025年12月10日
発行: Global Market Insights Inc.
ページ情報: 英文 280 Pages
納期: 2~3営業日
|

概要
世界の往復式発電エンジン市場は、2025年に488億米ドルと評価され、2035年までにCAGR4%で成長し、731億米ドルに達すると予測されています。
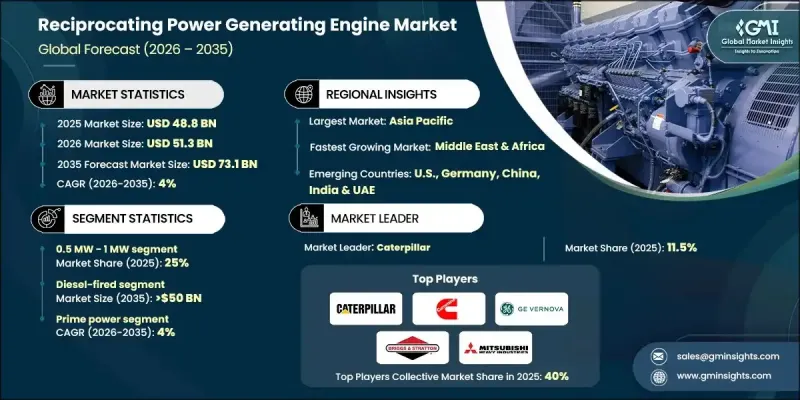
市場成長は、拡張するマイクログリッド構想と地方産業電化プログラムによって推進されており、これらが拡張性と信頼性を兼ね備えた電力ソリューションの需要を牽引しています。往復動エンジンは、迅速な起動、効率性、適応性が高く評価されており、都市部と遠隔地の双方において信頼性の高い電力供給に適しています。これらのエンジンはピストンの直線運動を回転機械エネルギーに変換し、シリンダー内での制御された燃料燃焼を通じて発電を行います。データセンター、鉱業、石油・ガス事業への投資拡大に加え、新興経済国におけるエネルギー耐性要件の高まりが需要を後押ししています。多様な燃料での稼働、変動負荷の管理、予備電力やピーク電力供給が可能な特性が、市場での存在感をさらに強化しています。技術進歩と再生可能エネルギー源の統合により、間欠的な発電を柔軟に補完する役割が拡大しています。
| 市場範囲 | |
|---|---|
| 開始年 | 2025年 |
| 予測年度 | 2026-2035 |
| 開始時価値 | 488億米ドル |
| 予測金額 | 731億米ドル |
| CAGR | 4% |
0.5MW~1MWのエンジンセグメントは、2025年に25%のシェアを占め、2035年までCAGR3.5%で成長すると予測されております。複数の分野における信頼性の高いバックアップソリューションへの需要の高まりを背景に、コンパクトでコスト効率に優れ、汎用性の高い産業用動力ユニットへの需要が増加しております。
ガス燃焼往復動エンジンセグメントは、2025年に112億米ドルに達し、運用効率の向上、環境規制への適合、再生可能エネルギー統合による需要急増を反映しています。これらのエンジンは、変動性・分散型再生可能エネルギー発電を支える信頼性の高いソリューションとして機能します。
米国往復式発電エンジン市場は2025年に70%のシェアを占め、67億米ドルの規模となりました。市場の成長は、バックアップ電源の需要増加、老朽化した送電網インフラ、分散型エネルギーソリューションの導入、クリーン燃料への規制支援、ならびに産業活動およびデータセンターの拡大によって支えられています。
よくあるご質問
目次
第1章 調査手法と範囲
第2章 エグゼクティブサマリー
第3章 業界考察
- エコシステム分析
- 原材料の入手可能性と調達分析
- 製造能力評価
- サプライチェーンのレジリエンスとリスク要因
- 流通ネットワーク分析
- 規制情勢
- 業界への影響要因
- 促進要因
- 業界の潜在的リスク&課題
- 成長可能性分析
- ポーター分析
- PESTEL分析
- 往復動式発電エンジンのコスト構造分析
- 価格動向分析(米ドル/MW)
- 地域別
- 定格出力別
- 新興の機会と動向
- デジタル化とIoT統合
- 新興市場への進出
- 破壊的動向と将来展望
- 市場の発展と歴史的背景
- 技術的基礎と性能特性
- エンジン回転数タイプと構成
- 効率曲線と運転パラメータ
第4章 競合情勢
- イントロダクション
- 企業の市場シェア分析:地域別
- 北米
- 欧州
- アジア太平洋地域
- 中東・アフリカ
- ラテンアメリカ
- 戦略的ダッシュボード
- 戦略的取り組み
- 主要な提携・協力関係
- 主要なM&A活動
- 製品革新と新製品発売
- 市場拡大戦略
- 競合ベンチマーキング
- イノベーションと持続可能性の情勢
第5章 市場規模・予測:燃料タイプ別、2022-2035
- 主要動向
- ガス焚き
- 0.5 MW-1 MW
- >1 MW-2 MW
- >2 MW-3.5 MW
- >3.5 MW-5 MW
- 5MW超-7.5MW
- 7.5MW超
- ディーゼル燃料式
- 0.5 MW-1 MW
- >1 MW-2 MW
- >2 MW-3.5 MW
- >3.5 MW-5 MW
- 5MW超-7.5MW
- 7.5MW超
- デュアル燃料
- 0.5 MW-1 MW
- >1 MW-2 MW
- >2MW-3.5MW
- >3.5 MW-5 MW
- 5MW超-7.5MW
- 7.5MW超
- その他
- 0.5 MW-1 MW
- >1 MW-2 MW
- >2MW-3.5MW
- >3.5 MW-5 MW
- 5MW超-7.5MW
- 7.5MW超
第6章 市場規模・予測:定格出力別、2022-2035
- 主要動向
- 0.5 MW~1 MW
- 1MW超~2MW
- 2MW超~3.5MW
- >3.5MW~5MW
- 5MW超~7.5MW
- 7.5MW超
第7章 市場規模・予測:用途別、2022-2035
- 主要動向
- 産業用
- CHP
- エネルギー・公益事業
- 埋立地・バイオガス
- 石油・ガス
- その他
第8章 市場規模・予測:最終用途別、2022-2035
- 主要動向
- 予備電源
- 0.5 MW-1 MW
- >1 MW-2 MW
- >2 MW-3.5 MW
- >3.5 MW-5 MW
- 5MW超-7.5MW
- 7.5 MW超
- 主出力
- 0.5 MW-1 MW
- >1 MW-2 MW
- >2 MW-3.5 MW
- >3.5 MW-5 MW
- 5MW超-7.5MW
- 7.5 MW超
第9章 市場規模・予測:地域別、2022-2035
- 主要動向
- 北米
- 米国
- カナダ
- メキシコ
- 欧州
- 英国
- フランス
- ドイツ
- ロシア
- イタリア
- スペイン
- オランダ
- デンマーク
- ノルウェー
- アジア太平洋地域
- 中国
- インド
- 日本
- 韓国
- オーストラリア
- タイ
- シンガポール
- インドネシア
- マレーシア
- フィリピン
- 中東・アフリカ
- アラブ首長国連邦
- サウジアラビア
- カタール
- オマーン
- クウェート
- イラン
- エジプト
- トルコ
- ヨルダン
- 南アフリカ
- ラテンアメリカ
- ブラジル
- アルゼンチン
- チリ
- ペルー
第10章 企業プロファイル
- Ashok Leyland
- Briggs &Stratton
- Caterpillar
- Cummins
- Deere &Company
- Deutz AG
- Enerflex
- Escorts Kubota Limited
- GE Vernova
- Guascor Energy
- Kawasaki Heavy Industries
- Kirloskar
- MAN Energy Solutions
- Mitsubishi Heavy Industries
- Rehlko
- Rolls-Royce
- Scania
- TRITON DURO
- Wartsila
- Yanmar Holdings
- Honda Motor
- IHI Corporation

