
|
市場調査レポート
商品コード
1716598
ノンアルコール飲料パッケージング市場の機会、成長促進要因、産業動向分析、2025年~2034年の予測Non-alcoholic Beverage Packaging Market Opportunity, Growth Drivers, Industry Trend Analysis, and Forecast 2025 - 2034 |
||||||
カスタマイズ可能
|
|||||||
| ノンアルコール飲料パッケージング市場の機会、成長促進要因、産業動向分析、2025年~2034年の予測 |
|
出版日: 2025年03月03日
発行: Global Market Insights Inc.
ページ情報: 英文 185 Pages
納期: 2~3営業日
|

全表示
- 概要
- 目次
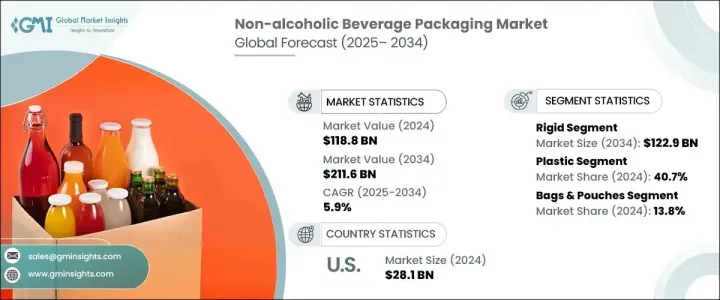
世界のノンアルコール飲料パッケージング市場は2024年に1,188億米ドルに達し、2025年から2034年にかけてCAGR 5.9%で成長すると予測されています。
消費者の嗜好がより健康的な飲料の選択にシフトするにつれ、革新的で持続可能なパッケージングソリューションへの需要が高まっています。ブランドは、鮮度を保ち、栄養の完全性を確保し、厳しい規制要件を満たす包装を採用することで、低糖飲料、本格的な果汁飲料、機能性飲料の人気の高まりに積極的に対応しています。環境に優しい素材や分量管理された包装形態への動向は、企業が環境への影響を最小限に抑えながら利便性の向上を目指しているため、市場をさらに活性化させています。
健康志向の消費者が機能性飲料の需要を牽引する中、ブランドは製品の魅力と持続可能性を高める戦略的ツールとして包装を活用するようになっています。エナジードリンク、フレーバーウォーター、低カロリー飲料の人気が高まるにつれ、製品の完全性を維持するだけでなく、消費者の期待に応えるパッケージングが求められています。軽量でリサイクル可能な素材、生分解性オプション、持続可能なパッケージング・イノベーションは、飲料メーカーが利便性と環境責任のバランスを追求する中で急速に普及しています。
| 市場範囲 | |
|---|---|
| 開始年 | 2024 |
| 予測年 | 2025-2034 |
| 開始金額 | 1,188億米ドル |
| 予測金額 | 2,116億米ドル |
| CAGR | 5.9% |
市場は硬包装と軟包装に区分され、硬質包装は2034年までに1,229億米ドルを創出すると予測されています。硬包装は、その耐久性、優れた製品保護、汎用性により、依然として好まれる選択肢であり、プレミアム飲料や機能性飲料にとって理想的なソリューションとなっています。高品質飲料の需要が高まり続ける中、メーカーは環境意識の高い消費者に対応するため、アルミニウムやガラスのような持続可能な素材を採用しつつあります。この動向は特にプレミアムジュースや機能性飲料の分野で顕著であり、各ブランドはパッケージの美しさ、リサイクル性、製品の差別化を重視しています。
2024年のノンアルコール飲料パッケージング市場の40.7%をプラスチック・セグメントが占め、手頃な価格と適応性により優位性を維持しています。しかし、非生分解性プラスチック廃棄物を取り巻く環境問題の高まりが、メーカーに持続可能な代替品への移行を促しています。再生PET(rPET)やバイオプラスチックの採用は勢いを増しており、企業は詰め替え用や再利用可能なペットボトルへの取り組みに投資しています。こうした取り組みは、世界の持続可能性目標に沿うものであると同時に、持ち運びや外出先での飲料の選択肢を求める消費者の利便性を継続的に確保するものでもあります。
北米は2024年のノンアルコール飲料パッケージング市場で27.1%のシェアを占め、主要地域プレーヤーとしての地位を強化しています。この地域の市場拡大は、持続可能なパッケージングに対する消費者の強い要望と、ペースの速いライフスタイルに対応するシングルサーブやオンザゴーのフォーマットへの嗜好が相まって推進されています。環境に優しい素材、スマート包装技術、機能的飲料包装ソリューションにおける絶え間ない技術革新は、世界の業界動向形成における北米の役割をさらに強化しています。
目次
第1章 調査手法と調査範囲
第2章 エグゼクティブサマリー
第3章 業界洞察
- エコシステム分析
- 業界への影響要因
- 促進要因
- 清涼飲料の売上増加
- 外出先での消費習慣へのシフト
- より健康的な飲料への需要の高まり
- 缶入りノンアルコール飲料の普及
- 大人向け清涼飲料の人気上昇
- 業界の潜在的リスク&課題
- 不安定な原料価格と厳しい環境規制
- プラスチックの環境影響
- 促進要因
- 成長可能性分析
- 規制状況
- 技術情勢
- 今後の市場動向
- ギャップ分析
- ポーター分析
- PESTEL分析
第4章 競合情勢
- イントロダクション
- 企業シェア分析
- 主要市場プレーヤーの競合分析
- 競合のポジショニングマトリックス
- 戦略ダッシュボード
第5章 市場推計・予測:タイプ別、2021年~2034年
- 主要動向
- 硬質
- 軟質
第6章 市場推計・予測:材料別、2021年~2034年
- 主要動向
- プラスチック
- PET
- PP
- HDPE
- LDPE
- その他
- 金属
- ガラス
- 紙・板紙
- その他
第7章 市場推計・予測:製品別、2021年~2034年
- 主要動向
- 袋・パウチ
- ボトル&ジャー
- 缶
- 樽・ドラム
- 箱・カートン
- その他
第8章 市場推計・予測:用途別、2021年~2034年
- 主要動向
- 炭酸飲料
- ジュース
- RTDティー&コーヒー
- 機能性飲料
- 乳製品
- その他
第9章 市場推計・予測:地域別、2021年~2034年
- 主要動向
- 北米
- 米国
- カナダ
- 欧州
- ドイツ
- 英国
- フランス
- スペイン
- イタリア
- オランダ
- アジア太平洋
- 中国
- インド
- 日本
- オーストラリア
- 韓国
- ラテンアメリカ
- ブラジル
- メキシコ
- アルゼンチン
- 中東・アフリカ
- サウジアラビア
- 南アフリカ
- アラブ首長国連邦
第10章 企業プロファイル
- Anchor Glass Container
- Airlite Plastics
- Ardagh Group
- Ball Corporation
- Can Corporation of America
- Can Pack Group
- C.L. Smith
- Crown Holdings
- Envases Group
- International Paper
- Mondi
- O-I Glass
- Pactiv Evergreen
- Silgan Containers
- Smurfit Kappa
- Stora Enso
- Tetra Pak
- Verallia
- WestRock
The Global Non-Alcoholic Beverage Packaging Market reached USD 118.8 billion in 2024 and is projected to grow at a CAGR of 5.9% between 2025 and 2034. As consumer preferences shift toward healthier beverage choices, the demand for innovative and sustainable packaging solutions is on the rise. Brands are actively responding to the growing popularity of low-sugar drinks, real juice beverages, and functional drinks by adopting packaging that preserves freshness, ensures nutritional integrity, and meets stringent regulatory requirements. The trend toward eco-friendly materials and portion-controlled packaging formats further fuels the market, as companies aim to enhance convenience while minimizing environmental impact.
With health-conscious consumers driving the demand for functional beverages, brands are increasingly leveraging packaging as a strategic tool to enhance product appeal and sustainability. The rising popularity of energy drinks, flavored water, and low-calorie options has created a need for packaging that not only maintains product integrity but also aligns with evolving consumer expectations. Lightweight, recyclable materials, biodegradable options, and sustainable packaging innovations are rapidly gaining traction as beverage companies seek to balance convenience with environmental responsibility.
| Market Scope | |
|---|---|
| Start Year | 2024 |
| Forecast Year | 2025-2034 |
| Start Value | $118.8 Billion |
| Forecast Value | $211.6 Billion |
| CAGR | 5.9% |
The market is segmented into rigid and flexible packaging types, with rigid packaging projected to generate USD 122.9 billion by 2034. Rigid packaging remains a preferred choice due to its durability, superior product protection, and versatility, making it an ideal solution for premium and functional beverages. As demand for high-quality beverages continues to rise, manufacturers are embracing sustainable materials like aluminum and glass to cater to eco-conscious consumers. This trend is particularly evident in the premium juice and functional beverage segment, where brands emphasize packaging aesthetics, recyclability, and product differentiation.
The plastic segment accounted for 40.7% of the non-alcoholic beverage packaging market in 2024, maintaining its dominance due to affordability and adaptability. However, growing environmental concerns surrounding non-biodegradable plastic waste are prompting manufacturers to transition toward sustainable alternatives. The adoption of recycled PET (rPET) and bioplastics is gaining momentum, with companies investing in refillable and reusable plastic bottle initiatives. These efforts align with global sustainability targets while ensuring continued convenience for consumers who seek portable and on-the-go beverage options.
North America held a 27.1% share in the non-alcoholic beverage packaging market in 2024, reinforcing its position as a key regional player. The market expansion in this region is driven by strong consumer demand for sustainable packaging, coupled with a preference for single-serve and on-the-go formats that cater to fast-paced lifestyles. Continuous innovation in eco-friendly materials, smart packaging technologies, and functional beverage packaging solutions further strengthens North America's role in shaping global industry trends.
Table of Contents
Chapter 1 Methodology and Scope
- 1.1 Market scope and definitions
- 1.2 Research design
- 1.2.1 Research approach
- 1.2.2 Data collection methods
- 1.3 Base estimates and calculations
- 1.3.1 Base year calculation
- 1.3.2 Key trends for market estimation
- 1.4 Forecast model
- 1.5 Primary research and validation
- 1.5.1 Primary sources
- 1.5.2 Data mining sources
Chapter 2 Executive Summary
- 2.1 Industry 3600 synopsis
Chapter 3 Industry Insights
- 3.1 Industry ecosystem analysis
- 3.2 Industry impact forces
- 3.2.1 Growth drivers
- 3.2.1.1 Increasing sales of soft drinks
- 3.2.1.2 Shift towards on-the-go consumption habits
- 3.2.1.3 Rising demand for healthier beverages
- 3.2.1.4 Proliferation of non-alcoholic beverages in cans
- 3.2.1.5 Rising popularity of adult soft drinks
- 3.2.2 Industry pitfalls and challenges
- 3.2.2.1 Volatile raw material prices and stringent environmental regulations
- 3.2.2.2 Environmental effects of plastic
- 3.2.1 Growth drivers
- 3.3 Growth potential analysis
- 3.4 Regulatory landscape
- 3.5 Technology landscape
- 3.6 Future market trends
- 3.7 Gap analysis
- 3.8 Porter's analysis
- 3.9 PESTEL analysis
Chapter 4 Competitive Landscape, 2024
- 4.1 Introduction
- 4.2 Company market share analysis
- 4.3 Competitive analysis of major market players
- 4.4 Competitive positioning matrix
- 4.5 Strategy dashboard
Chapter 5 Market Estimates and Forecast, By Type, 2021 - 2034 (USD Bn & Kilo Tons)
- 5.1 Key trends
- 5.2 Rigid
- 5.3 Flexible
Chapter 6 Market Estimates and Forecast, By Material, 2021 - 2034 (USD Bn & Kilo Tons)
- 6.1 Key trends
- 6.2 Plastic
- 6.2.1 PET
- 6.2.2 PP
- 6.2.3 HDPE
- 6.2.4 LDPE
- 6.2.5 Others
- 6.3 Metal
- 6.4 Glass
- 6.5 Paper & paperboard
- 6.6 Others
Chapter 7 Market Estimates and Forecast, By Product, 2021 - 2034 (USD Bn & Kilo Tons)
- 7.1 Key trends
- 7.2 Bags & pouch
- 7.3 Bottles & jars
- 7.4 Cans
- 7.5 Barrels & drums
- 7.6 Boxes & cartons
- 7.7 Others
Chapter 8 Market Estimates and Forecast, By Application, 2021 - 2034 (USD Bn & Kilo Tons)
- 8.1 Key trends
- 8.2 Carbonated soft drinks
- 8.3 Juices
- 8.4 Ready-to-drink tea & coffee
- 8.5 Functional drinks
- 8.6 Dairy products
- 8.7 Others
Chapter 9 Market Estimates and Forecast, By Region, 2021 - 2034 (USD Bn & Kilo Tons)
- 9.1 Key trends
- 9.2 North America
- 9.2.1 U.S.
- 9.2.2 Canada
- 9.3 Europe
- 9.3.1 Germany
- 9.3.2 UK
- 9.3.3 France
- 9.3.4 Spain
- 9.3.5 Italy
- 9.3.6 Netherlands
- 9.4 Asia Pacific
- 9.4.1 China
- 9.4.2 India
- 9.4.3 Japan
- 9.4.4 Australia
- 9.4.5 South Korea
- 9.5 Latin America
- 9.5.1 Brazil
- 9.5.2 Mexico
- 9.5.3 Argentina
- 9.6 Middle East and Africa
- 9.6.1 Saudi Arabia
- 9.6.2 South Africa
- 9.6.3 UAE
Chapter 10 Company Profiles
- 10.1 Anchor Glass Container
- 10.2 Airlite Plastics
- 10.3 Ardagh Group
- 10.4 Ball Corporation
- 10.5 Can Corporation of America
- 10.6 Can Pack Group
- 10.7 C.L. Smith
- 10.8 Crown Holdings
- 10.9 Envases Group
- 10.10 International Paper
- 10.11 Mondi
- 10.12 O-I Glass
- 10.13 Pactiv Evergreen
- 10.14 Silgan Containers
- 10.15 Smurfit Kappa
- 10.16 Stora Enso
- 10.17 Tetra Pak
- 10.18 Verallia
- 10.19 WestRock
