
デジタルサイネージ市場の機会、成長促進要因、産業動向分析、2025年~2034年の予測
Digital Signage Market Opportunity, Growth Drivers, Industry Trend Analysis, and Forecast 2025-2034- 発行日
- ページ情報
- 英文 200 Pages
- 納期
- 2~3営業日
- 商品コード
- 1699425
- カスタマイズ可能 お客様のご希望に応じて、既存データの加工や未掲載情報(例:国別セグメント)の追加などの対応が可能です。詳細はお問い合わせください。
- 翻訳ツール提供対象 PDF対応AI翻訳ツールの無料貸し出しサービスのご利用が可能です
概要
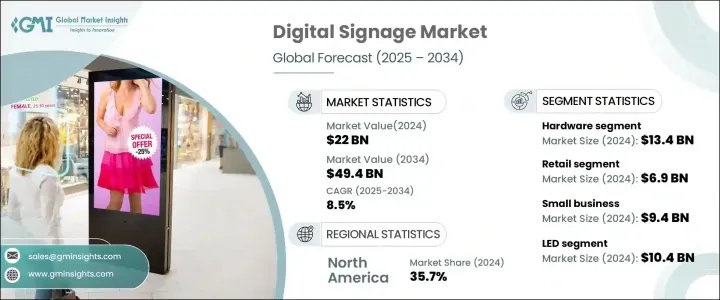
デジタルサイネージの世界市場は、2024年に220億米ドルと評価され、2025年から2034年にかけて8.5%のCAGRで拡大すると予想されています。
この成長の主な要因は、デジタル・アウト・オブ・ホーム(DOOH)広告とAI主導型コンテンツの採用が増加していることです。企業は、静的なビルボードから、リアルタイムのコンテンツ更新、エンゲージメントの強化、精度の高いターゲット広告を提供する動的なデジタルディスプレイへと急速に移行しています。クラウド対応のIoTを搭載したデジタルサイネージへの需要が高まっており、企業はコンテンツをリモートで管理し、DOOH広告への関心の高まりを活用できます。5G技術の導入により、シームレスなコンテンツ管理がさらに容易になり、リアルタイムの更新とパーソナライズされたプロモーション戦略が保証されます。
AIの統合も市場拡大を促進する重要な要因です。AIを搭載したデジタル・ディスプレイは、リアルタイムのコンテンツ調整、視聴者分析、パーソナライズされた広告を可能にします。企業はこれらの機能を活用して消費者行動を分析し、ターゲットを絞ったプロモーションを提供しています。小売店、交通ハブ、スマートシティでAI駆動型サイネージの導入が進む中、インタラクティブディスプレイや音声制御ディスプレイの需要が急増し続けています。AIの進歩は広告の精度を高め、企業がより効果的に聴衆と関わることを可能にしています。
| 市場範囲 | |
|---|---|
| 開始年 | 2024 |
| 予測年 | 2025-2034 |
| 開始金額 | 220億米ドル |
| 予測金額 | 494億米ドル |
| CAGR | 8.5% |
コンポーネントの観点から、市場はハードウェア、ソフトウェア、サービスに分類されます。ハードウェア分野は、ディスプレイ技術の進歩により、2024年の市場規模が134億米ドルとなり、依然として最大です。企業はLCDスクリーンからエネルギー効率の高いLED、OLED、MicroLEDディスプレイへと移行しており、これらのディスプレイは優れた画質、低消費電力、耐久性の向上を実現しています。特に、没入感のある広告体験のために高解像度のビジュアルを必要とする分野では、4Kおよび8Kサイネージの需要が高まっています。
アプリケーションは小売、ヘルスケア、ホスピタリティ、交通、教育、企業環境、銀行など多岐にわたる。支配的なセグメントである小売業は、インタラクティブサイネージとAIを活用したパーソナライゼーションへの投資の増加により、2024年には69億米ドルに達しました。小売業は、消費者エンゲージメントの強化、広告の合理化、業務効率の向上のために、これらのデジタルディスプレイを統合しています。
エンドユーザーに基づき、市場は中小企業、中堅企業、大企業に区分されます。小企業は2024年に94億米ドルを占め、サブスクリプションベースのデジタルサイネージソフトウェアが手頃な価格で提供されていることが要因となっています。プラグアンドプレイのサイネージソリューションの登場により、小規模企業は最小限の技術的専門知識と投資でデジタル広告を導入できるようになりました。
ディスプレイの種類では、LEDディスプレイが2024年に104億米ドルで最大のシェアを占めました。高輝度で耐候性に優れているため、屋外広告や大規模な商業ディスプレイに最適です。LEDパネルのコスト低下と製造技術の進歩が、LEDディスプレイの採用をさらに後押ししています。
屋内デジタルサイネージは、2024年に138億米ドルと評価され、店舗内ディスプレイ、セルフサービスキオスク、インタラクティブなブランド・エンゲージメント・ソリューションの需要拡大により、優位性を保っています。ナビゲーションやバーチャルアシスタントのためのタッチスクリーン・サイネージの人気は高まり続けており、消費者体験を向上させています。
特に32インチ未満の小型デジタルディスプレイは、2024年に60億米ドルに達しました。小売業者がダイナミックプライシング、商品推奨、店内プロモーションのために利用するケースが増えているためです。こうした費用対効果の高いソリューションは、デジタル広告への手頃な参入を求める中小企業に対応しています。
インタラクティブ・コンテンツは最も急成長しているセグメントで、CAGRは11.5%と予測されます。タッチスクリーン機能、モーションセンサー、AIによるパーソナライゼーションがデジタルサイネージに革命を起こし、セルフオーダーキオスクやバーチャル試着ソリューションが人気を集めています。小売業者や商業スペースは、顧客エンゲージメントを強化するためにこれらの技術を急速に導入しています。
2024年の市場は北米が35.7%のシェアでリードし、企業はAI主導のコンテンツ管理とターゲット広告に多額の投資を行っています。スマートシティ開発とインフラ強化を支援する政府の取り組みが、同地域におけるデジタルサイネージソリューションの採用をさらに後押ししています。
目次
第1章 調査手法と調査範囲
第2章 エグゼクティブサマリー
第3章 業界洞察
- エコシステム分析
- ベンダー・マトリックス
- 利益率分析
- テクノロジーとイノベーションの展望
- 特許分析
- 主要ニュースと取り組み
- 規制状況
- 影響要因
- 促進要因
- サプライチェーンの透明性に対する需要の高まり
- ディスプレイ技術の進歩
- インタラクティブ・コンテンツへの需要の高まり
- スマートシティの開発とインフラ整備
- コスト削減とROIの向上
- 小売分野での採用増加
- 業界の潜在的リスク&課題
- 高い初期投資とメンテナンスコスト
- コンテンツ管理の複雑さ
- 促進要因
- 成長可能性分析
- ポーター分析
- PESTEL分析
第4章 競合情勢
- イントロダクション
- 企業シェア分析
- 競合のポジショニング・マトリックス
- 戦略展望マトリックス
第5章 市場推計・予測:ディスプレイタイプ別、2021年~2034年
- 主要動向
- LCD
- LED
- OLED
- その他
第6章 市場推計・予測:コンポーネント別、2021年~2034年
- 主要動向
- ハードウェア
- ソフトウェア
- サービス
第7章 地域別市場推計・予測:所在地別、2021年~2034年
- 主要動向
- 屋内
- 屋外
第8章 市場規模推定・予測:ディスプレイサイズ別、2021年~2034年
- 主要動向
- 32インチ以下
- 32~52インチ
- 52インチ以上
第9章 市場推計・予測:コンテンツタイプ別、2021年~2034年
- 主要動向
- 静的
- ダイナミック
- インタラクティブ
第10章 市場推計・予測:最終用途別、2021年~2034年
- 主要動向
- 小規模企業
- 中規模企業
- 大企業
第11章 市場推計・予測:用途別、2021年~2034年
- 主要動向
- 小売
- ヘルスケア
- ホスピタリティ
- 輸送
- 教育
- 企業
- 銀行業
- その他
第12章 市場推計・予測:地域別、2021年~2034年
- 主要動向
- 北米
- 米国
- カナダ
- 欧州
- 英国
- ドイツ
- フランス
- イタリア
- スペイン
- その他欧州
- アジア太平洋
- 中国
- インド
- 日本
- 韓国
- ニュージーランド
- その他アジア太平洋地域
- ラテンアメリカ
- ブラジル
- メキシコ
- その他ラテンアメリカ
- 中東・アフリカ
- UAE
- 南アフリカ
- サウジアラビア
- その他中東・アフリカ
第13章 企業プロファイル
- BrightSign LLC
- Cisco Systems
- Daktronics
- Elo Touch Solutions
- Four Winds Interactive
- LG Electronics
- Mvix Digital Signage
- Navori Labs
- NEC Corporation
- Onelan Limited
- Panasonic Corporation
- Philips Professional Display Solutions
- Planar Systems
- Samsung Electronics
- Scala, Inc.
- Sharp Corporation
- Sony Corporation
- Toshiba Global Commerce Solutions
- ViewSonic Corporation
- Visix, Inc.
目次
The Global Digital Signage Market, valued at USD 22 billion in 2024, is expected to expand at an 8.5% CAGR from 2025 to 2034. This growth is primarily fueled by the increasing adoption of digital out-of-home (DOOH) advertising and AI-driven content. Businesses are rapidly transitioning from static billboards to dynamic digital displays that offer real-time content updates, enhanced engagement, and precision-targeted advertising. The demand for cloud-supported, IoT-powered digital signage is rising, enabling businesses to manage content remotely and capitalize on the growing interest in DOOH advertising. The deployment of 5G technology further facilitates seamless content management, ensuring real-time updates and personalized promotional strategies.
AI integration is another critical factor driving market expansion. AI-powered digital displays enable real-time content adjustments, audience analytics, and personalized advertising. Businesses are leveraging these capabilities to analyze consumer behavior and deliver targeted promotions. With the growing adoption of AI-driven signage in retail stores, transportation hubs, and smart cities, the demand for interactive and voice-controlled displays continues to surge. Advancements in AI are enhancing advertising precision, allowing businesses to engage with their audiences more effectively.
| Market Scope | |
|---|---|
| Start Year | 2024 |
| Forecast Year | 2025-2034 |
| Start Value | $22 Billion |
| Forecast Value | $49.4 Billion |
| CAGR | 8.5% |
In terms of components, the market is categorized into hardware, software, and services. The hardware segment, valued at USD 13.4 billion in 2024, remains the largest due to advancements in display technology. Businesses are shifting from LCD screens to energy-efficient LED, OLED, and MicroLED displays, which offer superior image quality, lower power consumption, and enhanced durability. The demand for 4K and 8K signage is rising, particularly in sectors that require high-resolution visuals for immersive advertising experiences.
The application landscape is diverse, encompassing retail, healthcare, hospitality, transportation, education, corporate environments, and banking. Retail, the dominant segment, reached USD 6.9 billion in 2024, driven by increased investment in interactive signage and AI-powered personalization. Retailers are integrating these digital displays to enhance consumer engagement, streamline advertising, and improve operational efficiency.
Based on end users, the market is segmented into small businesses, medium businesses, and large enterprises. Small businesses accounted for USD 9.4 billion in 2024, driven by the affordability of subscription-based digital signage software. The emergence of plug-and-play signage solutions allows smaller enterprises to adopt digital advertising with minimal technical expertise and investment.
Among display types, LED displays held the largest share at USD 10.4 billion in 2024. Their high brightness and weather resistance make them ideal for outdoor advertising and large-scale commercial displays. Declining LED panel costs and manufacturing advancements further boost their adoption.
Indoor digital signage, valued at USD 13.8 billion in 2024, remains dominant due to growing demand for in-store displays, self-service kiosks, and interactive brand engagement solutions. The popularity of touchscreen signage for navigation and virtual assistance continues to rise, enhancing consumer experiences.
Smaller digital displays, particularly those under 32 inches, reached USD 6 billion in 2024, as retailers increasingly use them for dynamic pricing, product recommendations, and in-store promotions. These cost-effective solutions cater to small businesses seeking affordable entry into digital advertising.
Interactive content is the fastest-growing segment, with a projected CAGR of 11.5%. Touchscreen functionality, motion sensors, and AI-driven personalization are revolutionizing digital signage, with self-ordering kiosks and virtual try-on solutions gaining popularity. Retailers and commercial spaces are rapidly adopting these technologies to enhance customer engagement.
North America led the market in 2024, holding a 35.7% share, with businesses heavily investing in AI-driven content management and targeted advertising. Government initiatives supporting smart city development and infrastructure enhancements further drive the adoption of digital signage solutions in the region.
Table of Contents
Chapter 1 Methodology & Scope
- 1.1 Market scope & definition
- 1.2 Base estimates & calculations
- 1.3 Forecast calculation
- 1.4 Data sources
- 1.4.1 Primary
- 1.4.2 Secondary
- 1.4.2.1 Paid sources
- 1.4.2.2 Public sources
Chapter 2 Executive Summary
- 2.1 Industry 360º synopsis, 2021 - 2034
Chapter 3 Industry Insights
- 3.1 Industry ecosystem analysis
- 3.2 Vendor matrix
- 3.3 Profit margin analysis
- 3.4 Technology & innovation landscape
- 3.5 Patent analysis
- 3.6 Key news and initiatives
- 3.7 Regulatory landscape
- 3.8 Impact forces
- 3.8.1 Growth drivers
- 3.8.1.1 Rising demand for supply chain transparency
- 3.8.1.2 Advancements in display technology
- 3.8.1.3 Increasing demand for interactive content
- 3.8.1.4 Growth of smart cities and infrastructure development
- 3.8.1.5 Cost reduction and improved ROI
- 3.8.1.6 Increasing adoption in the retail sector
- 3.8.2 Industry pitfalls & challenges
- 3.8.2.1 High initial investment and maintenance costs
- 3.8.2.2 Content management complexity
- 3.8.1 Growth drivers
- 3.9 Growth potential analysis
- 3.10 Porter's analysis
- 3.10.1 Supplier power
- 3.10.2 Buyer power
- 3.10.3 Threat of new entrants
- 3.10.4 Threat of substitutes
- 3.10.5 Industry rivalry
- 3.11 PESTEL analysis
Chapter 4 Competitive Landscape, 2023
- 4.1 Introduction
- 4.2 Company market share analysis
- 4.3 Competitive positioning matrix
- 4.4 Strategic outlook matrix
Chapter 5 Market Estimates & Forecast, By Display Type, 2021 - 2034 (USD million)
- 5.1 Key trends
- 5.2 LCD
- 5.3 LED
- 5.4 OLED
- 5.5 Others
Chapter 6 Market Estimates & Forecast, By Component, 2021 - 2034 (USD million)
- 6.1 Key trends
- 6.2 Hardware
- 6.3 Software
- 6.4 Services
Chapter 7 Market Estimates & Forecast, By Location, 2021 - 2034 (USD million)
- 7.1 Key trends
- 7.2 Indoor
- 7.3 Outdoor
Chapter 8 Market Estimates & Forecast, By Display Size, 2021 - 2034 (USD million)
- 8.1 Key trends
- 8.2 Below 32 inches
- 8.3 32 to 52 inches
- 8.4 Above 52 inches
Chapter 9 Market Estimates & Forecast, By Content Type, 2021 - 2034 (USD million)
- 9.1 Key trends
- 9.2 Static
- 9.3 Dynamic
- 9.4 Interactive
Chapter 10 Market Estimates & Forecast, By End Use, 2021 - 2034 (USD million)
- 10.1 Key trends
- 10.2 Small Businesses
- 10.3 Medium Businesses
- 10.4 Large Enterprises
Chapter 11 Market Estimates & Forecast, By Application, 2021 - 2034 (USD million)
- 11.1 Key trends
- 11.2 Retail
- 11.3 Healthcare
- 11.4 Hospitality
- 11.5 Transportation
- 11.6 Education
- 11.7 Corporate
- 11.8 Banking
- 11.9 Others
Chapter 12 Market Estimates & Forecast, By Region, 2021 - 2034 (USD million)
- 12.1 Key trends
- 12.2 North America
- 12.2.1 U.S.
- 12.2.2 Canada
- 12.3 Europe
- 12.3.1 UK
- 12.3.2 Germany
- 12.3.3 France
- 12.3.4 Italy
- 12.3.5 Spain
- 12.3.6 Rest of Europe
- 12.4 Asia Pacific
- 12.4.1 China
- 12.4.2 India
- 12.4.3 Japan
- 12.4.4 South Korea
- 12.4.5 ANZ
- 12.4.6 Rest of Asia Pacific
- 12.5 Latin America
- 12.5.1 Brazil
- 12.5.2 Mexico
- 12.5.3 Rest of Latin America
- 12.6 MEA
- 12.6.1 UAE
- 12.6.2 South Africa
- 12.6.3 Saudi Arabia
- 12.6.4 Rest of MEA
Chapter 13 Company Profiles
- 13.1 BrightSign LLC
- 13.2 Cisco Systems
- 13.3 Daktronics
- 13.4 Elo Touch Solutions
- 13.5 Four Winds Interactive
- 13.6 LG Electronics
- 13.7 Mvix Digital Signage
- 13.8 Navori Labs
- 13.9 NEC Corporation
- 13.10 Onelan Limited
- 13.11 Panasonic Corporation
- 13.12 Philips Professional Display Solutions
- 13.13 Planar Systems
- 13.14 Samsung Electronics
- 13.15 Scala, Inc.
- 13.16 Sharp Corporation
- 13.17 Sony Corporation
- 13.18 Toshiba Global Commerce Solutions
- 13.19 ViewSonic Corporation
- 13.20 Visix, Inc.
- 発行日
- 発行
- Global Market Insights Inc.
- ページ情報
- 英文 200 Pages
- 納期
- 2~3営業日


