
|
市場調査レポート
商品コード
1699329
オフショア風力エネルギー市場の機会、成長促進要因、産業動向分析、2025年~2034年の予測Offshore Wind Energy Market Opportunity, Growth Drivers, Industry Trend Analysis, and Forecast 2025-2034 |
||||||
カスタマイズ可能
|
|||||||
| オフショア風力エネルギー市場の機会、成長促進要因、産業動向分析、2025年~2034年の予測 |
|
出版日: 2025年02月21日
発行: Global Market Insights Inc.
ページ情報: 英文 150 Pages
納期: 2~3営業日
|

全表示
- 概要
- 目次
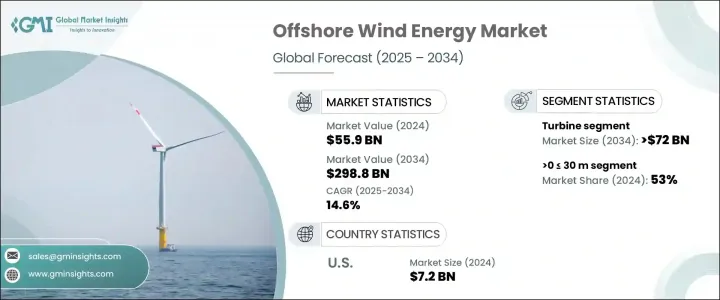
世界のオフショア風力エネルギー市場は2024年に559億米ドルに達し、2025年から2034年にかけてCAGR14.6%で拡大すると予測されています。
急速な産業化、電力需要の急増、二酸化炭素排出量の抑制という差し迫ったニーズにより、オフショア風力エネルギーは世界の再生可能エネルギーの重要な構成要素となっています。世界各国の政府は、クリーンエネルギー投資を加速させるため、固定関税、技術別割当、競合オークションなど、積極的な政策やインセンティブを実施しています。このような施策が産業の拡大を促し、持続可能なエネルギー発電の主要なソリューションとしてのオフショア風力の役割を強化しています。
タービン技術の進歩、送電網インフラの改善、設置コストの低下は、市場の勢いをさらに加速させています。長いブレードと高いタワーによって強化された、より大型で効率的な風力タービンは、エネルギーの捕捉と発電を最適化しています。こうした技術革新は、運転効率を向上させるだけでなく、平準化エネルギーコスト(LCOE)を低減させ、オフショア風力発電の従来の化石燃料に対する競争力を高めています。高圧直流(HVDC)システムやハイブリッド変電所を含むトランスミッション・インフラへの投資は、エネルギー配給効率を高めています。各国政府がネット・ゼロ・カーボン目標の達成に向けた取り組みを強化する中、オフショア風力セクターは世界のエネルギー転換において極めて重要な役割を果たすことになると思われます。
| 市場範囲 | |
|---|---|
| 開始年 | 2024 |
| 予測年 | 2025-2034 |
| 開始金額 | 559億米ドル |
| 予測金額 | 2,988億米ドル |
| CAGR | 14.6% |
タービン部門は依然としてオフショア風力エネルギー導入の主要な推進力であり、2034年までに720億米ドルの評価額が予測されています。再生可能エネルギー発電ソリューションの絶え間ない推進により、より大きな出力を生成できる大容量風力タービンの開発が加速しています。ローターの直径を拡大し、空力設計を最適化したオフショア風力発電設備は、特に風速が安定している高高度で、風の取り込みを最大化しています。業界全体が発電電力量1メガワット時あたりのコスト削減に重点を置いているため、現在進行中の研究開発イニシアティブによって、さらなる効率向上が見込まれます。オフショア風力発電所の規模と容量が拡大し続ける中、タービン技術は市場拡大の最前線であり続けると思われます。
オフショア風力発電プロジェクトは、水深に基づいて0~30 m、30~50 m、50 m超の3つのカテゴリーに分類されます。浅海セグメントは、コスト面の優位性と設置手順の簡素化により、2024年の市場シェア53%を占めました。浅瀬のウインドファームは、複雑な基礎工学を必要としないため、迅速な展開と資本支出の削減が可能になります。ハイブリッド変電所による交流(AC)と直流(DC)トランスミッションの統合は、エネルギー配給を合理化し、運用効率をさらに高める。経済的・物流的な利点を考慮し、開発業者はオフショア風力発電プロジェクトに浅海域の立地を優先しており、今後数年間は市場の持続的な拡大が見込まれます。
米国のオフショア風力エネルギー市場は、2024年には72億米ドルに達し、北米が世界の16%のシェアを占める。この地域の成長軌道は、支持的な規制枠組み、オフショア風力インフラへの多額の投資、脱炭素化への取り組みの高まりによって後押しされています。技術革新が効率改善とコスト削減を推進する中、オフショア風力は実行可能で拡張性のあるエネルギーソリューションとして台頭しつつあります。プロジェクト認可の増加とインフラ開発の進行により、北米は今後10年間で世界のオフショア風力エネルギー分野の主要プレーヤーになることが予想されます。
目次
第1章 調査手法と調査範囲
- 市場の定義
- 基本推定と計算
- 予測モデル
- 1次調査と検証
- 市場定義
第2章 エグゼクティブサマリー
第3章 業界洞察
- エコシステム分析
- 規制状況
- 業界への影響要因
- 促進要因
- 業界の潜在的リスク&課題
- 成長ポテンシャル分析
- ポーター分析
- PESTEL分析
第4章 競合情勢
- イントロダクション
- 戦略ダッシュボード
- イノベーションと持続可能性の展望
第5章 市場規模・予測:成分別、2021年~2034年
- 主要動向
- タービン
- 定格
- 2 MW以下
- 2~5 MW
- 5~8 MW
- 8~10 MW
- 10~12 MW
- 12 MW超
- 設置
- フローティング
- 軸
- 水平
- 上向き
- 下向き
- 垂直軸
- 水平
- コンポーネント
- ブレード
- タワー
- その他
- 軸
- 固定
- 軸
- 水平
- 上向き
- ダウンウインド
- 垂直
- 水平
- コンポーネント
- ブレード
- タワー
- その他
- 軸
- フローティング
- 定格
- 支持構造
- 下部構造(スチール)
- 基礎
- モノパイル
- ジャケット
- その他
- 電気インフラ
- 電線・ケーブル
- 変電所
- その他
- その他
第6章 市場規模・予測:深さ別、2021年~2034年
- 主要動向
- 0~30 m
- 30~50 m
- 50 m超
第7章 市場規模・予測:地域別、2021年~2034年
- 主要動向
- 北米
- 米国
- カナダ
- 欧州
- ドイツ
- スペイン
- 英国
- フランス
- イタリア
- スウェーデン
- ポーランド
- デンマーク
- ポルトガル
- オランダ
- アイルランド
- ベルギー
- アジア太平洋
- 中国
- インド
- オーストラリア
- 日本
- 韓国
- ベトナム
- フィリピン
- 台湾
- 世界のその他の地域
第8章 企業プロファイル
- Enessere
- Furukawa Electric
- General Electric
- Global Energy(Group)Limited
- Goldwind
- IMPSA
- LS Cable &System
- Nexans
- Nordex SE
- Prysmian Group
- Siemens Gamesa Renewable Energy
- Sumitomo Electric Industries
- Southwire Company
- Suzlon Energy Limited
- Vestas
- WEG
The Global Offshore Wind Energy Market reached USD 55.9 billion in 2024 and is projected to expand at a CAGR of 14.6% between 2025 and 2034. Rapid industrialization, surging electricity demand, and the pressing need to curb carbon emissions have positioned offshore wind energy as a critical component of the global renewable energy landscape. Governments worldwide are implementing aggressive policies and incentives to accelerate clean energy investments, including fixed tariffs, technology-specific quotas, and competitive auctions. These measures are driving industry expansion, reinforcing the role of offshore wind as a primary solution for sustainable energy generation.
Advancements in turbine technology, improvements in grid infrastructure, and declining installation costs are further fueling market momentum. Larger and more efficient wind turbines, enhanced by longer blades and taller towers, are optimizing energy capture and generation. These innovations not only improve operational efficiency but also reduce the levelized cost of energy (LCOE), making offshore wind increasingly competitive with traditional fossil fuels. Investments in transmission infrastructure, including high-voltage direct current (HVDC) systems and hybrid substations, are enhancing energy distribution efficiency. As governments ramp up their commitment to achieving net-zero carbon goals, the offshore wind sector is set to play a pivotal role in global energy transformation.
| Market Scope | |
|---|---|
| Start Year | 2024 |
| Forecast Year | 2025-2034 |
| Start Value | $55.9 Billion |
| Forecast Value | $298.8 Billion |
| CAGR | 14.6% |
The turbine segment remains a key driver of offshore wind energy adoption, with projections indicating a valuation of USD 72 billion by 2034. The relentless push for renewable energy solutions is accelerating the development of high-capacity wind turbines capable of generating greater power output. Offshore installations with extended rotor diameters and optimized aerodynamic designs are maximizing wind capture, especially at higher altitudes where wind speeds are more consistent. With an industry-wide focus on reducing costs per megawatt-hour of electricity generated, ongoing research and development initiatives are expected to unlock further efficiency gains. As offshore wind farms continue to scale up in size and capacity, turbine technology will remain at the forefront of market expansion.
Offshore wind projects are classified based on depth into three categories: >0 <= 30 m, >30 <= 50 m, and >50 m. The shallow-water segment, covering depths of >0 <= 30 m, accounted for a 53% market share in 2024, driven by cost advantages and simplified installation procedures. Wind farms in shallow waters require less complex foundation engineering, enabling faster deployment and reduced capital expenditure. The integration of alternating current (AC) and direct current (DC) transmission systems through hybrid substations is streamlining energy distribution, further enhancing operational efficiencies. Given the financial and logistical benefits, developers are prioritizing shallow-water locations for offshore wind projects, ensuring sustained market expansion in the coming years.
The US offshore wind energy market reached USD 7.2 billion in 2024, with North America capturing a 16% share of the global industry. The region's growth trajectory is fueled by supportive regulatory frameworks, significant investments in offshore wind infrastructure, and a growing commitment to decarbonization. As technological innovations drive efficiency improvements and cost reductions, offshore wind is emerging as a viable and scalable energy solution. With increasing project approvals and ongoing infrastructure development, North America is set to become a key player in the global offshore wind energy sector over the next decade.
Table of Contents
Chapter 1 Methodology & Scope
- 1.1 Market definitions
- 1.2 Base estimates & calculations
- 1.3 Forecast model
- 1.4 Primary research & validation
- 1.4.1 Primary sources
- 1.4.2 Data mining sources
- 1.5 Market definitions
Chapter 2 Executive Summary
- 2.1 Industry 3600 synopsis, 2021 – 2034
Chapter 3 Industry Insights
- 3.1 Industry ecosystem analysis
- 3.2 Regulatory landscape
- 3.3 Industry impact forces
- 3.3.1 Growth drivers
- 3.3.2 Industry pitfalls & challenges
- 3.4 Growth potential analysis
- 3.5 Porter's analysis
- 3.5.1 Bargaining power of suppliers
- 3.5.2 Bargaining power of buyers
- 3.5.3 Threat of new entrants
- 3.5.4 Threat of substitutes
- 3.6 PESTEL analysis
Chapter 4 Competitive landscape, 2024
- 4.1 Introduction
- 4.2 Strategic dashboard
- 4.3 Innovation & sustainability landscape
Chapter 5 Market Size and Forecast, By Component, 2021 – 2034 (MW & USD Million)
- 5.1 Key trends
- 5.2 Turbine
- 5.2.1 Rating
- 5.2.1.1 ≤ 2 MW
- 5.2.1.2 >2≤ 5 MW
- 5.2.1.3 >5≤ 8 MW
- 5.2.1.4 >8≤10 MW
- 5.2.1.5 >10≤ 12 MW
- 5.2.1.6 > 12 MW
- 5.2.2 Installation
- 5.2.2.1 Floating
- 5.2.2.1.1 Axis
- 5.2.2.1.1.1 Horizontal
- 5.2.2.1.1.1.1 Up wind
- 5.2.2.1.1.1.2 Down wind
- 5.2.2.1.1.2 Vertical
- 5.2.2.1.1.1 Horizontal
- 5.2.2.1.2 Component
- 5.2.2.1.2.1 Blades
- 5.2.2.1.2.2 Towers
- 5.2.2.1.2.3 Others
- 5.2.2.1.1 Axis
- 5.2.2.2 Fixed
- 5.2.2.2.1 Axis
- 5.2.2.2.1.1 Horizontal
- 5.2.2.2.1.1.1 Up wind
- 5.2.2.2.1.1.2 Down wind
- 5.2.2.2.1.2 Vertical
- 5.2.2.2.1.1 Horizontal
- 5.2.2.2.2 Component
- 5.2.2.2.2.1 Blades
- 5.2.2.2.2.2 Towers
- 5.2.2.2.2.3 Others
- 5.2.2.2.1 Axis
- 5.2.2.1 Floating
- 5.2.1 Rating
- 5.3 Support Structure
- 5.3.1 Substructure (Steel)
- 5.3.2 Foundation
- 5.3.2.1 Monopile
- 5.3.2.2 Jacket
- 5.3.3 Others
- 5.4 Electrical Infrastructure
- 5.4.1.1 Wires & cables
- 5.4.1.2 Substation
- 5.4.1.3 Others
- 5.5 Others
Chapter 6 Market Size and Forecast, By Depth, 2021 – 2034 (MW & USD Million)
- 6.1 Key trends
- 6.2 > 0 to ≤ 30 m
- 6.3 > 30 to ≤ 50 m
- 6.4 > 50 m
Chapter 7 Market Size and Forecast, By Region, 2021 – 2034 (MW & USD Million)
- 7.1 Key trends
- 7.2 North America
- 7.2.1 U.S.
- 7.2.2 Canada
- 7.3 Europe
- 7.3.1 Germany
- 7.3.2 Spain
- 7.3.3 UK
- 7.3.4 France
- 7.3.5 Italy
- 7.3.6 Sweden
- 7.3.7 Poland
- 7.3.8 Denmark
- 7.3.9 Portugal
- 7.3.10 Netherlands
- 7.3.11 Ireland
- 7.3.12 Belgium
- 7.4 Asia Pacific
- 7.4.1 China
- 7.4.2 India
- 7.4.3 Australia
- 7.4.4 Japan
- 7.4.5 South Korea
- 7.4.6 Vietnam
- 7.4.7 Philippines
- 7.4.8 Taiwan
- 7.5 Rest of World
Chapter 8 Company Profiles
- 8.1 Enessere
- 8.2 Furukawa Electric
- 8.3 General Electric
- 8.4 Global Energy (Group) Limited
- 8.5 Goldwind
- 8.6 IMPSA
- 8.7 LS Cable & System
- 8.8 Nexans
- 8.9 Nordex SE
- 8.10 Prysmian Group
- 8.11 Siemens Gamesa Renewable Energy
- 8.12 Sumitomo Electric Industries
- 8.13 Southwire Company
- 8.14 Suzlon Energy Limited
- 8.15 Vestas
- 8.16 WEG

