|
|
市場調査レポート
商品コード
1698282
電気商用車市場の機会、成長促進要因、産業動向分析、2025年~2034年の予測Electric Commercial Vehicle Market Opportunity, Growth Drivers, Industry Trend Analysis, and Forecast 2025 - 2034 |
||||||

|
|||||||
カスタマイズ可能
|
|||||||

| 電気商用車市場の機会、成長促進要因、産業動向分析、2025年~2034年の予測 |
|
出版日: 2025年02月07日
発行: Global Market Insights Inc.
ページ情報: 英文 170 Pages
納期: 2~3営業日
|

全表示
- 概要
- 目次
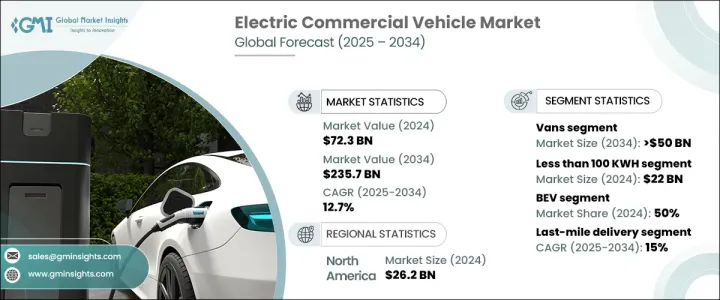
世界の電気商用車市場は、2024年に723億米ドルと評価され、2025年から2034年にかけて12.7%のCAGRで拡大すると予想されています。
世界各国の政府は、補助金、税額控除、採用を奨励するための政策を通じて、この成長を推進しています。排出削減目標、カーボン・ニュートラルへのコミットメント、規制上のインセンティブが、企業や車両運行会社に電動車両への投資を促しています。補助金付きの充電インフラ、道路税の免除、財政支援プログラムにより、電気商用車は従来の燃料式選択肢に代わるコスト効率の高い選択肢となっています。
技術の進歩と材料管理の改善によるバッテリーのコスト低下により、購入しやすい価格になっています。バッテリーの効率は向上し、航続距離の延長と車両性能の向上につながりました。充電ネットワークの拡大とバッテリースワップ技術の進歩により、さらに普及が進んでいます。急速充電ソリューションと再生可能エネルギーの統合に対する官民の投資により、電気商用車はより実用的になっています。2024年に397億米ドルと評価されたEV充電ステーション市場は、2034年には3,500億米ドルを超えると予測されています。
| 市場規模 | |
|---|---|
| 開始年 | 2024 |
| 予測年 | 2025-2034 |
| 開始金額 | 723億米ドル |
| 予測金額 | 2,357億米ドル |
| CAGR | 12.7% |
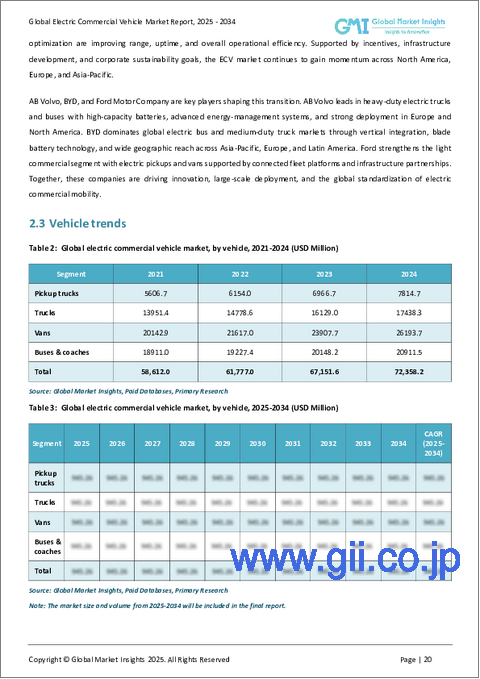
電気商用車には、ピックアップトラック、トラック、バン、バスが含まれます。市場の36%以上を占めるバンは、2034年までに500億米ドルを超えると予想されています。そのコンパクトなサイズと操縦性により、都市部の物流やラストマイルの配達に理想的です。企業は、低排出ガス地域規制を遵守しながら燃料費と維持費を削減するため、電気バンへの移行を進めています。金融優遇措置や免税措置は、フリート事業者の購入しやすさをさらに高めています。
バッテリー容量のセグメンテーションには、100 kWh未満、101~250 kWh、251~400 kWh、401~550 kWh、550 kWh以上が含まれます。100kWh未満のカテゴリーが2024年には主流となり、220億米ドルの収益を生み出します。バッテリーパックの軽量化は、エネルギー効率、車両の操作性、性能を向上させる。また、充電速度も速いため、ほとんどの充電ネットワークに対応できます。1回の充電で250~400マイルという最適な航続距離は、実用性と費用対効果のバランスがとれており、小型バッテリーパックは都市型モビリティや商用バンに好ましい選択肢となっています。
電気商用車は、バッテリー電気自動車(BEV)、燃料電池電気自動車(FCEV)、ハイブリッド商用電気自動車(HCEV)に分類されます。BEVは維持費と運転効率が低いため、2024年には市場の50%を占める。ハイブリッド車や燃料電池車よりも可動部品が少ないBEVは、個人とフリート運用者の双方にとって長期的な経費を削減します。政府補助金と排ガス規制の強化が、BEVの採用をさらに後押ししています。都市部におけるゼロエミッションゾーンの拡大はこの動向を加速させ、BEVを商用フリートにとっての主要な選択肢にしています。
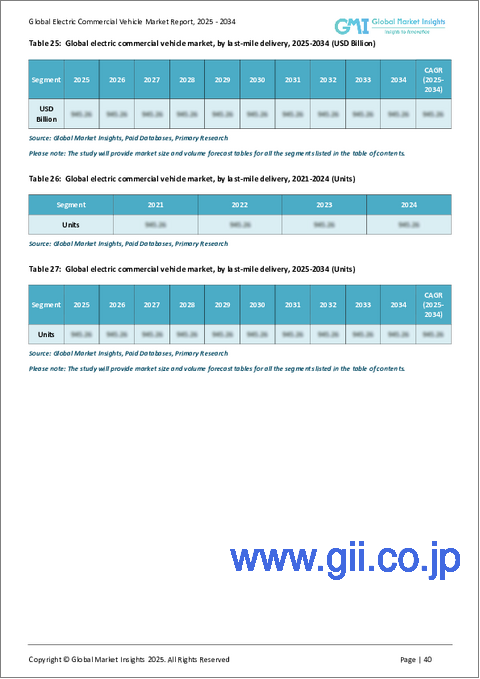
最終用途別の市場セグメントには、ラストマイル配送、フィールドサービス、配送サービス、長距離輸送、ごみ収集車が含まれます。ラストワンマイルデリバリー分野は、eコマースの拡大や費用対効果の高い持続可能な輸送ソリューションへの需要の高まりにより、CAGR15%と最も速いペースで成長すると見られています。電気式配送車両は、燃料費と維持費が安く、混雑した場所でも簡単に移動でき、低排出ガス規制に準拠しています。計画ルートを最適化し、充電スケジュールを立てることができるため、ダウンタイムが短縮され、業務効率が向上します。
北米は36%のシェアで世界の電気商用車市場をリードしており、米国は2024年に262億米ドルの収益を上げます。有利な政策、税額控除、補助金、インフラ投資が普及を後押ししています。政府のイニシアチブは、車両の電力への移行を奨励し、連邦政府の資金援助は、全国的なEV充電ステーションの拡大を支援しています。その結果、米国は持続可能な交通手段への世界のシフトにおける主要プレーヤーであり続けています。
目次
第1章 調査手法と調査範囲
- 調査デザイン
- 調査アプローチ
- データ収集方法
- 基本推定と計算
- 基準年の算出
- 市場推計の主要動向
- 予測モデル
- 1次調査と検証
- 市場範囲と定義
第2章 エグゼクティブサマリー
第3章 業界洞察
- エコシステム分析
- サプライヤーの状況
- 原材料サプライヤー
- 部品サプライヤー
- メーカー
- 技術プロバイダー
- 最終用途
- 利益率分析
- サプライヤーの状況
- 技術とイノベーションの展望
- 特許分析
- 規制状況
- 価格動向
- 影響要因
- 促進要因
- 政府の政策とインセンティブ
- 電池コストの低下
- 企業の持続可能性目標とESGコンプライアンス
- 都市化とラストマイル配送の増加
- 技術の進歩
- 業界の潜在的リスク&課題
- 規制と法的ハードル
- 高い開発コスト
- 促進要因
- 成長可能性分析
- ポーター分析
- PESTEL分析
第4章 競合情勢
- イントロダクション
- 企業シェア分析
- 競合のポジショニング・マトリックス
- 戦略展望マトリックス
第5章 市場推計・予測:車両別、2021年~2034年
- 主要動向
- ピックアップトラック
- トラック
- バン
- バス・コーチ
第6章 市場推計・予測:推進別、2021年~2034年
- 主要動向
- BEV
- FCEV
- HCEV
第7章 市場推計・予測:バッテリー容量別、2021年~2034年
- 主要動向
- 100KWH未満
- 101-250 KWH
- 251-400 KWH
- 401-550 KWH
- 550KWH以上
第8章 市場推計・予測:最終用途別、2021年~2034年
- 主要動向
- ラストマイル・デリバリー
- フィールドサービス
- 物流サービス
- 長距離輸送
- ごみ収集車
第9章 市場推計・予測:地域別、2021年~2034年
- 主要動向
- 北米
- 米国
- カナダ
- 欧州
- 英国
- ドイツ
- フランス
- イタリア
- スペイン
- ロシア
- 北欧
- アジア太平洋
- 中国
- インド
- 日本
- オーストラリア
- 韓国
- 東南アジア
- ラテンアメリカ
- ブラジル
- メキシコ
- アルゼンチン
- 中東・アフリカ
- UAE
- 南アフリカ
- サウジアラビア
第10章 企業プロファイル
- AB Volvo
- Bollinger Motors
- BYD
- Dongfeng Motor
- Ford Motor
- Irizar Group
- Isuzu Motors
- IVECO
- Mercedes Benz
- Nikola
- Paccar
- Proterra
- Renault
- Rivian
- Scania
- Tata Motors
- Tesla
- VDL Groep
- Workhorse Group
- Yutong
The Global Electric Commercial Vehicle Market, valued at USD 72.3 billion in 2024, is expected to expand at a 12.7% CAGR between 2025 and 2034. Governments worldwide are driving this growth through subsidies, tax credits, and policies designed to encourage adoption. Emission reduction targets, carbon neutrality commitments, and regulatory incentives are prompting businesses and fleet operators to invest in electric fleets. Subsidized charging infrastructure, road tax exemptions, and financial support programs make electric commercial vehicles a cost-effective alternative to conventional fuel-powered options.
The declining cost of batteries due to technological advancements and improved material management has enhanced affordability. Battery efficiency has increased, leading to longer ranges and improved vehicle performance. Expanding charging networks and advancements in battery-swapping technology are further enabling wider adoption. Investments from public and private sectors in fast-charging solutions and renewable energy integration make electric commercial vehicles more practical. The EV charging station market, valued at USD 39.7 billion in 2024, is projected to surpass USD 350 billion by 2034.
| Market Scope | |
|---|---|
| Start Year | 2024 |
| Forecast Year | 2025-2034 |
| Start Value | $72.3 Billion |
| Forecast Value | $235.7 Billion |
| CAGR | 12.7% |
Electric commercial vehicles include pickup trucks, trucks, vans, and buses. Vans, accounting for over 36% of the market, are expected to exceed USD 50 billion by 2034. Their compact size and maneuverability make them ideal for urban logistics and last-mile deliveries. Businesses are transitioning to electric vans to lower fuel and maintenance costs while complying with low-emission zone regulations. Financial incentives and tax exemptions further enhance affordability for fleet operators.
Battery capacity segmentation includes less than 100 kWh, 101-250 kWh, 251-400 kWh, 401-550 kWh, and more than 550 kWh. The sub-100 kWh category dominated in 2024, generating USD 22 billion in revenue. Lighter battery packs enhance energy efficiency, vehicle handling, and performance. They also charge faster, making them compatible with most charging networks. The optimal range of 250-400 miles per charge balances practicality and cost-effectiveness, making smaller battery packs the preferred choice for urban mobility and commercial vans.
Electric commercial vehicles are classified into battery electric vehicles (BEV), fuel cell electric vehicles (FCEV), and hybrid commercial electric vehicles (HCEV). BEVs accounted for 50% of the market in 2024 due to lower maintenance costs and operational efficiency. With fewer moving parts than hybrids or fuel cell vehicles, BEVs reduce long-term expenses for both individuals and fleet operators. Government subsidies and stricter emission regulations further drive BEV adoption. The expansion of zero-emission zones in urban areas is accelerating this trend, making BEVs the primary choice for commercial fleets.
By end-use application, the market segments include last-mile delivery, field services, distribution services, long-haul transportation, and refuse trucks. The last-mile delivery sector is set to grow at the fastest rate of 15% CAGR, driven by e-commerce expansion and increased demand for cost-effective, sustainable transport solutions. Electric delivery vehicles offer lower fuel and maintenance costs, easy navigation in congested areas, and compliance with low-emission regulations. Their ability to optimize planned routes and schedule charging reduces downtime and enhances operational efficiency.
North America leads the global electric commercial vehicle market with a 36% share, with the U.S. generating USD 26.2 billion in revenue in 2024. Favorable policies, tax credits, grants, and infrastructure investments fuel adoption. Government initiatives encourage fleet transitions to electric power, while federal funding supports nationwide EV charging station expansion. As a result, the U.S. continues to be a major player in the global shift toward sustainable transportation.
Table of Contents
Chapter 1 Methodology & Scope
- 1.1 Research design
- 1.1.1 Research approach
- 1.1.2 Data collection methods
- 1.2 Base estimates & calculations
- 1.2.1 Base year calculation
- 1.2.2 Key trends for market estimation
- 1.3 Forecast model
- 1.4 Primary research and validation
- 1.4.1 Primary sources
- 1.4.2 Data mining sources
- 1.5 Market scope & definition
Chapter 2 Executive Summary
- 2.1 Industry 3600 synopsis, 2021 - 2034
Chapter 3 Industry Insights
- 3.1 Industry ecosystem analysis
- 3.1.1 Supplier landscape
- 3.1.1.1 Raw material suppliers
- 3.1.1.2 Component suppliers
- 3.1.1.3 Manufacturers
- 3.1.1.4 Technology providers
- 3.1.1.5 End use
- 3.1.2 Profit margin analysis
- 3.1.1 Supplier landscape
- 3.2 Technology & innovation landscape
- 3.3 Patent analysis
- 3.4 Regulatory landscape
- 3.5 Price trend
- 3.6 Impact forces
- 3.6.1 Growth drivers
- 3.6.1.1 Government policies & incentives
- 3.6.1.2 Declining battery costs
- 3.6.1.3 Corporate sustainability goals & ESG compliance
- 3.6.1.4 Urbanization & last-mile delivery growth
- 3.6.1.5 Technological advancements
- 3.6.2 Industry pitfalls & challenges
- 3.6.2.1 Regulatory and legal hurdles
- 3.6.2.2 High development costs
- 3.6.1 Growth drivers
- 3.7 Growth potential analysis
- 3.8 Porter's analysis
- 3.9 PESTEL analysis
Chapter 4 Competitive Landscape, 2024
- 4.1 Introduction
- 4.2 Company market share analysis
- 4.3 Competitive positioning matrix
- 4.4 Strategic outlook matrix
Chapter 5 Market Estimates & Forecast, By Vehicle, 2021 - 2034 ($Bn, Units)
- 5.1 Key trends
- 5.2 Pickup trucks
- 5.3 Trucks
- 5.4 Vans
- 5.5 Buses & coaches
Chapter 6 Market Estimates & Forecast, By Propulsion, 2021 - 2034 ($Bn, Units)
- 6.1 Key trends
- 6.2 BEV
- 6.3 FCEV
- 6.4 HCEV
Chapter 7 Market Estimates & Forecast, By Battery Capacity, 2021 - 2034 ($Bn, Units)
- 7.1 Key trends
- 7.2 Less than 100 KWH
- 7.3 101-250 KWH
- 7.4 251-400 KWH
- 7.5 401-550 KWH
- 7.6 More than 550 KWH
Chapter 8 Market Estimates & Forecast, By End Use, 2021 - 2034 ($Bn, Units)
- 8.1 Key trends
- 8.2 Last-mile delivery
- 8.3 Field services
- 8.4 Distribution services
- 8.5 Long-haul transportation
- 8.6 Refuse trucks
Chapter 9 Market Estimates & Forecast, By Region, 2021 - 2034 ($Bn, Units)
- 9.1 Key trends
- 9.2 North America
- 9.2.1 U.S.
- 9.2.2 Canada
- 9.3 Europe
- 9.3.1 UK
- 9.3.2 Germany
- 9.3.3 France
- 9.3.4 Italy
- 9.3.5 Spain
- 9.3.6 Russia
- 9.3.7 Nordics
- 9.4 Asia Pacific
- 9.4.1 China
- 9.4.2 India
- 9.4.3 Japan
- 9.4.4 Australia
- 9.4.5 South Korea
- 9.4.6 Southeast Asia
- 9.5 Latin America
- 9.5.1 Brazil
- 9.5.2 Mexico
- 9.5.3 Argentina
- 9.6 MEA
- 9.6.1 UAE
- 9.6.2 South Africa
- 9.6.3 Saudi Arabia
Chapter 10 Company Profiles
- 10.1 AB Volvo
- 10.2 Bollinger Motors
- 10.3 BYD
- 10.4 Dongfeng Motor
- 10.5 Ford Motor
- 10.6 Irizar Group
- 10.7 Isuzu Motors
- 10.8 IVECO
- 10.9 Mercedes Benz
- 10.10 Nikola
- 10.11 Paccar
- 10.12 Proterra
- 10.13 Renault
- 10.14 Rivian
- 10.15 Scania
- 10.16 Tata Motors
- 10.17 Tesla
- 10.18 VDL Groep
- 10.19 Workhorse Group
- 10.20 Yutong

