
人間拡張市場の機会、成長促進要因、産業動向分析、2025年~2034年の予測
Human Augmentation Market Opportunity, Growth Drivers, Industry Trend Analysis, and Forecast 2025 - 2034- 発行日
- ページ情報
- 英文 190 Pages
- 納期
- 2~3営業日
- 商品コード
- 1685060
- カスタマイズ可能 お客様のご希望に応じて、既存データの加工や未掲載情報(例:国別セグメント)の追加などの対応が可能です。詳細はお問い合わせください。
- 翻訳ツール提供対象 PDF対応AI翻訳ツールの無料貸し出しサービスのご利用が可能です
概要
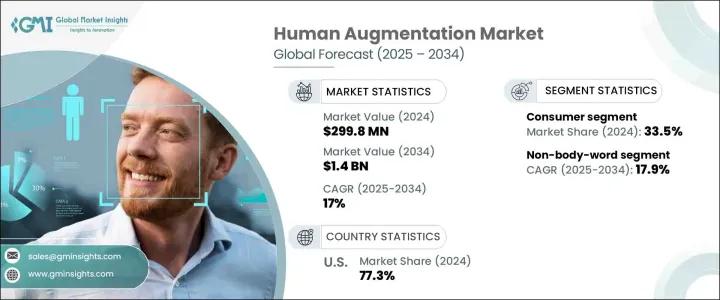
人間拡張の世界市場は、2024年に2億9,980万米ドルと評価され、2025年から2034年にかけて17%の著しいCAGRを示すと予想されています。
人間拡張は、ウェアラブルデバイス、インプラント、人工装具などの先進技術を通じて、人間の能力を高める方法に革命をもたらしています。これらの技術革新は、身体機能、認知機能、感覚機能を強化するように設計されており、医療リハビリテーション、パフォーマンス最適化、補助アプリケーションにおいて重要なソリューションを提供しています。急速に進化するこの分野は、ヘルスケアソリューションに対するニーズの高まりや、日常生活と専門産業の両方におけるパフォーマンス向上技術に対する需要の高まりに後押しされ、さまざまな分野で新たな可能性を引き出しています。
ウェアラブル技術の採用急増は、この市場拡大の主な要因です。消費者は、フィットネストラッカー、スマートウォッチ、ヘルスモニターなどのデバイスにますます依存し、身体の健康を追跡・改善するようになっています。これらのデバイスは日常生活に不可欠なものとなりつつあり、リアルタイムの洞察を提供し、生活全体の質の向上に貢献しています。ウェアラブルデバイスの絶え間ない技術革新は、人間拡張技術のさらなる進歩を促し、これらのデバイスが実現できることの限界を押し広げています。技術がより身近で使いやすくなるにつれ、市場では、健康上の利点とライフスタイルの向上の両方を提供する拡張製品への需要が着実に増加しています。
| 市場範囲 | |
|---|---|
| 開始年 | 2024 |
| 予測年 | 2025-2034 |
| 開始金額 | 2億9,980万米ドル |
| 予測金額 | 14億米ドル |
| CAGR | 17% |
人間拡張市場は、消費者向け、商業向け、医療向け、防衛向け、産業向け、その他など、いくつかの用途に分類されます。2024年には、消費者向け分野が33.5%の市場シェアを獲得して市場をリードしました。この優位性は、ウェアラブル技術と美容増強ソリューションの人気の高まりによるところが大きいです。これらのソリューションは、機能性の向上と審美的な改善の両方に対する需要の高まりに対応するもので、個人的な向上への欲求に応えるものです。これらの技術の入手しやすさと手頃な価格が改善されるにつれて、消費者セクターは持続的な成長を遂げようとしています。また、義肢装具、外骨格、ブレイン・コンピュータ・インターフェイスの革新に牽引され、商業・医療分野でも採用が増加しています。
機能に関しては、市場は身体装着型、非身体装着型、その他のソリューションに区分されます。このうち、非体型装着型は最も高い成長が見込まれており、予測期間中のCAGRは17.9%と予測されています。この成長は、人間拡張の新たな可能性を開いている埋め込み型技術やブレイン・コンピュータ・インターフェイスの躍進によるところが大きいです。これらの進歩により、より洗練された健康モニタリング、認知機能強化、感覚回復ソリューションが可能になり、非身体装着型カテゴリーの拡大にさらに拍車をかけています。
人間拡張市場では米国が依然として優位を保っており、2024年の市場シェアは77.3%に達します。この優位性は、強固な技術エコシステム、広範な研究開発投資、義肢、ウェアラブルデバイス、外骨格を含むヘルスケアの進歩への強い注力によってもたらされています。国防部門の関与もこの成長に寄与しており、高度な人間拡張技術を活用して厳しい環境下でのパフォーマンス、適応性、回復力を強化することに重点が置かれています。米国は人間拡張の未来を形作る上で主導権を握り続け、ヘルスケアと産業用アプリケーションの両方で技術革新の限界に挑んでいます。
目次
第1章 調査手法と調査範囲
- 市場範囲と定義
- 基本推定と計算
- 予測計算
- データソース
第2章 エグゼクティブサマリー
第3章 業界洞察
- エコシステム分析
- バリューチェーンに影響を与える要因
- 利益率分析
- ディスラプション
- 将来の展望
- メーカー
- 流通業者
- サプライヤーの状況
- 利益率分析
- 主要ニュース
- 規制状況
- 影響要因
- 促進要因
- パフォーマンス向上への需要の高まり
- AIとの統合の進展
- 拡張現実(AR)と仮想現実(VR)への関心の高まり
- 技術的進歩の高まり
- 業界の潜在的リスク&課題
- 倫理的・社会的懸念
- 依存と中毒
- 促進要因
- 成長可能性分析
- ポーター分析
- PESTEL分析
第4章 競合情勢
- イントロダクション
- 企業シェア分析
- 競合のポジショニング・マトリックス
- 戦略展望マトリックス
第5章 市場推計・予測:製品タイプ別、2021年~2034年
- 主要動向
- ウェアラブルデバイス
- バーチャルリアリティデバイス
- 拡張現実デバイス
- 外骨格
- バーチャルアシスタント
- その他
第6章 市場推計・予測:機能別、2021年~2034年
- 主要動向
- 装着式
- 非装着式
- その他
第7章 市場推計・予測:用途別、2021年~2034年
- 主要動向
- コンシューマー
- 商業
- 医療
- 防衛
- 産業
- その他
第8章 市場推計・予測:地域別、2021年~2034年
- 主要動向
- 北米
- 米国
- カナダ
- 欧州
- 英国
- ドイツ
- フランス
- イタリア
- スペイン
- ロシア
- アジア太平洋
- 中国
- インド
- 日本
- 韓国
- オーストラリア
- ラテンアメリカ
- ブラジル
- メキシコ
- 中東・アフリカ
- 南アフリカ
- サウジアラビア
- アラブ首長国連邦
第9章 企業プロファイル
- Boston Dynamics
- B-Temia Inc.
- Ekso Bionics Holdings, Inc.
- German Bionic Systems GmbH
- Google LLC(Alphabet Inc.)
- HTF Market Intelligence Consulting Pvt. Ltd.
- Magic Leap, Inc.
- Microsoft Corporation
- Nvidia Corporation
- Open Bionics
- Robotics 24/7
- ReWalk Robotics
- Samsung Electronics Co., Ltd.
- Sony Corporation
- Stryker Corporation
- Wearable Robotics SRL
- Xenoma Inc.
目次
The Global Human Augmentation Market, valued at USD 299.8 million in 2024, is expected to witness a remarkable CAGR of 17% from 2025 to 2034. Human augmentation is revolutionizing how we enhance human abilities through advanced technologies like wearable devices, implants, and prosthetics. These innovations are designed to enhance physical, cognitive, and sensory functions, providing critical solutions in medical rehabilitation, performance optimization, and assistive applications. This rapidly evolving field is unlocking new possibilities across various sectors, driven by the increasing need for healthcare solutions, as well as the rising demand for performance-enhancing technologies in both everyday life and specialized industries.
The surge in wearable technology adoption is a primary driver of this market's expansion. Consumers are increasingly relying on devices like fitness trackers, smartwatches, and health monitors to track and improve their physical well-being. These devices are becoming integral to daily routines, offering real-time insights and contributing to overall quality of life. The continuous innovation in wearable devices is sparking further advancements in human augmentation technologies, pushing the boundaries of what these devices can achieve. As technology becomes more accessible and user-friendly, the market is seeing a steady increase in demand for augmented products that provide both health benefits and lifestyle enhancements.
| Market Scope | |
|---|---|
| Start Year | 2024 |
| Forecast Year | 2025-2034 |
| Start Value | $299.8 Million |
| Forecast Value | $1.4 Billion |
| CAGR | 17% |
The human augmentation market is categorized by several applications, including consumer, commercial, medical, defense, industrial, and others. The consumer segment led the market in 2024, with a substantial 33.5% market share. This dominance is largely attributed to the growing popularity of wearable technologies and cosmetic augmentation solutions. These solutions cater to an increasing demand for both enhanced functionality and aesthetic improvements, tapping into the desire for personal enhancement. As the accessibility and affordability of these technologies improve, the consumer sector is poised for sustained growth. The commercial and medical sectors are also witnessing increased adoption, driven by innovations in prosthetics, exoskeletons, and brain-computer interfaces.
Regarding functionality, the market is segmented into body-worn, non-body-worn, and other solutions. Among these, the non-body-worn segment is anticipated to experience the highest growth, with a projected CAGR of 17.9% during the forecast period. This growth is largely due to breakthroughs in implantable technologies and brain-computer interfaces, which are opening new possibilities for human augmentation. These advancements are allowing for more sophisticated health monitoring, cognitive enhancement, and sensory restoration solutions, further fueling the expansion of the non-body-worn category.
The United States remains a dominant player in the human augmentation market, holding a significant 77.3% market share in 2024. This dominance is driven by a robust technology ecosystem, extensive research and development investments, and a strong focus on healthcare advancements, including prosthetics, wearable devices, and exoskeletons. The defense sector's involvement is also contributing to this growth, with a focus on leveraging advanced human augmentation technologies to enhance performance, adaptability, and resilience in challenging environments. The U.S. continues to lead the charge in shaping the future of human augmentation, pushing the envelope on innovation in both healthcare and industrial applications.
Table of Contents
Chapter 1 Methodology & Scope
- 1.1 Market scope & definitions
- 1.2 Base estimates & calculations
- 1.3 Forecast calculations
- 1.4 Data sources
- 1.4.1 Primary
- 1.4.2 Secondary
- 1.4.2.1 Paid sources
- 1.4.2.2 Public sources
Chapter 2 Executive Summary
- 2.1 Industry synopsis, 2021-2034
Chapter 3 Industry Insights
- 3.1 Industry ecosystem analysis
- 3.1.1 Factor affecting the value chain
- 3.1.2 Profit margin analysis
- 3.1.3 Disruptions
- 3.1.4 Future outlook
- 3.1.5 Manufacturers
- 3.1.6 Distributors
- 3.2 Supplier landscape
- 3.3 Profit margin analysis
- 3.4 Key news & initiatives
- 3.5 Regulatory landscape
- 3.6 Impact forces
- 3.6.1 Growth drivers
- 3.6.1.1 Increasing demand for enhanced performance
- 3.6.1.2 Growing integration of AI
- 3.6.1.3 Growing interest in Augmented Reality (AR) and Virtual Reality (VR)
- 3.6.1.4 Growing technological advancements
- 3.6.2 Industry pitfalls & challenges
- 3.6.2.1 Ethical and societal concerns
- 3.6.2.2 Dependency and addiction
- 3.6.1 Growth drivers
- 3.7 Growth potential analysis
- 3.8 Porter’s analysis
- 3.9 PESTEL analysis
Chapter 4 Competitive Landscape, 2024
- 4.1 Introduction
- 4.2 Company market share analysis
- 4.3 Competitive positioning matrix
- 4.4 Strategic outlook matrix
Chapter 5 Market Estimates & Forecast, By Product Type, 2021-2034 (USD Million)
- 5.1 Key trends
- 5.2 wearable devices
- 5.3 virtual reality devices
- 5.4 augmented reality devices
- 5.5 exoskeletons
- 5.6 intelligent virtual assistants
- 5.7 others
Chapter 6 Market Estimates & Forecast, By Functionality, 2021-2034 (USD Million)
- 6.1 Key trends
- 6.2 Body-worn
- 6.3 Non-body-worn
- 6.4 Others
Chapter 7 Market Estimates & Forecast, By Application, 2021-2034 (USD Million)
- 7.1 Key trends
- 7.2 Consumer
- 7.3 Commercial
- 7.4 Medical
- 7.5 Defense
- 7.6 Industrial
- 7.7 Others
Chapter 8 Market Estimates & Forecast, By Region, 2021-2034 (USD Million)
- 8.1 Key trends
- 8.2 North America
- 8.2.1 U.S.
- 8.2.2 Canada
- 8.3 Europe
- 8.3.1 UK
- 8.3.2 Germany
- 8.3.3 France
- 8.3.4 Italy
- 8.3.5 Spain
- 8.3.6 Russia
- 8.4 Asia Pacific
- 8.4.1 China
- 8.4.2 India
- 8.4.3 Japan
- 8.4.4 South Korea
- 8.4.5 Australia
- 8.5 Latin America
- 8.5.1 Brazil
- 8.5.2 Mexico
- 8.6 MEA
- 8.6.1 South Africa
- 8.6.2 Saudi Arabia
- 8.6.3 UAE
Chapter 9 Company Profiles
- 9.1 Boston Dynamics
- 9.2 B-Temia Inc.
- 9.3 Ekso Bionics Holdings, Inc.
- 9.4 German Bionic Systems GmbH
- 9.5 Google LLC (Alphabet Inc.)
- 9.6 HTF Market Intelligence Consulting Pvt. Ltd.
- 9.7 Magic Leap, Inc.
- 9.8 Microsoft Corporation
- 9.9 Nvidia Corporation
- 9.10 Open Bionics
- 9.11 Robotics 24/7
- 9.12 ReWalk Robotics
- 9.13 Samsung Electronics Co., Ltd.
- 9.14 Sony Corporation
- 9.15 Stryker Corporation
- 9.16 Wearable Robotics SRL
- 9.17 Xenoma Inc.
- 発行日
- 発行
- Global Market Insights Inc.
- ページ情報
- 英文 190 Pages
- 納期
- 2~3営業日


