
|
市場調査レポート
商品コード
1684853
教育用スマートディスプレイ市場の機会、成長促進要因、産業動向分析、2025年~2034年の予測Education Smart Display Market Opportunity, Growth Drivers, Industry Trend Analysis, and Forecast 2025-2034 |
||||||
カスタマイズ可能
|
|||||||
| 教育用スマートディスプレイ市場の機会、成長促進要因、産業動向分析、2025年~2034年の予測 |
|
出版日: 2025年01月09日
発行: Global Market Insights Inc.
ページ情報: 英文 189 Pages
納期: 2~3営業日
|

全表示
- 概要
- 目次
教育用スマートディスプレイの世界市場規模は2024年に32億米ドルとなり、2025年から2034年までのCAGRは5.7%になると予測されています。
この市場を牽引しているのは、革新的かつインタラクティブな学習ソリューションに対するニーズの高まりであり、世界中の教育機関が学習への取り組み、コラボレーション、学習成果全体を向上させるデジタルツールを取り入れています。教室における先端技術の統合は、従来の教育方法を変革し、教育者によりダイナミックで柔軟な教育環境を提供しています。個別学習と生徒の学習意欲の向上への注目の高まりは、スマート・ディスプレイ・ソリューションの需要を押し上げ続けています。教育機関が、ますますデジタル化する世界に生徒を送り出すことを目指しているため、スマートディスプレイは、さまざまな教育スタイルをサポートするインタラクティブな学習雰囲気を醸成する上で極めて重要になっています。
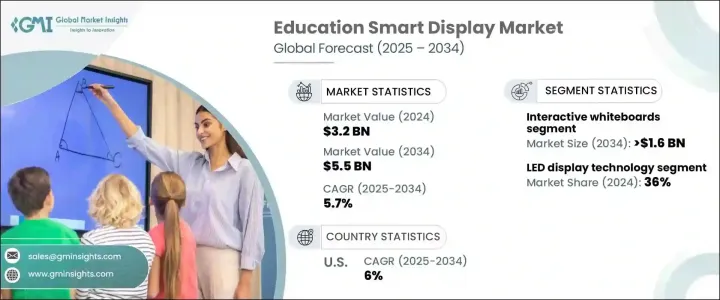
教育用スマートディスプレイ市場は、製品タイプ別にビデオウォール、インタラクティブ・ホワイトボード、インタラクティブ・フラットパネル、インタラクティブ・プロジェクター、その他に分けられます。このうち、インタラクティブ・ホワイトボード分野は市場をリードし、2034年までに16億米ドルに達すると予想されています。これらのインタラクティブ・ホワイトボードは、生徒と教師がリアルタイムでデジタル・コンテンツと対話できるダイナミックな共同作業環境を提供することで、教室に革命をもたらしています。インタラクティブで個別化された学習ソリューションの採用が増加しているため、この分野の人気は急速に高まっています。柔軟性があるため、教育機関はさまざまな教育方法に対応できるとともに、生徒の学習意欲と学習成果を向上させることができます。
| 市場範囲 | |
|---|---|
| 開始年 | 2024 |
| 予測年 | 2025-2034 |
| 開始金額 | 32億米ドル |
| 予測金額 | 55億米ドル |
| CAGR | 5.7% |
ディスプレイ技術を見ると、市場はLCD、LED、OLED技術に分けられます。LEDディスプレイが優勢で、2024年の市場シェアは36%を占めると予想されます。優れた輝度、エネルギー効率、長寿命で知られるLEDディスプレイは、教育環境に適した選択肢です。高品質のビジュアルを生成し、インタラクティブなツールとシームレスに統合するその能力により、教室や講義室では不可欠なものとなっています。持続可能性を念頭に置くと、教育機関は費用対効果と環境面での利点からLEDディスプレイを支持し、世界中の学校でますます人気が高まっています。
北米の教育用スマートディスプレイ市場は安定したペースで成長し、2024年のCAGRは6%と予想されています。米国では、確立されたデジタルインフラと教育技術への多額の投資が市場を後押ししています。米国の教育セクターは、学習体験を向上させるために、教室や講義室にスマートディスプレイを急速に導入しています。デジタル教育に対する政府の取り組みや民間部門の投資は、こうした技術の採用をさらに後押ししており、同地域を世界市場の成長促進要因の1つにしています。教育機関がデジタル学習ツールの進歩に注力する中、革新的で効果的なスマートディスプレイ・ソリューションに対する需要は高まり続けると思われます。
目次
第1章 調査手法と調査範囲
- 市場範囲と定義
- 基本推定と計算
- 予測計算
- データソース
- 1次データ
- 二次資料
- 有料情報源
- 公的情報源
第2章 エグゼクティブサマリー
第3章 業界洞察
- エコシステム分析
- バリューチェーンに影響を与える要因
- 利益率分析
- 破壊
- 将来の展望
- メーカー
- 流通業者
- サプライヤーの状況
- 利益率分析
- 主要ニュース
- 規制状況
- 影響要因
- 促進要因
- 製品タイプ、ディスプレイサイズ、ディスプレイ技術、アプリケーション、エンドユーザー
- デジタル学習ソリューションの採用増加
- 政府のイニシアティブと資金提供の増加
- 共同学習に対する需要の急増
- ハイブリッド学習や遠隔学習への世界的シフト
- STEM教育と没入型学習への注目
- 業界の潜在的リスク&課題
- コストと予算の制約
- データプライバシーとセキュリティへの懸念
- 成長可能性分析
- ポーター分析
- PESTEL分析
第4章 競合情勢
- イントロダクション
- 企業シェア分析
- 競合のポジショニング・マトリックス
- 戦略展望マトリックス
第5章 市場推計・予測:製品タイプ別、2021年~2034年
- 主要動向
- ビデオウォール
- インタラクティブホワイトボード
- インタラクティブ・フラットパネル
- インタラクティブプロジェクター
- その他
第6章 市場規模推計・予測:ディスプレイサイズ別、2021年~2034年
- 主要動向
- 小型(50インチ以下)
- 中型(50~70インチ)
- 大型(70インチ以上)
第7章 ディスプレイサイズ別市場推計・予測:ディスプレイ技術別、2021年~2034年
- 主要動向
- LCD
- LED
- 有機EL
第8章 市場推計・予測:アプリケーション別、2021-2034年
- 主要動向
- 教室での授業
- インタラクティブ・プレゼンテーション
- 遠隔学習
- 共同学習
- その他
第9章 市場推計・予測:エンドユース別、2021年~2034年
- 主要動向
- K-12学校
- 高等教育機関
- コーチングセンター
- 企業トレーニングセンター
- その他
第10章 市場推計・予測:地域別、2021年~2034年
- 主要動向
- 北米
- 米国
- カナダ
- 欧州
- 英国
- ドイツ
- フランス
- イタリア
- スペイン
- ロシア
- アジア太平洋
- 中国
- インド
- 日本
- 韓国
- オーストラリア
- その他アジア太平洋地域
- ラテンアメリカ
- ブラジル
- メキシコ
- その他ラテンアメリカ
- 中東・アフリカ
- 南アフリカ
- サウジアラビア
- アラブ首長国連邦
- その他中東・アフリカ
第11章 企業プロファイル
- Apple Inc
- Aser
- Asus
- Barco
- BenQ
- Christie Digital Systems USA, Inc.
- Epson
- Fujitsu
- Globus Infocom Limited
- HP Inc.
- Lenovo
- LG Electronics
- Newline Interactive Inc.
- Optoma Corporation
- Panasonic Holdings Corporation
- PPDS(PHILIPS)
- Promethean World Ltd.
- SAMSUNG
- Sharp NEC Display Solutions
- SMART Technologies ULC
- Sony Group Corporation
- Toshiba Corporation
- ViewSonic Corporation
The Global Education Smart Display Market was valued at USD 3.2 billion in 2024 and is expected to experience a CAGR of 5.7% from 2025 to 2034. This market is being driven by the increasing need for innovative and interactive learning solutions as educational institutions worldwide embrace digital tools that enhance engagement, collaboration, and overall learning outcomes. The integration of advanced technology in classrooms is transforming traditional teaching methods, providing educators with more dynamic and flexible teaching environments. The growing focus on personalized learning and improving student engagement continues to push the demand for smart display solutions. As educational institutions aim to prepare students for an increasingly digital world, smart displays have become crucial in fostering an interactive learning atmosphere that supports a variety of teaching styles.
The education smart display market is divided by product type into video walls, interactive whiteboards, interactive flat panels, interactive projectors, and others. Among these, the interactive whiteboards segment is expected to lead the market, reaching USD 1.6 billion by 2034. These interactive whiteboards are revolutionizing classrooms by offering dynamic, collaborative environments where students and teachers can interact with digital content in real time. This segment's popularity is growing rapidly due to the increasing adoption of interactive and personalized learning solutions. The flexibility they provide allows institutions to adapt to various teaching methods while improving student engagement and learning outcomes.
| Market Scope | |
|---|---|
| Start Year | 2024 |
| Forecast Year | 2025-2034 |
| Start Value | $3.2 Billion |
| Forecast Value | $5.5 Billion |
| CAGR | 5.7% |
When looking at display technology, the market is divided into LCD, LED, and OLED technologies. LED displays are expected to dominate, accounting for a 36% market share in 2024. Recognized for their superior brightness, energy efficiency, and long lifespan, LED displays are the preferred choice for educational environments. Their ability to produce high-quality visuals and integrate seamlessly with interactive tools has made them essential in classrooms and lecture halls. With sustainability in mind, educational institutions favor LED displays for their cost-effectiveness and environmental benefits, making them an increasingly popular choice in schools worldwide.
The North American education smart display market is expected to grow at a steady pace, with a CAGR of 6% during 2024. In the United States, the market is fueled by a well-established digital infrastructure and significant investments in educational technology. The U.S. education sector is rapidly adopting smart displays in classrooms and lecture halls to enhance learning experiences. Government initiatives and private sector investments in digital education further support the adoption of these technologies, making the region one of the key drivers of growth in the global market. As educational institutions focus on advancing digital learning tools, the demand for innovative and effective smart display solutions will continue to rise.
Table of Contents
Chapter 1 Methodology & Scope
- 1.1 Market scope & definitions
- 1.2 Base estimates & calculations
- 1.3 Forecast calculations
- 1.4 Data sources
- 1.4.1 Primary
- 1.4.2 Secondary
- 1.4.2.1 Paid sources
- 1.4.2.2 Public sources
Chapter 2 Executive Summary
- 2.1 Industry synopsis, 2021-2034
Chapter 3 Industry Insights
- 3.1 Industry ecosystem analysis
- 3.1.1 Factor affecting the value chain
- 3.1.2 Profit margin analysis
- 3.1.3 Disruptions
- 3.1.4 Future outlook
- 3.1.5 Manufacturers
- 3.1.6 Distributors
- 3.2 Supplier landscape
- 3.3 Profit margin analysis
- 3.4 Key news & initiatives
- 3.5 Regulatory landscape
- 3.6 Impact forces
- 3.7 Growth drivers
- 3.7.1 Product Type, display size, display technology, application, end user
- 3.7.2 Increased adoption of digital learning solutions
- 3.7.3 Rising government initiatives and funding
- 3.7.4 Surge in demand for collaborative learning
- 3.7.5 Global shift towards hybrid and remote learning
- 3.7.6 Focus on STEM education and immersive learning
- 3.8 Industry pitfalls & challenges
- 3.8.1 Cost and budget constraints
- 3.8.2 Data privacy and security concerns
- 3.9 Growth potential analysis
- 3.10 Porter’s analysis
- 3.11 PESTEL analysis
Chapter 4 Competitive Landscape, 2023
- 4.1 Introduction
- 4.2 Company market share analysis
- 4.3 Competitive positioning matrix
- 4.4 Strategic outlook matrix
Chapter 5 Market Estimates & Forecast, By Product Type, 2021-2034 (USD billion)
- 5.1 Key trends
- 5.2 Video wall
- 5.3 Interactive whiteboards
- 5.4 Interactive flat panels
- 5.5 Interactive projectors
- 5.6 Others
Chapter 6 Market Estimates & Forecast, By Display Size, 2021-2034 (USD billion)
- 6.1 Key trends
- 6.2 Small (Below 50 inches)
- 6.3 Medium (50-70 inches)
- 6.4 Large (Above 70 inches)
Chapter 7 Market Estimates & Forecast, By Display Technology, 2021-2034 (USD billion)
- 7.1 Key trends
- 7.2 LCD
- 7.3 LED
- 7.4 OLED
Chapter 8 Market Estimates & Forecast, By Application, 2021-2034 (USD billion)
- 8.1 Key trends
- 8.2 Classroom teaching
- 8.3 Interactive presentations
- 8.4 Distance learning
- 8.5 Collaborative learning
- 8.6 Others
Chapter 9 Market Estimates & Forecast, By End Use, 2021-2034 (USD billion)
- 9.1 Key trends
- 9.2 K-12 Schools
- 9.3 Higher education institutions
- 9.4 Coaching centers
- 9.5 Corporate training centers
- 9.6 Others
Chapter 10 Market Estimates & Forecast, By Region, 2021-2034 (USD billion)
- 10.1 Key trends
- 10.2 North America
- 10.2.1 U.S.
- 10.2.2 Canada
- 10.3 Europe
- 10.3.1 UK
- 10.3.2 Germany
- 10.3.3 France
- 10.3.4 Italy
- 10.3.5 Spain
- 10.3.6 Russia
- 10.4 Asia Pacific
- 10.4.1 China
- 10.4.2 India
- 10.4.3 Japan
- 10.4.4 South Korea
- 10.4.5 Australia
- 10.4.6 Rest of Asia Pacific
- 10.5 Latin America
- 10.5.1 Brazil
- 10.5.2 Mexico
- 10.5.3 Rest of Latin America
- 10.6 MEA
- 10.6.1 South Africa
- 10.6.2 Saudi Arabia
- 10.6.3 UAE
- 10.6.4 Rest of MEA
Chapter 11 Company Profiles
- 11.1 Apple Inc
- 11.2 Aser
- 11.3 Asus
- 11.4 Barco
- 11.5 BenQ
- 11.6 Christie Digital Systems USA, Inc.
- 11.7 Epson
- 11.8 Fujitsu
- 11.9 Globus Infocom Limited
- 11.10 HP Inc.
- 11.11 Lenovo
- 11.12 LG Electronics
- 11.13 Newline Interactive Inc.
- 11.14 Optoma Corporation
- 11.15 Panasonic Holdings Corporation
- 11.16 PPDS (PHILIPS)
- 11.17 Promethean World Ltd.
- 11.18 SAMSUNG
- 11.19 Sharp NEC Display Solutions
- 11.20 SMART Technologies ULC
- 11.21 Sony Group Corporation
- 11.22 Toshiba Corporation
- 11.23 ViewSonic Corporation
