
|
市場調査レポート
商品コード
1665075
商業船舶用選択触媒還元システム市場の機会、成長促進要因、産業動向分析、2025年~2034年の予測Commercial Marine Selective Catalytic Reduction Systems Market Opportunity, Growth Drivers, Industry Trend Analysis, and Forecast 2025 - 2034 |
||||||
カスタマイズ可能
|
|||||||
| 商業船舶用選択触媒還元システム市場の機会、成長促進要因、産業動向分析、2025年~2034年の予測 |
|
出版日: 2024年12月12日
発行: Global Market Insights Inc.
ページ情報: 英文 102 Pages
納期: 2~3営業日
|

全表示
- 概要
- 目次
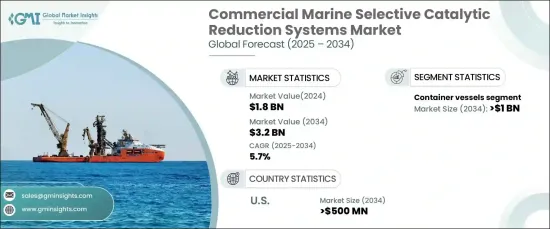
商業船舶用選択触媒還元システムの世界市場は、2024年に18億米ドルの評価額を達成し、2025年から2034年にかけてCAGR 5.7%で成長すると予測されています。
これらのシステムは、船舶用エンジンから排出される窒素酸化物(NOx)を劇的に削減するために設計された、排出ガス制御技術における重要な技術革新です。尿素ベースの溶液を排気流に導入することで、SCRシステムは触媒上で化学反応を引き起こし、有害なNOxガスを無害な窒素と水蒸気に変換します。この先進技術は、IMOのTier III規制のような厳しい環境基準への適合を保証するだけでなく、持続可能な海洋事業を推進する広範な動きにも合致しています。環境に配慮した船舶運航が重視され、より大型で燃料効率の高い船舶の生産が増加する中、SCRシステムの需要は世界中で高まっています。
船舶用SCRシステムは、運航効率目標と規制要件の両方を満たす上で極めて重要な役割を果たすため、貨物船、タンカー、ばら積み貨物船、ロールオン/ロールオフ船など、さまざまなタイプの船舶で広く採用されています。世界貿易が拡大し続ける中、海運における先進的な排ガス規制ソリューションの必要性が高まり、市場は力強い成長を遂げようとしています。燃料費の高騰は、事業者に燃料消費の最適化をさらに迫り、排出削減システムの採用を間接的に後押ししています。規制機関や業界の利害関係者が排出ガス規制の国際水域への拡大について議論する中、SCR技術の採用への注目が高まっています。これらのシステムは、コンプライアンスを強化するだけでなく、よりクリーンな海運慣行をサポートすることで、業界の長期的な持続可能性への取り組みにも貢献しています。
| 市場範囲 | |
|---|---|
| 開始年 | 2024 |
| 予測年 | 2025-2034 |
| 開始金額 | 18億米ドル |
| 予測金額 | 32億米ドル |
| CAGR | 5.7% |
市場内のコンテナ船セグメントは、コンテナ貿易の急増と、より大型で高性能な船舶の建造を反映して、2034年までに10億米ドルを生み出すと予測されています。環境に優しい輸送方法を促進するインセンティブが、SCRシステムの導入をオペレーターにさらに促しています。このようなイニシアチブは、海運業界の環境への影響を軽減し、持続可能な貿易ルートを育成するための世界の取り組みと一致しています。
米国では、船舶用SCRシステム市場は2034年までに5億米ドルに達すると予測されており、これは排出量削減を目的とした対象を絞ったインセンティブ・プログラムによるものです。クリーン・エネルギー・イニシアチブの下で提供されることの多い、古い船舶を先進的な排出技術で改造するための財政支援は、採用の主要な推進力となっています。グリーン輸送回廊やその他の気候変動に焦点を当てた戦略の実施は、SCRシステムの導入をさらに加速すると予想されます。さらに、東海岸と西海岸の米国港湾はゼロエミッション政策を進めており、SCR技術を搭載した船舶の停泊料の減額や優先処理などの特典を提供しています。これらのイニシアチブは、排ガス規制ソリューションのリーダーとして、また持続可能な海事慣行の推進へのコミットメントとして、この地域が注目されつつあることを強調するものです。
目次
第1章 調査手法と調査範囲
- 調査デザイン
- 基本推定と計算
- 予測モデル
- 1次調査と検証
- 一次情報
- データマイニングソース
- 市場の定義
第2章 エグゼクティブサマリー
第3章 業界洞察
- 業界エコシステム
- 規制状況
- 業界への影響要因
- 促進要因
- 業界の潜在的リスク&課題
- 成長可能性分析
- ポーターの分析
- 供給企業の交渉力
- 買い手の交渉力
- 新規参入業者の脅威
- 代替品の脅威
- PESTEL分析
第4章 競争情勢
- イントロダクション
- 戦略ダッシュボード
- イノベーションとテクノロジーの展望
第5章 市場規模・予測:用途別、2021年~2034年
- 主要動向
- コンテナ船
- タンカー
- バルクキャリア
- ロールオン/ロールオフ
- その他
第6章 市場規模・予測:地域別、2021年~2034年
- 主要動向
- 北米
- 米国
- カナダ
- 欧州
- ドイツ
- 英国
- イタリア
- ノルウェー
- フランス
- ロシア
- デンマーク
- アジア太平洋
- 中国
- 日本
- インド
- 韓国
- オーストラリア
- ベトナム
- 中東・アフリカ
- サウジアラビア
- アラブ首長国連邦
- 南アフリカ
- アンゴラ
- ラテンアメリカ
- ブラジル
- アルゼンチン
- メキシコ
第7章 企業プロファイル
- Ceco Environmental
- DEC Marine
- H+H Engineering &Service
- Hitachi Zosen Corporation
- Kwang Sung
- Lindenberg-Anlagen
- Mitsubishi Heavy Industries
- MAN Energy Solutions
- Nett Technologies
- Wartsila
- Yara International
The Global Commercial Marine Selective Catalytic Reduction Systems Market achieved a valuation of USD 1.8 billion in 2024 and is anticipated to grow at a CAGR of 5.7% from 2025 to 2034. These systems represent a critical innovation in emission control technology, designed to dramatically reduce nitrogen oxide (NOx) emissions from marine engines. By introducing a urea-based solution into exhaust streams, SCR systems trigger a chemical reaction over a catalyst, converting harmful NOx gases into harmless nitrogen and water vapor. This advanced technology not only ensures compliance with stringent environmental standards like the IMO Tier III regulations but also aligns with the broader push for sustainable marine operations. With the growing emphasis on eco-friendly shipping practices and the increasing production of larger, more fuel-efficient vessels, the demand for SCR systems is rising across the globe.
Marine SCR systems are widely adopted by various types of vessels, including cargo ships, tankers, bulk carriers, and roll-on/roll-off ships, as they play a pivotal role in meeting both operational efficiency goals and regulatory requirements. The market is poised for robust growth as global trade continues to expand, driven by the need for advanced emission-control solutions in shipping. Rising fuel costs further compel operators to optimize fuel consumption, indirectly bolstering the adoption of emission-reduction systems. As regulatory bodies and industry stakeholders discuss extending emission regulations to international waters, the focus on adopting SCR technologies is intensifying. These systems not only enhance compliance but also contribute to the industry's long-term sustainability efforts by supporting cleaner shipping practices.
| Market Scope | |
|---|---|
| Start Year | 2024 |
| Forecast Year | 2025-2034 |
| Start Value | $1.8 Billion |
| Forecast Value | $3.2 Billion |
| CAGR | 5.7% |
The container vessel segment within the market is projected to generate USD 1 billion by 2034, reflecting the surge in containerized trade and the construction of larger, more advanced ships. Incentives promoting environmentally friendly shipping methods are further encouraging operators to implement SCR systems. Such initiatives align with global efforts to reduce the maritime industry's environmental impact and foster sustainable trade routes.
In the United States, the marine SCR systems market is forecasted to reach USD 500 million by 2034, fueled by targeted incentive programs aimed at reducing emissions. Financial support for retrofitting older vessels with advanced emission technologies, often provided under clean energy initiatives, has been a key driver of adoption. The implementation of green shipping corridors and other climate-focused strategies is expected to further accelerate the deployment of SCR systems. Additionally, U.S. ports on the East and West Coasts are advancing zero-emission policies, offering benefits such as reduced docking fees and priority processing for vessels equipped with SCR technologies. These initiatives underscore the region's growing prominence as a leader in emission-control solutions and its commitment to advancing sustainable maritime practices.
Table of Contents
Chapter 1 Methodology & Scope
- 1.1 Research design
- 1.2 Base estimates & calculations
- 1.3 Forecast model
- 1.4 Primary research & validation
- 1.4.1 Primary sources
- 1.4.2 Data mining sources
- 1.5 Market Definitions
Chapter 2 Executive Summary
- 2.1 Industry synopsis, 2021 – 2034
Chapter 3 Industry Insights
- 3.1 Industry ecosystem
- 3.2 Regulatory landscape
- 3.3 Industry impact forces
- 3.3.1 Growth drivers
- 3.3.2 Industry pitfalls & challenges
- 3.4 Growth potential analysis
- 3.5 Porter's analysis
- 3.5.1 Bargaining power of suppliers
- 3.5.2 Bargaining power of buyers
- 3.5.3 Threat of new entrants
- 3.5.4 Threat of substitutes
- 3.6 PESTEL analysis
Chapter 4 Competitive landscape, 2024
- 4.1 Introduction
- 4.2 Strategic dashboard
- 4.3 Innovation & technology landscape
Chapter 5 Market Size and Forecast, By Application, 2021 – 2034 (USD Billion & Units)
- 5.1 Key trends
- 5.2 Container vessels
- 5.3 Tankers
- 5.4 Bulk carriers
- 5.5 Roll On/Roll Off
- 5.6 Others
Chapter 6 Market Size and Forecast, By Region, 2021 – 2034 (USD Billion & Units)
- 6.1 Key trends
- 6.2 North America
- 6.2.1 U.S.
- 6.2.2 Canada
- 6.3 Europe
- 6.3.1 Germany
- 6.3.2 UK
- 6.3.3 Italy
- 6.3.4 Norway
- 6.3.5 France
- 6.3.6 Russia
- 6.3.7 Denmark
- 6.4 Asia Pacific
- 6.4.1 China
- 6.4.2 Japan
- 6.4.3 India
- 6.4.4 South Korea
- 6.4.5 Australia
- 6.4.6 Vietnam
- 6.5 Middle East & Africa
- 6.5.1 Saudi Arabia
- 6.5.2 UAE
- 6.5.3 South Africa
- 6.5.4 Angola
- 6.6 Latin America
- 6.6.1 Brazil
- 6.6.2 Argentina
- 6.6.3 Mexico
Chapter 7 Company Profiles
- 7.1 Ceco Environmental
- 7.2 DEC Marine
- 7.3 H+H Engineering & Service
- 7.4 Hitachi Zosen Corporation
- 7.5 Kwang Sung
- 7.6 Lindenberg-Anlagen
- 7.7 Mitsubishi Heavy Industries
- 7.8 MAN Energy Solutions
- 7.9 Nett Technologies
- 7.10 Wartsila
- 7.11 Yara International

